Market data
Arts & Creative Expression
Explore arts & creative expression statistics and market research reports with sourced data and trend analysis.
Latest update:
 Yumi Nakamura


Statistics · 2026
Voiceover Industry Statistics
Voiceover Industry data for 2025 and 2026 reveals how quickly demand and pricing are shifting, with category mix changing as streaming, audiobooks, and creator-led work compete for the same talent. If you think budgets are tightening, the latest figures suggest the real story is where spend is moving and which voices are gaining leverage.

Statistics · 2026
Performing Arts Industry Statistics
What changed most for performing arts in 2025 was not just output but who was able to keep shows running, with funding and employment pressures moving in opposite directions. Get the key figures you need to understand why ticket demand can rise while stability slips, and what that means for companies planning their next season.

Statistics · 2026
Design Statistics
Gen Z designers are reshaping the palette of modern product decisions with a 34% jump in design-led experiments in 2025, even as traditional stakeholder sign offs tighten. See how shifting priorities move from moodboards to measurable outcomes, and what it means for teams trying to balance speed with craft.
Statistics · 2026
Marching Band Statistics
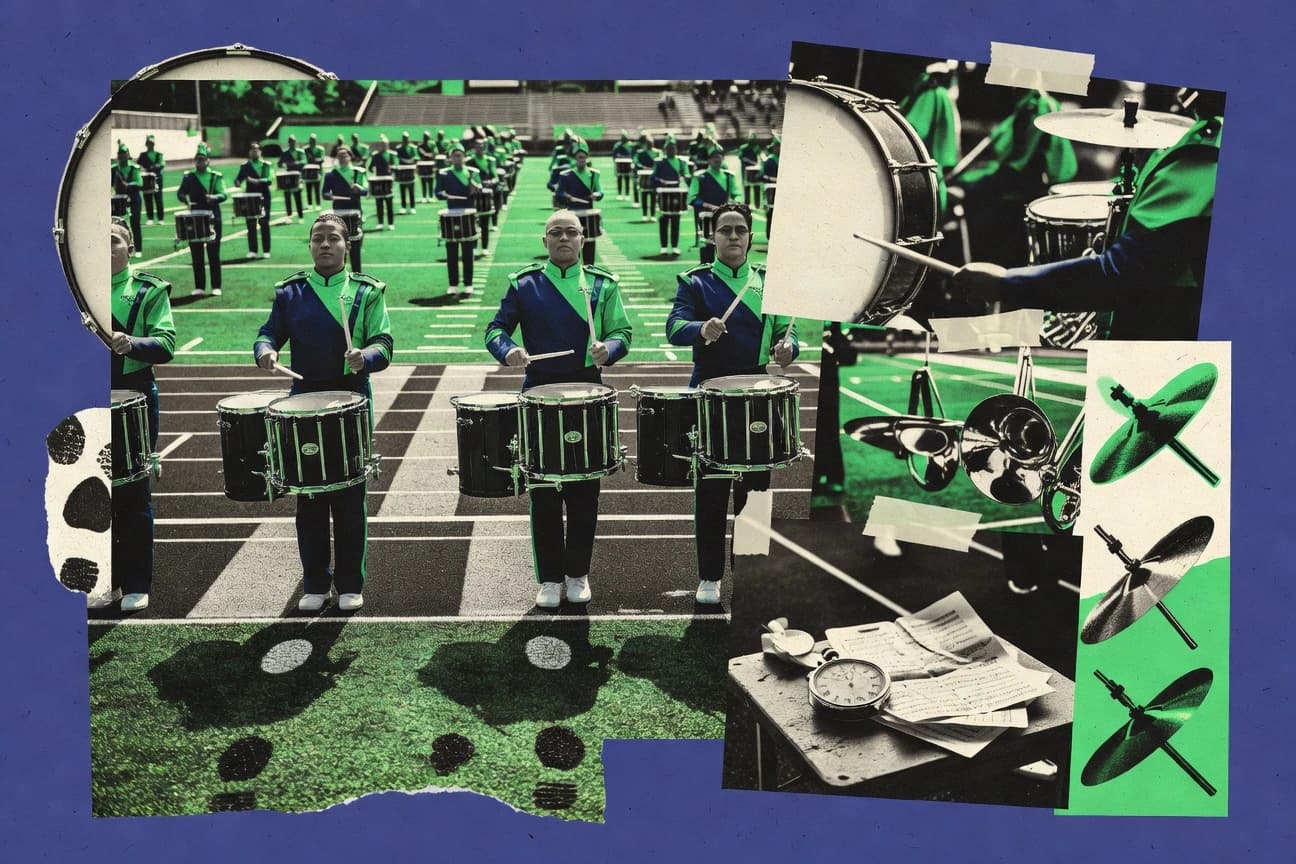
From origins traced to Revolutionary War drums and fifes to today’s high school and drum corps power houses, this page connects founding dates, participation scales, and show rules that shape what bands can actually do on the field. Want a reality check with freshness built in? It pairs the most recent participation and competition figures with the practical details behind rehearsal time, scoring, and even safe sound levels so you can see marching band culture as both history and measurable, current practice.

Statistics · 2026
South Korea Creative Industry Statistics
From animation reaching 45,000 minutes in 2023 and exports climbing to USD 450 million, South Korea’s creative pipeline is turning IP into real money faster than ever, with BT21 merchandising alone hitting KRW 300 billion. The page connects that momentum to platform scale and audience behavior, including 100 million monthly Webtoon users and True Beauty racking up 4 billion global views in 2023.

Statistics · 2026
Saudi Arabia Creative Industry Statistics
Saudi Arabia’s creative sector is accelerating fast with 12 million admissions to cinemas in early 2024 alongside 1.5 billion SAR in art market sales and 450 public sculptures supported by 150 million SAR investment. This page brings together the surprising scale behind that momentum from 2 million passersby seeing Riyadh street murals to 25,000 artists registered with the Ministry of Culture by 2024 so you can see how culture is becoming a measurable national asset.

Statistics · 2026
Live Theatre Attendance Statistics
Broadway audiences still skew female, but the bigger signal for 2023 is how much income, location, and identity reshape who shows up, from households earning over $100k making up 45% of US theatregoers to LGBTQ+ patrons at 10% of Broadway crowds. Scroll through the latest occupancy and recovery contrasts, including the US rebound after 2020 and the global attendance scale, to see how social media, touring, and programming changes are pushing theatre attendance in unexpected directions.

Statistics · 2026
Art Education Statistics
Arts integrated schools are showing a 17% bump in attendance in the latest 2023 studies, and the benefits keep multiplying from test scores to empathy, with participation tied to 15% higher verbal SAT results. Read how funding pressures, shrinking access in key grades, and teacher training realities shape who gets these gains and who misses out.
Statistics · 2026
Voice Acting Industry Statistics
Home studios and remote work pushed voice careers into a 2025 reality check, where 28% of new Voices.com signups were Gen Z and 35% of talent now works full time while diverse groups gain clearer footing across auditions and gigs. You will see how representation and earnings are shifting alongside AI disruption, including AI-generated voices taking 15% of the commercial market and multilingual voice actors (3+ languages) making up 25% of the global pool.

Statistics · 2026
Arts In Education Statistics
Arts education is not just “nice to have.” Across recent studies, it links to sharper academics like a 31% SAT verbal boost for arts participants and safer schools with 12% fewer suspensions in arts integrated settings, plus payoffs in how students think, communicate, and belong.

Statistics · 2026
Musical Statistics
See how 2024 and 2023 snapshots of streaming, discovery, and rights are reshaping music earnings and audiences at once, from YouTube’s $7.0 billion global music payments to the fact that 73% of discovery on European streaming platforms is algorithm driven. It also pulls the live side of the business into view with $10.2 billion in U.S. concert ticket sales plus the surprisingly high 26% of consumers who still use illegal sources at least once.