Market data
Agriculture & Farming
Explore agriculture & farming statistics and market research reports with sourced data and trend analysis.
Latest update:
 Leah Kessler


Statistics · 2026
Farm Equipment Sales Statistics
Farm Equipment Sales statistics are showing a sharp 2026 uptick in key buying signals, with demand moving faster than many dealers expected. Get the numbers behind what customers are actually purchasing and how the market is reshaping dealer sales right now.
Statistics · 2026
Regenerative Agriculture Statistics
Regenerative agriculture is flipping expectations fast with 2025 ready signals like insect populations up 50 to 100 percent, pollinator abundance 2 to 4 times higher, and soil carbon building up to 1.5 tons per acre per year. At the same time, regen systems cut erosion by 50 percent and boost beneficial life from mycorrhizal networks to dung beetles, showing how soil health, biodiversity, and farm resilience move together rather than competing.
Statistics · 2026
Seeds Industry Statistics
From GM seeds reaching 190 million hectares in 2023 to precision breeding and AI selection lifting purity by 15 percent, this page tracks the fastest movers shaping today’s seed performance. You also get the market power picture behind them, including Monsanto’s 35 percent global corn share in 2023 alongside a USD 62.45 billion global seeds market that is set to climb to USD 100.6 billion by 2030.
Statistics · 2026
Farm Labor Shortage Statistics
Farm labor shortages are still driving major losses right now, with USDA reporting hired farm labor wages averaging $15.23 per hour in 2023 as growers compete for workers, while 61% of fruit and vegetable farms said they could not find help in peak seasons. See how the gap plays out by crop and region, from California’s $3.1 billion in shortage related losses to fruit and vegetable price hikes and unharvested fields that add up fast.

Statistics · 2026
Fonterra Dairy Industry Statistics
Fonterra’s 2025-ready sustainability snapshot is punchy. By 2023, it cut Scope 1 and 2 emissions intensity by 25% and improved water efficiency to 2.8 litres per kgMS, while renewable energy climbed to 35% and 98% of waste was diverted from landfill. Then there is the bigger picture of value chain impact and performance, with 25 million tCO2e across its value chain and 70% water recycling at plants, alongside farm progress such as 95% of supplier farms reaching sustainable dairy status and soil health improving on 60% of audited farms.
Statistics · 2026
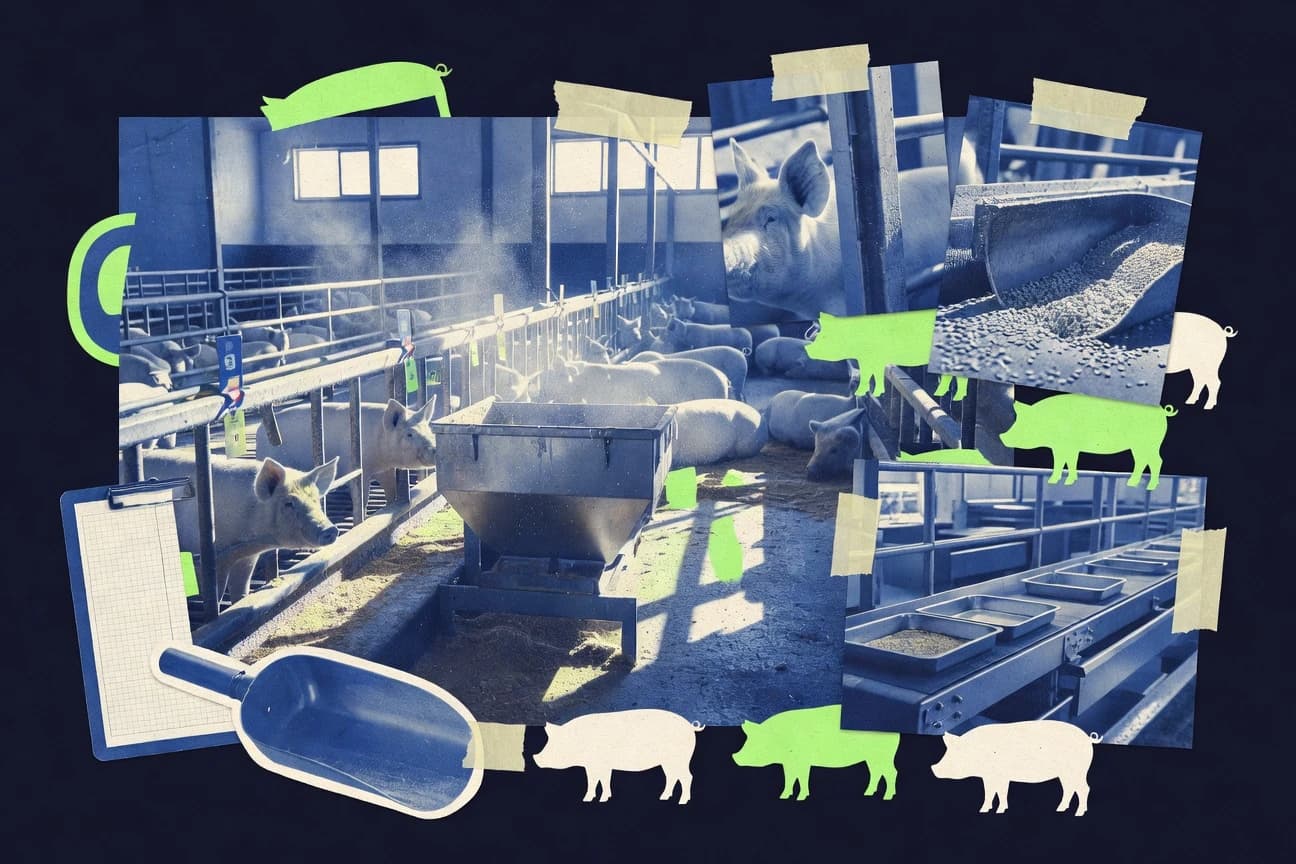
China Pork Industry Statistics
ASF outbreaks collapsed to 3 cases in 2022 from a 10,000 spike in 2019, while classical swine fever vaccination reached 99.5 percent and antibiotic use fell 40 percent since 2018. You get the full picture of China’s post ASF rebound and modernization, from 55.2 million tons of total pork consumption and a 97.5 percent self sufficiency rate to 85 percent manure utilization and energy output reaching 1.2 billion kWh at waste to energy farms.
Statistics · 2026
Pork Industry Statistics
With U.S. swine farms cutting antimicrobial use 42% between 2015 and 2020 while global pork production is still trending up 1.9% in 2023, this page ties farm practices to the pressure points traders and packers feel. Expect sharp trade contrasts and cost signals too, from Brazil’s 6.7 billion USD pig meat exports and 42.5 million pigs in inventory to the feed and import price impacts reshaping margins.

Statistics · 2026
Uk Egg Industry Statistics
As the 2026 cage free ban approaches, UK shell egg production, pricing and welfare metrics show a sector adapting fast, from free range taking 57% of retail sales by volume in 2022 to indoor non cage overtaking briefly in Q2 2022 after avian flu shocks. You will also see what that shift means for demand and money, including out of home catering driving 25% of UK demand in 2023 and free range retail prices climbing to £2.45 a dozen in December 2022.

Statistics · 2026
Chile Salmon Industry Statistics
Chile’s salmon sector powered USD 18.7 billion in economic activity and contributed 3.2% to national GDP in 2023, even as feed costs drove operational expenses up 9% per kg to USD 4.85. You also get the practical sustainability contrasts that matter, from antibiotic use down 65% to 0.018 kg per tonne and sea lice averaging 0.25 per fish, to export scale reaching 546,200 tonnes and USD 4.12 billion.
Statistics · 2026
Spain Pork Industry Statistics
Spain’s pig numbers keep tightening and pressure keeps rising at the same time with 2,308.6 thousand pigs counted in December 2020 stock reporting, while pigmeat output hit 2.5 million tonnes in the latest EU tables and the pork retail price index climbed to 136.4 in March 2024. The page connects capacity and compliance drivers with trade and feed cost shocks, including a -0.73 million tonnes pigmeat trade balance in 2023, so you can see why Spain both produces at scale and still relies on imports.

Statistics · 2026
Animal Slaughter Statistics
Global meat production rose just 1.1% year over year in 2023, yet slaughter still moves staggering volumes, with 51.4 billion poultry birds processed worldwide in 2022 and a global meat retail market worth $1.0 trillion in 2023. Get the practical picture behind that scale, from EU stunning legal safeguards and inspection loads to upstream feed and wastewater impacts that shape slaughter demand.

Statistics · 2026
Ecuador Shrimp Industry Statistics
Ecuador is still punching above its weight as the second largest global shrimp exporter, shipping 348,000 metric tons and averaging US$8.05 per kg in 2023, while costs and quality controls tighten from a feed-driven 40–60% variable cost share to 9% of shipments flagging temperature excursions. At the farm and hatchery level, viral trouble is measurable too, with 44% of hatcheries reporting viral disease issues and Taura syndrome virus testing positive in 13.6% of samples, making this page a practical read for anyone tracking where Ecuador’s competitiveness gains, and where losses slip in.
Statistics · 2026
Agricultural Statistics
Agriculture still weighs heavily on the global economy, with projections putting total agricultural output at 9.1% of world GDP in 2024, while innovation is moving fast from biopesticides reaching a projected $12.5 billion by 2025 to precision farming forecast to top $17.0 billion by 2026. This page connects the farm level evidence behind yield gains and efficiency tools with the pressure points of pests, nitrogen losses, food waste, and climate risk.
Statistics · 2026
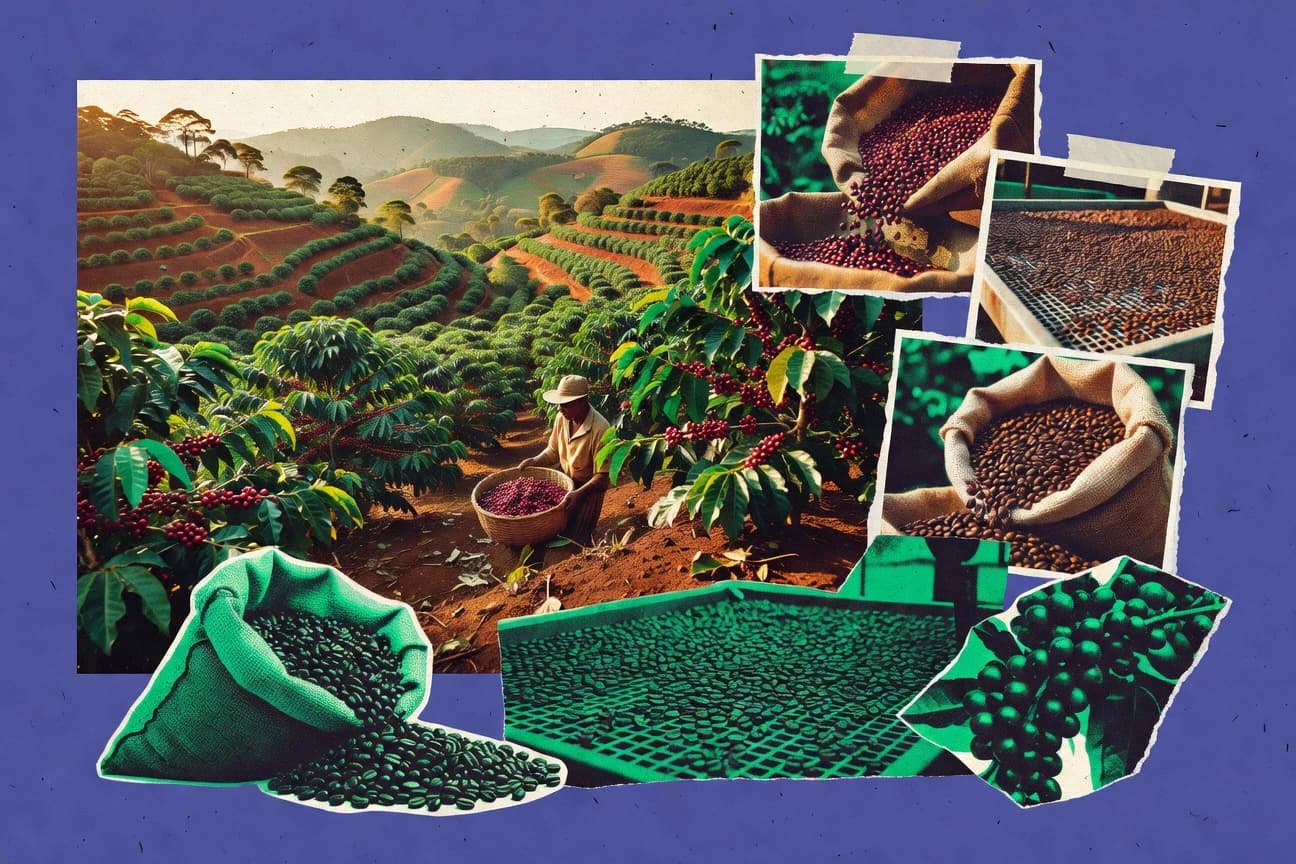
Brazil Coffee Industry Statistics
Brazil’s coffee productivity is up about 7% since 2014 as logistics and defect-reduction sorting lift specialty eligibility, even while extreme-weather hit rates in severe El Niño or La Niña years are estimated at 10–30% in affected regions. Roasted coffee exports reach about US$1.4 billion in 2023 alongside total HS 0901 exports of US$6.3 billion, revealing a sharp value split that can turn a 60 percent share of cooperative handled shipments into specialty premiums up to 3.6 times conventional lots.
Statistics · 2026
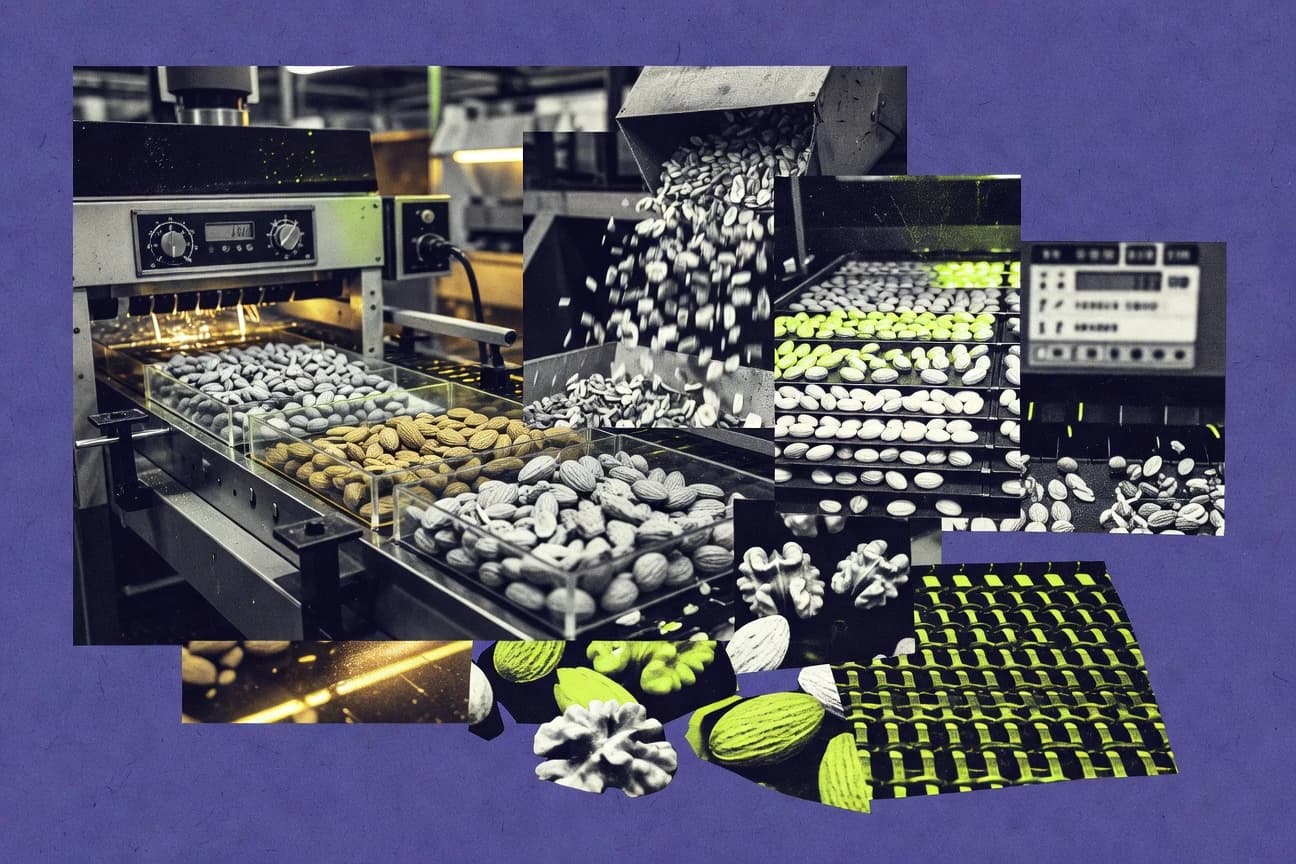
Nut Industry Statistics
Global nut consumption climbed to 2.5 kg per person in 2022, yet the page puts surprising pressure on where that demand lands, from US almonds at 1.8 billion pounds with 70 percent exported to China’s 1.2 million MT of walnuts largely staying home. Market value is just as revealing, with the global nut industry at USD 68.6 billion in 2022 and snack nuts reaching USD 25 billion, helping you see which crops are built for export, which are driven by domestic tastes, and where value is being made.
Statistics · 2026
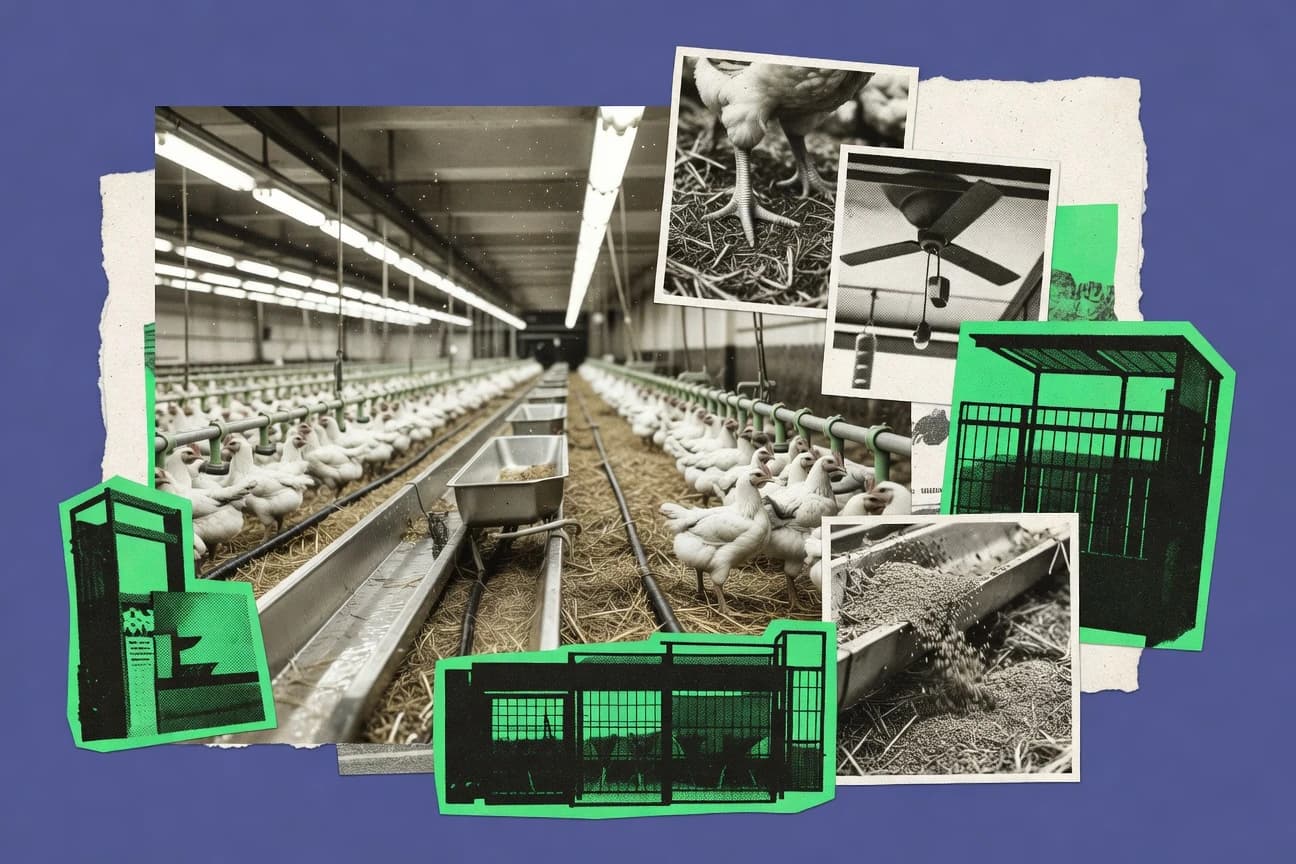
Poultry Industry Statistics
The poultry sector runs on precision and pressure, from feed that can drive 65% to 70% of broiler costs to a global poultry feed market projected to hit $88.9 billion by 2030, with protein and temperature control shaping outcomes as much as disease risk. You will also see how farm output connects to processing and exports, including the US poultry processing market at $10.4 billion in 2023 and worldwide H5 and H7 outbreaks surpassing 200 events in 2023, alongside the food-safety reality of roughly 20% non-typhoidal Salmonella prevalence in poultry meat.

Statistics · 2026
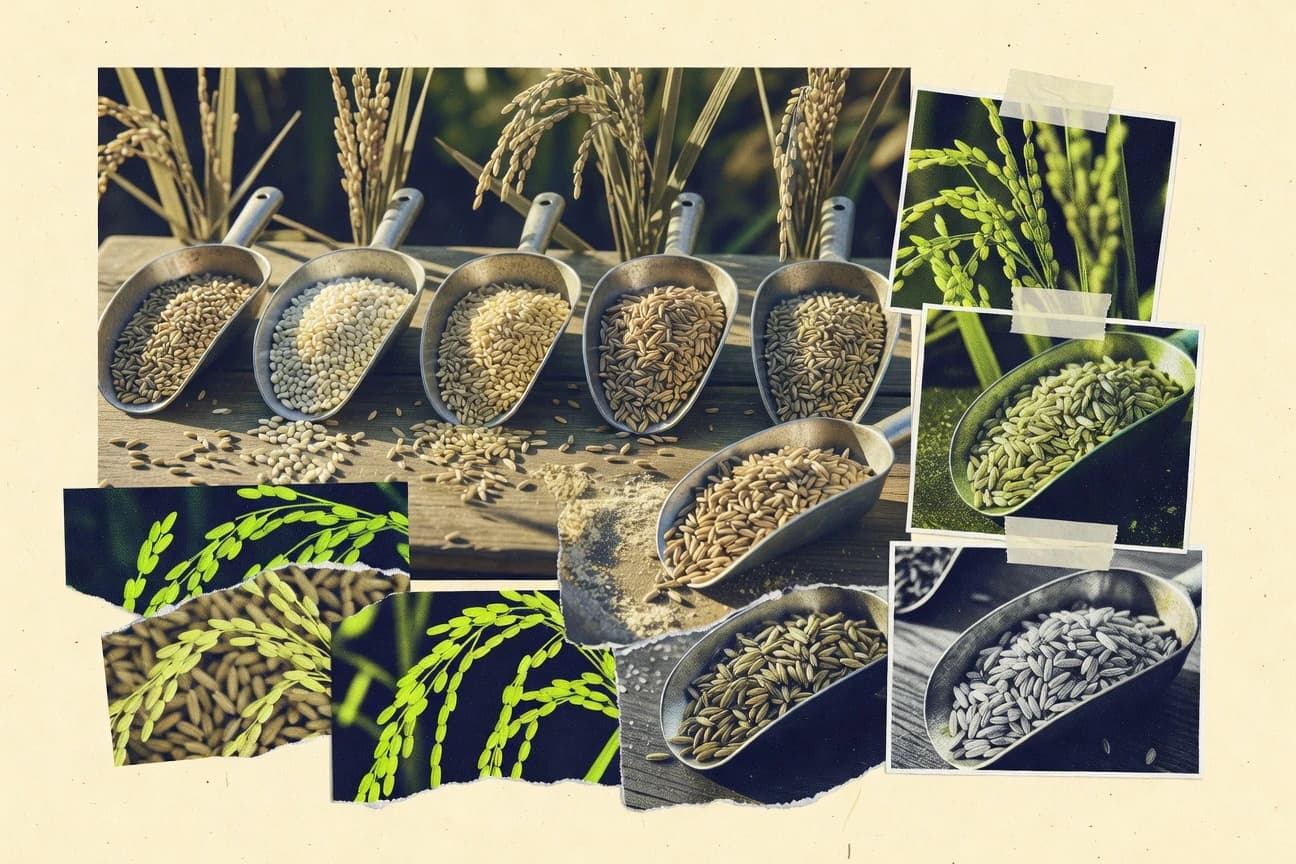
Sugarcane Industry Statistics
Harvested sugarcane land is sitting at about 101 million hectares in 2022, yet sugar and ethanol markets keep tightening and reshaping demand, with global sugar valued near US$ 88.0 billion in 2023 and bioethanol up to about US$ 82.0 billion the same year. Follow how policy-driven shifts like near universal controlled harvesting in Brazil and yield sensitivities such as sucrose content and irrigation stress translate into export volumes, fermentation output, and even price volatility on the weekly sugar curve.
Statistics · 2026
Rice Diversity Statistics
Rice’s newest diversity statistics bring admissions, outcomes, and campus composition into one place, from international representation that peaks at 28.1% among graduate students to undergraduate acceptance sitting at just 8.7% in Fall 2023. You will also see how persistence and completion hold steady across groups, including a 98.1% Hispanic first to second year retention rate and a 92.3% six year graduation rate for Black undergraduates.
Statistics · 2026
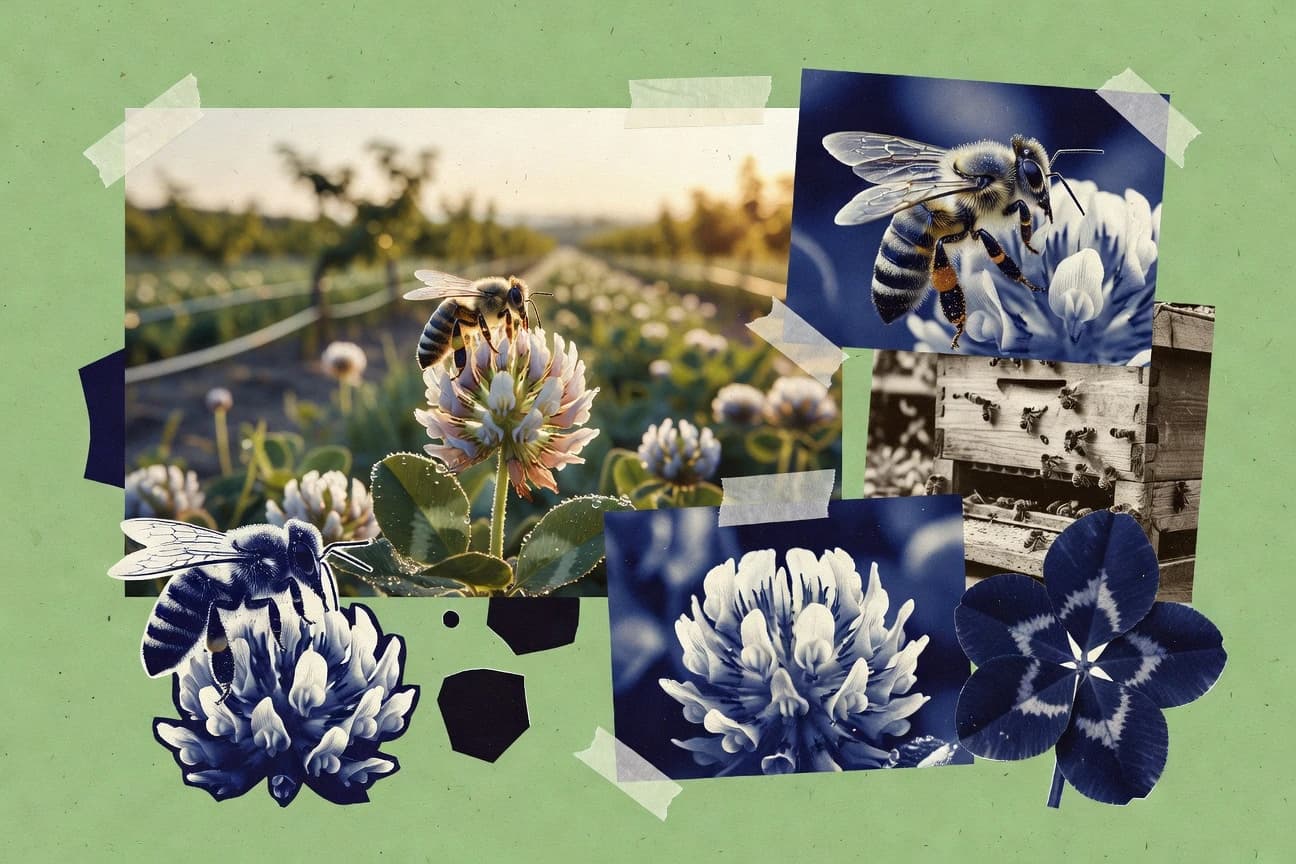
Bee Statistics
Honey is big business and it is also tightly bound to bee stress and pest control, with New Zealand producing 1.6 million kilograms in 2023 and the Varroa destructor mite linked to 76% of colony health declines in European apiaries. Temperate crop pollination relies heavily on managed honey bees, yet heat stress risk rises as global temperatures climb by 1.5°C and only 4.8% of EU beekeepers adopted mite monitoring devices in 2021, making the gap between what is known and what is practiced feel urgent.

Statistics · 2026
Malawi Agriculture Statistics
Malawi’s agriculture is mostly smallholder driven but surprisingly resource-constrained, with arable land under cultivation shaped by low credit access and rising input demands. See how fertilizer use climbed to 22 kg per hectare by 2022, yet only 30% of maize area uses improved seed and many households still face shocks, from 20% maize post-harvest losses to floods and soil degradation.