GITNUX MARKETDATA
Browse Our Category
Travel Tourism
Latest update:


Brazil Tourism Industry Statistics
Brazil tourism is turning into a precise numbers game, with 5.9 million international arrivals in 2023 up 12.6% from 2022 and hotel performance that ranges from nationwide 65% occupancy to 92% at Iguaçu Falls on the Brazilian side. Get the full snapshot of where demand is concentrating, how people are booking and traveling, and the economic and sustainability impact behind Brazil’s busiest destinations.

European Travel Industry Statistics
Europe’s lodging and travel economy stayed firmly in demand, with hotel occupancy averaging 72% and ADR rising to €140 in 2023 while RevPAR hit €101, and major cities swinging sharply from Paris at 85% occupancy and €350 ADR to Rome at 75% occupancy. For 2026 readers, the real value is the push pull between growth and pressure, from 7 million vacation rental listings to 747 million international arrivals and a tourism sector now worth €2.1 trillion to Europe’s GDP.

Japan Travel Industry Statistics
Japan’s tourism engine is roaring back with 2023 inbound spending of 5.3 trillion yen and occupancy still led by foreign visitors, while attractions run from Tokyo Disneyland’s 17.4 million 2019 entries to 78.6 percent of pre-pandemic international arrivals by 2023. This page pairs visitor volumes and travel spend with on the ground capacity, from 9,170 hotels and 896,000 rooms to Kyoto overtourism around Gion’s 10 million annual visitors, plus the newer shifts like 70 percent of prefectures in sustainable programs and digital nomad visas aiming for 100,000 applicants.

Luxury Vacation Rental Industry Statistics
Luxury travelers are choosing rentals over hotels by 68 percent because privacy wins, while repeat guests drive loyalty through personalized service that keeps bookings coming back. This 2025 to 2026 ready snapshot of the luxury vacation rental market lays out who books, how they book on mobile apps, and what they will not compromise on, from pools and wellness to pet friendly stays and smart home tech, plus the biggest growth signals shaping revenue, pricing, and inventory.

Bahamas Tourism Statistics
With tourism revenue projected to reach $5.1 billion in 2024 and room rates climbing to $320 in luxury resorts, the Bahamas balance high season demand with a steady buildout of 2,500 new hotel rooms and growing eco options across the outer islands. From Nassau’s 78% occupancy and 6.2 million room nights sold to 7.5 million cruise passengers and 1.61 million stopover visitors, the page connects how accommodations, experiences, and visitor spending drive both jobs and GDP.

Turkey Tourism Statistics
Turkey’s tourism snapshot comes with real momentum, topping $54.3 billion in international receipts in 2023 alongside a 77% year over year jump. From Istanbul at 20.2 million arrivals and Antalya’s 16.5 million beach draw to UNESCO and underwater hits like Hierapolis and Kaş, the page maps how different destinations and spending power reshape Turkey’s economy.
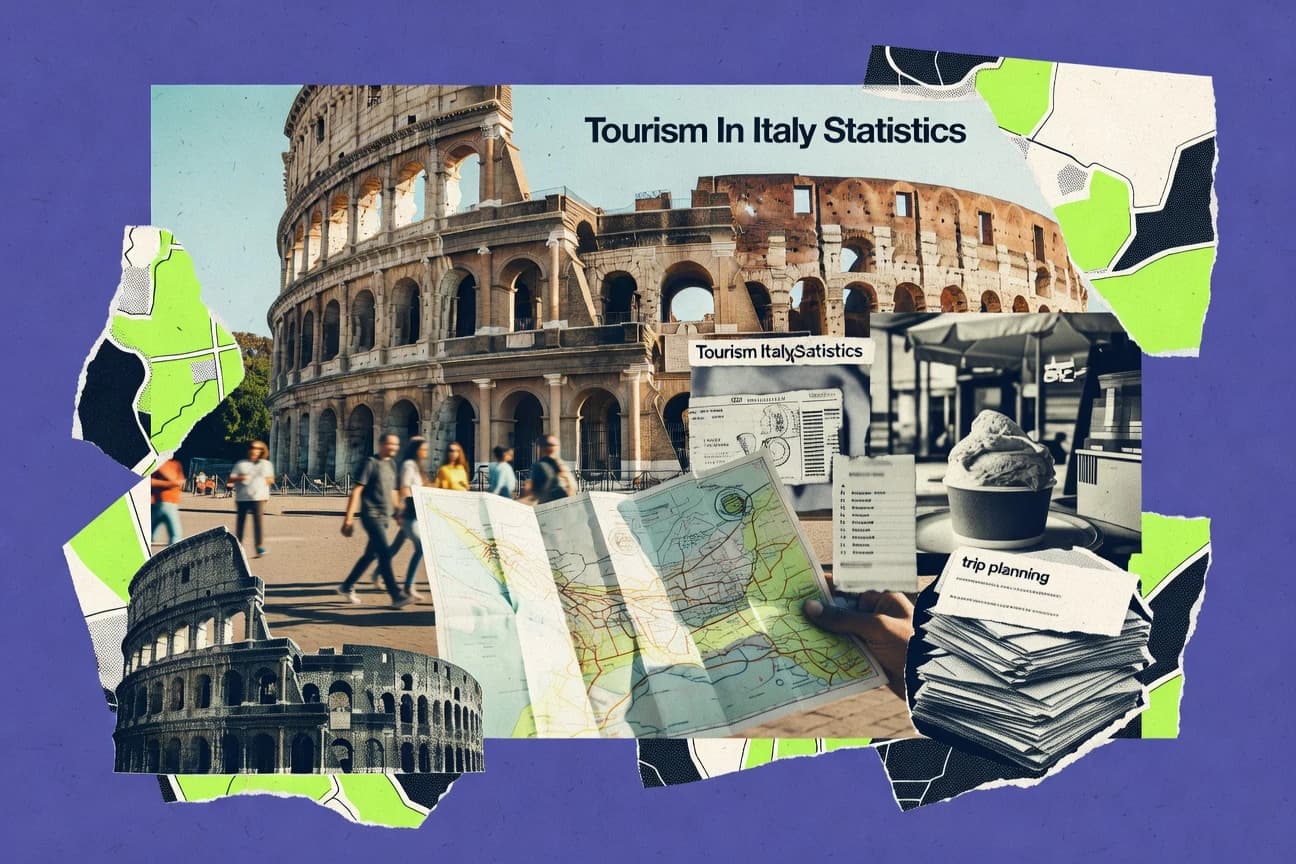
Tourism In Italy Statistics
Domestic tourism in Italy still sits at the core of demand, with €28.1 billion spent in 2023 and 208 million overnight stays, while international arrivals rose 15% to 57.25 million. The contrast is striking since 62% of domestic trips run by car, yet 48% of international arrivals arrive by air, shaping everything from which regions win to how travel budgets and jobs are generated.

Traveling Statistics
Flight patterns swing from 90% on time in Asia-Pacific to 17 minutes of average worldwide delays, while 4.5 billion air passengers keep aviation and tourism moving fast. You will see how travel tech is growing to $9.4 billion in 2023, how 67% of travelers want carbon neutral options by 2025, and how everything from loyalty programs to cruise recovery reshapes where people go next.

Italy Tourism Statistics
Tourism in Italy powered a €243 billion contribution to GDP in 2023, with 4.2 million jobs and a €50 billion lift from international spend, while tourism exports of spending jumped 20% and the multiplier effect turns every €1 into €2.5 of GDP. From city tax reaching €600 million to overtourism costs of €2 billion, the page connects where visitors spend to where pressure builds and how sustainable and regional gains are being measured across the country.

Online Travel Booking Statistics
Weekend searches drive 62% of online travel demand, yet 25% more trips are booked last minute, and 75% of travelers say they only need free cancellation to feel safe. From mobile evenings and app-first booking to personalized recommendations affecting 68% of stays, this page maps the momentum behind what people book, where, and why, plus the market context with global online travel hitting $612 billion and bookings reaching 75% of all travel sales worldwide.

Niagara Falls Statistics
Niagara Falls turns water and infrastructure into scale, from the Robert Moses plant’s 2,525 MW output to the massive Lewiston system lifting flows 300 feet through a 7.5 mile tunnel. Then see how the tourism figures keep shifting against the engineered limits, with annual visitor peaks of 14 million in 2006 and more than 2.5 million Maid of the Mist passengers each year, all while diversion tunnels handle 90% of flow during quieter hours.

Birth Tourism Statistics
A few hours in the right country can turn into hundreds of thousands in public costs. This page pulls together 2019 to 2023 reporting and enforcement snapshots, including 2023 estimates that anchor babies can drive a $750,000 lifetime net drain on US taxpayers, while 72% of US bound birth tourists are affluent and spend $15,000 to $80,000 per trip.

Online Hotel Booking Statistics
Booking lead times in 2023 tightened to 28 days globally even as 31% of reservations turned last minute under 7 days, with evenings between 6 and 10 PM driving 51% of online volume. This page connects what guests actually do on popular platforms and filters, from free cancellation and sustainable options to weekend dominance and mobile flash sales, so you can spot the shifts that will shape online hotel booking through 2030.

Sustainable Tourism Statistics
See how sustainable tourism is reshaping economies and conservation, from 2025 projections of 60% biodegradable packaging adoption in Asia Pacific to 70% of global hotels planning AI energy optimization by 2030. You will also find the surprising tradeoffs behind the gains, including Thailand’s 8.5% GDP share and 5 million-plus jobs alongside results like gene edited corals with 80% survival and zero single use plastic drives that cut marine debris by 50%.

Maldives Tourism Statistics
With 1,878,964 arrivals and a 12.3% jump, plus 172 operational resorts and 41,364 beds, the Maldives tourism stats page puts the 2025 momentum in context while revealing what guests actually experience, from December peak occupancy at 88% to resort ADR at $650 and RevPAR at $470. It also tracks how demand meets sustainability and capacity, including private islands at 92% of resorts, coral propagation across 85% of properties, and tourism’s $5.25 billion revenue pull.

Grand Canyon Statistics
Grand Canyon life is built on extremes, from 355 bird species and 89 mammals to 21 amphibians and 300 butterfly species, with the California Condor reaching 80 plus by 2023 and the Havasu Wolverine rediscovered in 2023. The park is just as dramatic in stone and scale, exposing 1.8 billion years of Earth’s history while drawing 4.7 million visitors in 2022 and running deep into habitats most people never reach, where endemic springs host 34 aquatic invertebrates.

Albania Tourism Statistics
From 250 Riviera beaches with full lifeguard coverage to Blue Eye drawing 420,000 visitors, Albania’s coasts and nature are pulling in crowds at a pace that reshapes the usual beach season rhythm. Step through UNESCO and adventure contrasts like Berat’s 280,000 tourists alongside 65,000 Valbona to Theth hikers, plus 6.8 million foreign arrivals overall, and you will see where demand is surging and what is changing across 2023’s tourism economy.

Air Travel Statistics
Last year, global aviation generated $996 billion in revenue and carried 4.6 billion passengers, yet it also emitted 1.03 billion tonnes of CO2 as capacity jumped 24% to 10.2 trillion ASK. You will see how profits differed by region, where costs like fuel at 28% of operating expenses hit hardest, and which safety and sustainability indicators moved the most.

Ota Travel Industry Statistics
From 75% projected global OTA AI adoption by 2025 and mobile bookings rising to 45% of OTA sales in 2023, this page maps who is winning, who is disrupting, and how users really behave. Expect clear battles like Booking Holdings’ 28% global market share against Airbnb’s 15% share of hotel like bookings, plus regional power moves from Trip.com’s 55% China domestic lead to Booking.com’s 60% Europe hotel OTA edge.

Female Travel Statistics
Women make up 38% of global travelers, and solo female participation has jumped to 25% from 15% in 2010, with millennials and mothers shaping very different travel budgets, safety habits, and trip lengths. This page connects the dots between who is traveling and how they move, from $1.2 trillion in global solo female spending and 84% feeling safe abroad to the sharp shifts in preferences for luxury, wellness, adventure, and inclusive destinations.