GITNUX MARKETDATA
Browse Our Category
Toys Games Collectibles
Latest update:


Board Game Industry Statistics
Board gaming is no longer a niche pastime, with board game participation rising among Gen Z and a wide gender and education spread that defies old assumptions. From 2025 sized market momentum to audience behavior like suburban concentration, cooperative versus strategy preferences, and online communities driving new players, this page stitches the full industry picture together with figures you can actually use.

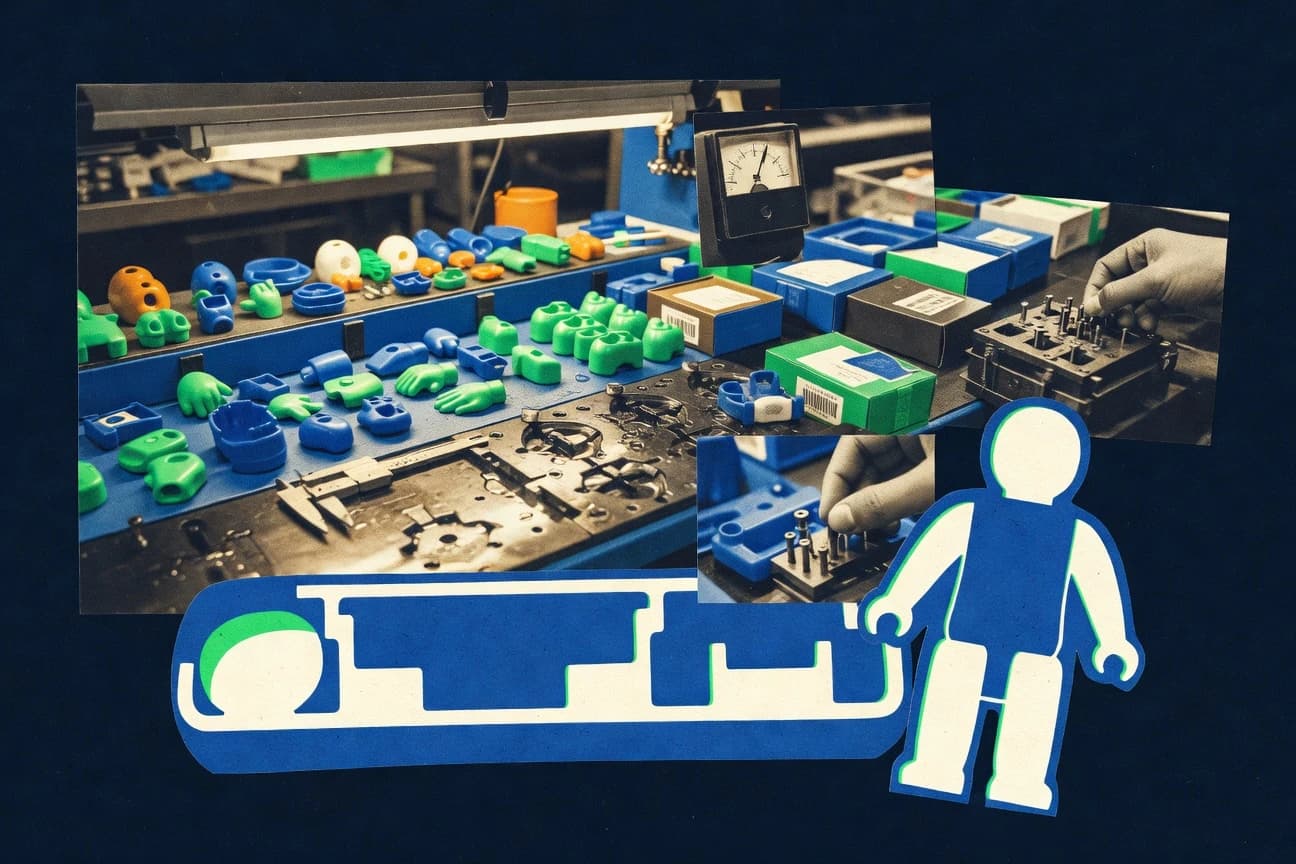
Collectibles Toy Industry Statistics
US collectible toy demand is projected to reach $6.2 billion by 2028, while the global collectibles toy market is growing at an 8.5% CAGR from 2018 to 2023, and the audience split is anything but uniform with 35% of buyers aged 18 to 34 and 51% of European shoppers buying online exclusively. This page connects those growth lines to the people behind them, from Millennial Funko Pop collectors and Gen Z enamel pin fans to puzzle type fandoms like Pokémon TCG and Star Wars Black Series, so you can spot where the next surge is most likely to hit.

Boardgame Industry Statistics
Boardgame Industry data in 2023 reveals a market powered by younger energy and family play, with U.S. adults 18 to 34 making up 42% of board game buyers while 72% of families with kids own board games. Follow the contrasts through global shifts and best sellers, from Millennials driving 38% of purchases worldwide to cooperative games holding 25% of 2023 share and Catan topping 40 million lifetime copies.

Brazil Toy Industry Statistics
Projected digital upgrades are reshaping play fast, with 40% of Brazil toy companies expected to be using AR previews by 2025, while 95% of domestic toys already carry INMETRO certification under NP 15.003 phthalate safety rules. Gender-neutral lines are climbing to 15% market share by 2023 and e-commerce integration is reshaping sales channels, making this page a quick way to see how Brazil is balancing innovation, regulation, and sustainability at once.

Trading Card Game Industry Statistics
The global TCG market is forecast to grow at a 13.8% CAGR through 2030, reaching $28.5 billion, while today’s biggest shifts are already visible in how people buy, trade, and watch games. Digital tools and transparency are accelerating secondary markets and valuation efficiency, and even esports and cross media are reshaping revenue, with Twitch daily viewership hitting 50,000 and licensing like Star Wars Unlimited growing 55% in its debut year.
China Toy Industry Statistics
Even with toys being produced at dizzying scale, China’s industry is now quantified by faster digital sales and sharper IP momentum, such as toy e commerce still rising 15.4% YoY in 2023 and Pop Mart’s blind boxes hitting 4.5 billion RMB revenue. From Mattel Asia sourcing $2.5B from China manufacturing to the $58.2 billion toy export peak in 2022, this page connects factory output, licensing power, and cross border channels into one clear picture of where growth is coming from and what it is costing.

Baseball Card Statistics
PSA has graded more than 1.2 million 1952 Topps cards yet only 1,805 reach PSA 9 or better, and Mickey Mantle’s PSA 9 rookie survives at just 68 from over 18,000 graded. Track how modern stars stack up too, with PSA 10 pops like Ken Griffey Jr at 3,248 out of 45,000+ on 1989 Upper Deck and Mike Trout’s 2011 Topps Update rookie topping 4,200+, alongside scarcity legends such as T206 Honus Wagner with just 50 known copies and 12 graded by PSA.

Sports Cards Industry Statistics
Collectors are younger than ever, with 38% aged 18 to 34 and the average age falling to 37, while buying has also widened, since female participation rose to 28% in 2023 and Gen Z now accounts for 22% of new entrants. Get the details behind how graded card spending averages $800 per submission, online marketplaces capture 68% of secondary sales, and basketball remains the top preference at 71%.
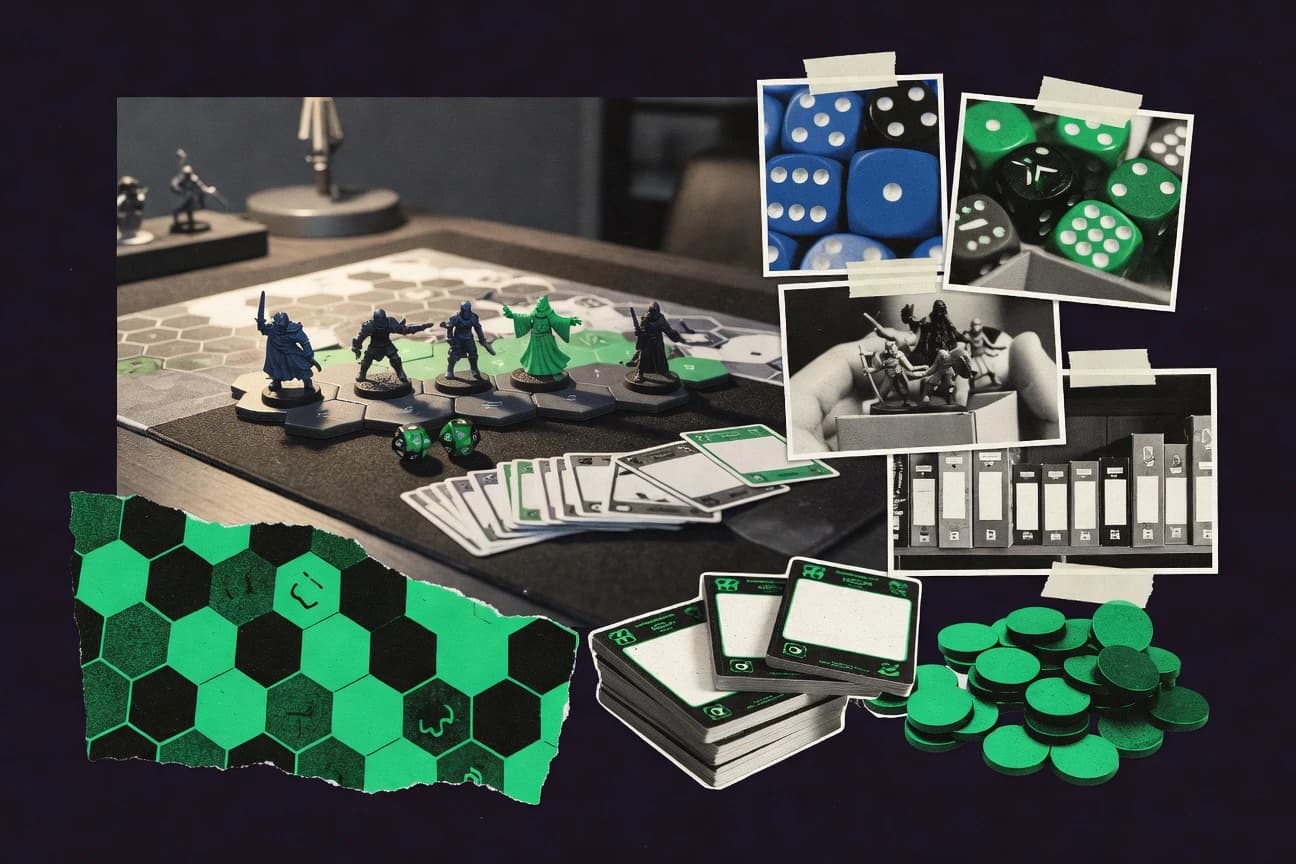
Tabletop Gaming Industry Statistics
Half of U.S. adults have played a board game within the past year, while households with children under 18 boost participation by 70 percent and women aged 18 to 34 are the fastest growing segment. See who is driving the hobby now, from 41 million Americans playing RPGs to urban gamers making up 62 percent and online retention rising since the pandemic, alongside the revenue and event signals shaping 2025 onward.

Plush Toy Industry Statistics
Plush Toy Industry buyers are shifting fast, with global online sales hitting $3.4 billion in 2023 and e-commerce now taking 45% of all plush sales, while licensed characters still command 35% of the market value. From China producing 2.5 billion plush toys in 2023 to U.S. domestic production covering just 5% of consumption, this page connects who buys, why they buy, and how manufacturing concentrates so you can spot where demand and margins will land next.
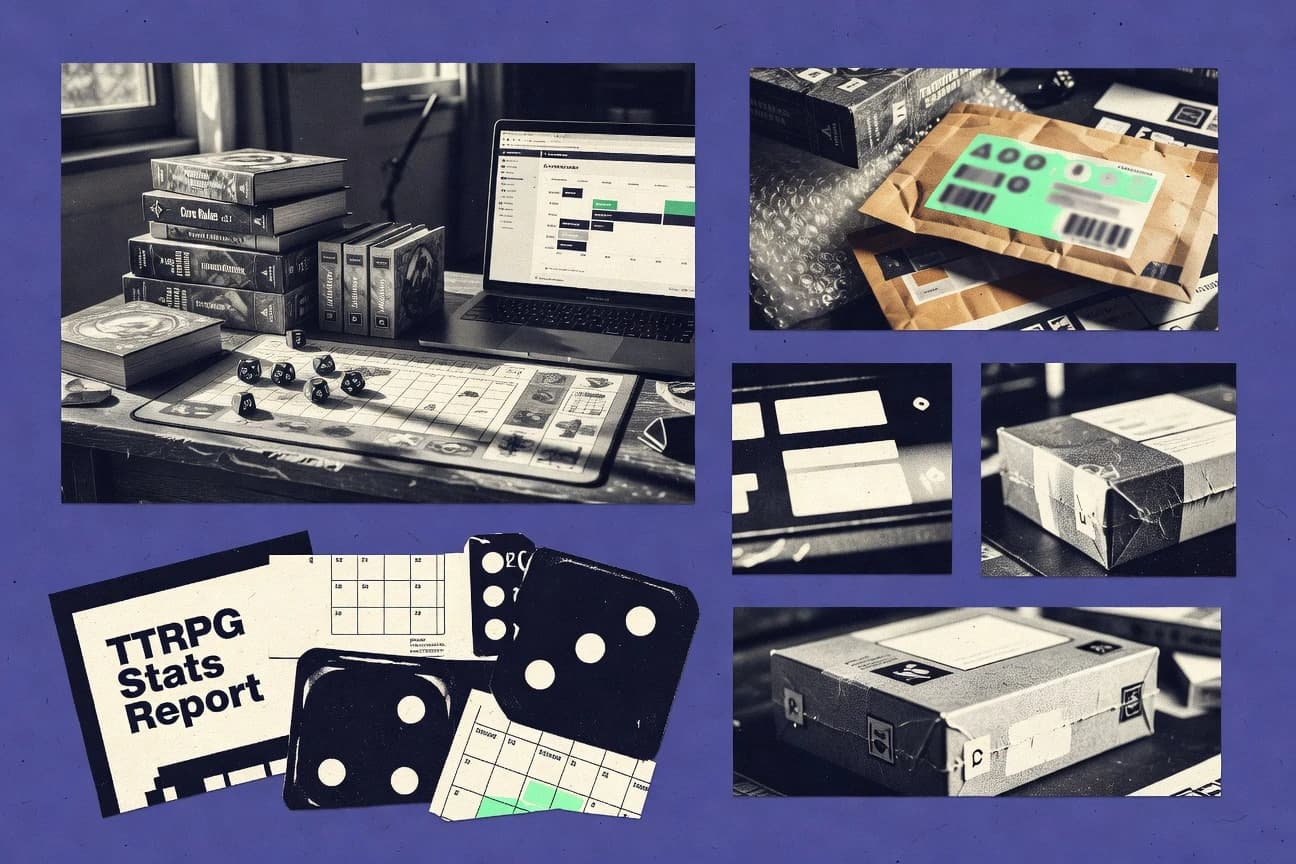
Ttrpg Industry Statistics
A market that size grows fast, but the real shock is how much is now happening off the table. With North American TTRPG revenue up to $295 million after a 52% jump from 2019 to 2021 and global VTT usage surging 300% since 2020, this page tracks where the $12.6 billion industry is headed next and who is driving the shift.

Sports Collectibles Industry Statistics
With online sports collectibles hitting $18.5 billion globally in 2023 and repeat buyers driving 77% of annual sales volume, this page shows why the market keeps accelerating even as preferences shift fast. You will see how female participation climbed to 28% globally, Gen Z now leans on Instagram and TikTok for discovery, and blockchain authentication helped graded cards rise 28% in 2023 alongside headline auction results like Honus Wagner’s $7.25 million sale.
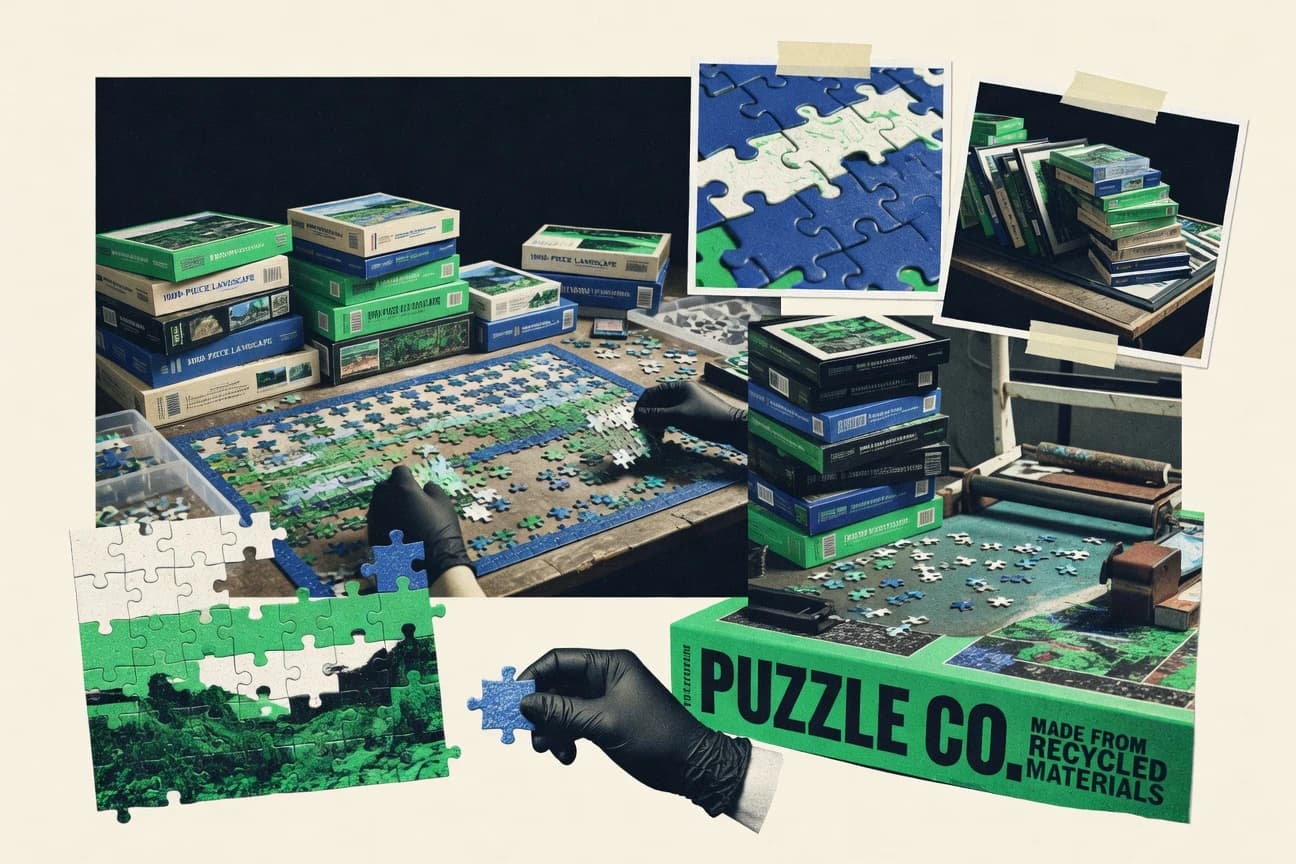
Puzzle Industry Statistics
Puzzle buying is still a 35 to 54 stronghold at 45% of US buyers, yet the fastest shift is younger participation with US Gen Z up to 22% in 2023 from 12% in 2020, while global tastes skew sharply toward women with 62% of buyers worldwide. This Puzzle Industry statistics page connects those demographic pulls to market momentum like the global industry projected to reach $28 billion by 2032 and shows where formats are winning, from 3D and premium adult puzzles to eco friendly and subscription boxes.

Sports Trading Card Industry Statistics
With 60% of collectors still under the $500 yearly spend while high income shoppers ($150k+) average $5,200, the hobby’s income gap is sharper than the headlines suggest. Updated with 2023 market momentum like 45% YoY online sales growth and 20% of graders using AI authentication, this page maps who is buying, what they chase, and why the card market is getting more diverse, more digital, and more competitive fast.