GITNUX MARKETDATA
Browse Our Category
Sustainability In Industry
Latest update:


Sustainability In The Printing Industry Statistics
With 35% emissions cuts tied to FSC chain-of-custody printers and Scope 1 and 2 down 28% per ton since 2015 to 2022, this page shows how sustainability measures translate into measurable air and carbon wins. It also pairs the scale of adoption, like 25% growth in G7 certified printers since 2020, with practical proof points such as 90% of Sustainable Green Printing Partnership members reaching zero waste and LED curing eliminating ozone in 55% of digital presses.

Sustainability In The 3D Printing Industry Statistics
See how 3D printing is cutting emissions and waste with startling material loops, from titanium at 2.0 kg CO2e per kg and recycled PETG at 1.2 kg CO2e per kg to powder reuse reaching 95% in aerospace fuel nozzles that can save 5,000 tons of CO2 per model. The page also tracks the energy reality behind the hype, highlighting 2030 projections of 45% lower per part emissions alongside 3D printing waste potentially dropping toward 2% through better optimization and recycling.

Sustainability In The Medical Industry Statistics
Waste and energy hotspots are costing healthcare in ways that are easy to miss, from hospitals generating millions of tons of medical waste and using 300 gallons of water per bed per day in the US to HVAC driving 54% of energy use. At the same time, the page pairs those pressures with hard fixes like LED retrofits that cut lighting energy by 50 to 70% and heat pump and audit wins that push energy intensity down, so you can see exactly where sustainability delivers measurable relief.
Sustainability In The Pharmaceutical Industry Statistics
At a glance, the Sustainability In The Pharmaceutical Industry statistics page weighs record progress against the biggest blind spot in climate action, with pharma supply chain Scope 3 emissions making up 90% of total and APIs driving 45% of pharma GHG. It also captures 2022 performance that is already reshaping footprints, including Pfizer’s 0.12 tCO2e per kg API and AstraZeneca’s 95% Scope 3 emissions from purchased goods, alongside operating wins in energy, waste diversion, and water intensity.

Sustainability In The Shoe Industry Statistics
Footwear is responsible for 1.4% of global manufacturing CO2 emissions, with a single pair of leather shoes generating about 14.6 kg CO2e, even as some brands cut impact and push circularity. Scroll for the contrasts that matter in 2025, from air freight adding 2.5 kg CO2e per pair to Scope 3 emissions making up 95% of totals for brands like Timberland.
Sustainability In The Engineering Industry Statistics
See how engineering teams are turning sustainability into measurable performance, from 2023 pilots where predictive analytics cut building energy by 40% to 2023 efficiency gains that push new aircraft designs 15% ahead with lightweight composites. Then watch the emissions side sharpen too, with 2022 heavy industry Scope 1 and 2 dropping 25% while renewable capacity accelerates to 3,372 GW by the end of 2022, exposing how fast technology adoption can swing both energy use and carbon outcomes.

Sustainability In The Accounting Industry Statistics
Accounting firms are cutting their own emissions while also stepping up the harder parts of sustainability work, from a 28% Scope 1 drop over 2019 to 2023 and Scope 2 purchased-energy emissions down 51% from 2020 to 2023 to remote auditing saving 1.2 million tons of CO2e across the sector in 2023. The page puts that progress under pressure with measurable gaps and knock-on effects, including only 22% full compliance with TCFD recommendations among mid-tier firms and rapidly expanding ESG verification, risk modeling, and nature and human rights disclosures.
Sustainability In The Multifamily Industry Statistics
See how multifamily operators cut carbon faster than expected, with Scope 1 emissions down 25% since 2015 and electrified cooking slashing emissions by 50%, while renewable deals scale to 35% of properties pulling 20% or more from PPAs. Then compare the quieter wins that add up just as sharply, from LED lighting driving 45% to 60% lighting energy savings and ENERGY STAR buildings using 28% less source energy to water and waste measures that turn everyday resident choices into measurable reductions.

Sustainability In The Automotive Aftermarket Industry Statistics
From EV battery remanufacturing to solar powered service sites, the automotive aftermarket is turning sustainability into measurable cuts, with 2023 pilots showing LED retrofits cutting emissions by 30% and aftermarket EV charger installs offsetting 5 million tons of CO2 each year. Go beyond the shop floor too, where recycling and recycled materials are reshaping supply chains, including a global tire recycling result of 92 million tires recycled in 2023.

Sustainability In The Diamond Industry Statistics
From WHO-limit dust spikes up to 400% in South Africa to acid mine drainage acidifying 300 km of Namibian waterways, this page tracks how diamond extraction and processing are reshaping ecosystems and health. It also pairs the scale of pollution, such as 5.5 million tonnes of CO2e from mining operations, with hard accountability gaps including only 40% land rehabilitation success worldwide since 2000 and biodiversity offsets missing from 90% of closures, so you can see where sustainability claims meet measurable outcomes.

Sustainability In The Consumer Products Industry Statistics
From 2023 packaging and energy shifts to supply chain cuts, this page tracks how major brands are tightening their sustainability math fast, including Coca Cola reaching 25% renewable power and preventing 1.2 million tons of CO2 in 2023. You will see the harder tradeoffs too, like Nestlé cutting absolute GHG emissions 18% since 2018 and Reckitt slashing Scope 1 and 2 by 45% since 2019, alongside bold packaging and water wins that change the baseline, not just the headlines.

Sustainability In The Electronics Industry Statistics
Only 22.3% of the world’s 62 million metric tons of e-waste ends up formally collected and recycled, even as global generation is forecast to jump to 82 million tonnes a year by 2030. This page connects the scale, the regional gaps, and the climate and material stakes so you can see exactly why better collection, reuse, and recycling have become the electronics industry’s most urgent lever.
Circular Economy Industry Statistics
Circular economy practices are already cutting emissions at scale, from aluminium recycling saving 95% of energy to global steel recycling cutting 1.5 Gt CO2 every year. You will also see how circular models in plastics, construction, textiles, and batteries reshape both climate outcomes and markets, with the circular economy valued at about €4.5 trillion in 2019 and poised for major value growth.

Sustainability In The Cosmetics Industry Statistics
Sustainability is no longer a “nice to have” factor as 88% of consumers check labels for natural ingredients and social media steers 70% of green beauty purchases, while brand loyalty drops 50% when practices are not sustainable. The page connects demand to measurable impact with Scope 3 supply chain emissions driving 85% of the industry total and e-commerce sustainable cosmetics growing 40%, plus packaging and water pressures that decide whether claims hold up beyond the shelf.
Uk Waste Industry Statistics
See how the UK waste industry is juggling scale and policy pressure, from waste collection and recycling to energy from waste, with turnover reaching £15.6 billion in 2021 alongside 117,000 people employed in waste management. You will also find the sharp trade-offs between landfill, treatment capacity and recycling performance, including recycling sector GVA of £6.5 billion in 2020 and UK household recycling at 44.9% in 2021 to 2022.
Sustainability In The Medical Device Industry Statistics
Sterilization and cleanrooms alone devour 40% of medtech energy, while Scope 3 emissions dominate at 85 MtCO2e, much of it traced to materials and logistics rather than factory floors. This 2026-ready stats page puts the shock in context, from 2.1% of global industrial energy use and 150 TWh per year down to how little med device waste gets recycled and where energy savings could realistically start.

Sustainability In The Fintech Industry Statistics
Sustainability in Fintech has flipped from aspiration to infrastructure, with 85% of firms adopting ESG integration practices by end 2023 and green onboarding cutting paper use for 65% of fintech startups. Yet the push is not one size fits all, since some teams are moving from 40% biodiversity impact tracking to 58% validated net zero targets, while user demand helps drive a 25% adoption growth for sustainable brands.

Christmas Waste Statistics
UK households bin about 4.2 million tonnes of food waste at Christmas, equivalent to 74 million roast dinners, even as the season drives holiday packaging and unwanted gifts into ever bigger recycling and landfill pressure. From US greenhouse gas spikes and turkey leftovers to 3 billion square metres of wrapping paper in the UK and millions of real and artificial trees discarded, this page tracks the surprising scale of what gets thrown away, not just eaten.
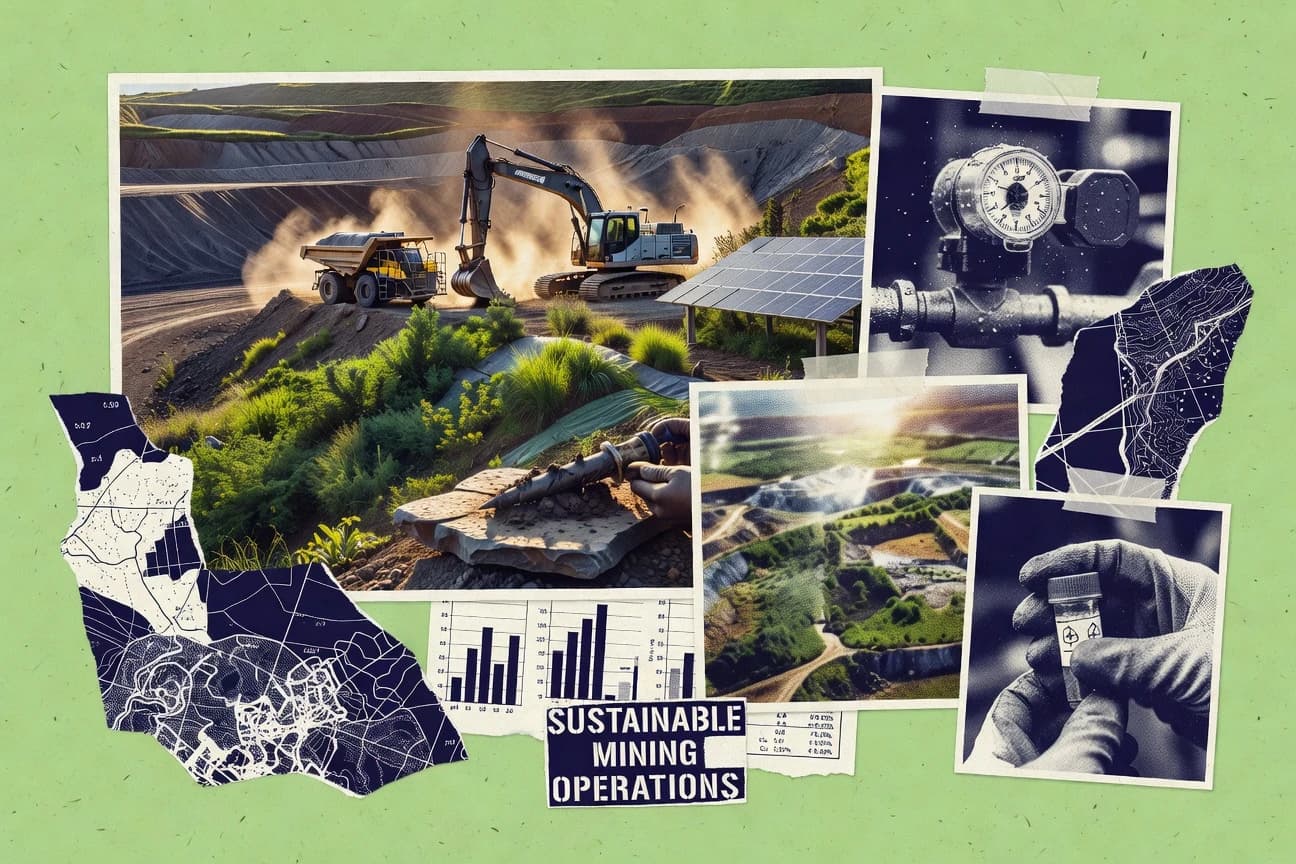
Sustainability In The Mining Industry Statistics
See how mines are cutting energy and emissions with practical upgrades like trolley assist, regenerative braking, and autonomous fleets, including a 20% global energy intensity drop from 2010 to 2020 and site wins such as a 25% per tonne reduction at Newmont’s Carlin mills. Then watch the sustainability case extend beyond carbon to water recycling, habitat rehabilitation, and community investment where Scope 3 value chain emissions still dominate at around 90%, setting the stakes for what progress must solve next.

Sustainability In The Advertising Industry Statistics
With 62% of people distrusting green claims and greenwashing perceptions up 40% since 2020, this page maps the gap between what ads promise and what audiences believe. Then it balances the skepticism with momentum, from 65% boycotts after seeing unsustainable ads to 42% of agencies now measuring Scope 3 emissions and 76% sharing sustainable ad content, so you can see exactly which sustainability moves actually change outcomes.