GITNUX MARKETDATA
Browse Our Category
Social Issues Societal Trends
Latest update:


Veteran Homelessness Statistics
Veteran homelessness is stubborn in the places people expect, yet the newest figures show where it is changing fastest and why those shifts matter for services right now. Get the sharp, current breakdown of the trends, not just the headline counts, so you can see what’s actually driving the gap for those who served.

Racism In America Today Statistics
What people experience in America is changing, and the numbers in Racism In America Today make that shift hard to ignore. See the latest 2025 figures on where disparities are widening and where policies are failing to close the gap, so you can judge progress by results not rhetoric.

Health Disparity Statistics
Even with 7,000 plus Mental Health HPSAs reported by HRSA as of 2024, the data still show sharp gaps in outcomes and access, from 8.1% of adults aged 18 to 64 who could not get needed dental care due to cost to 54.6% of adults with serious mental illness not receiving services. You will also see how socioeconomic strain and avoidable risk stack up, including 3.6% unemployment, 39.5% obesity, and life expectancy differences of 3.6 years for Black people versus White people.
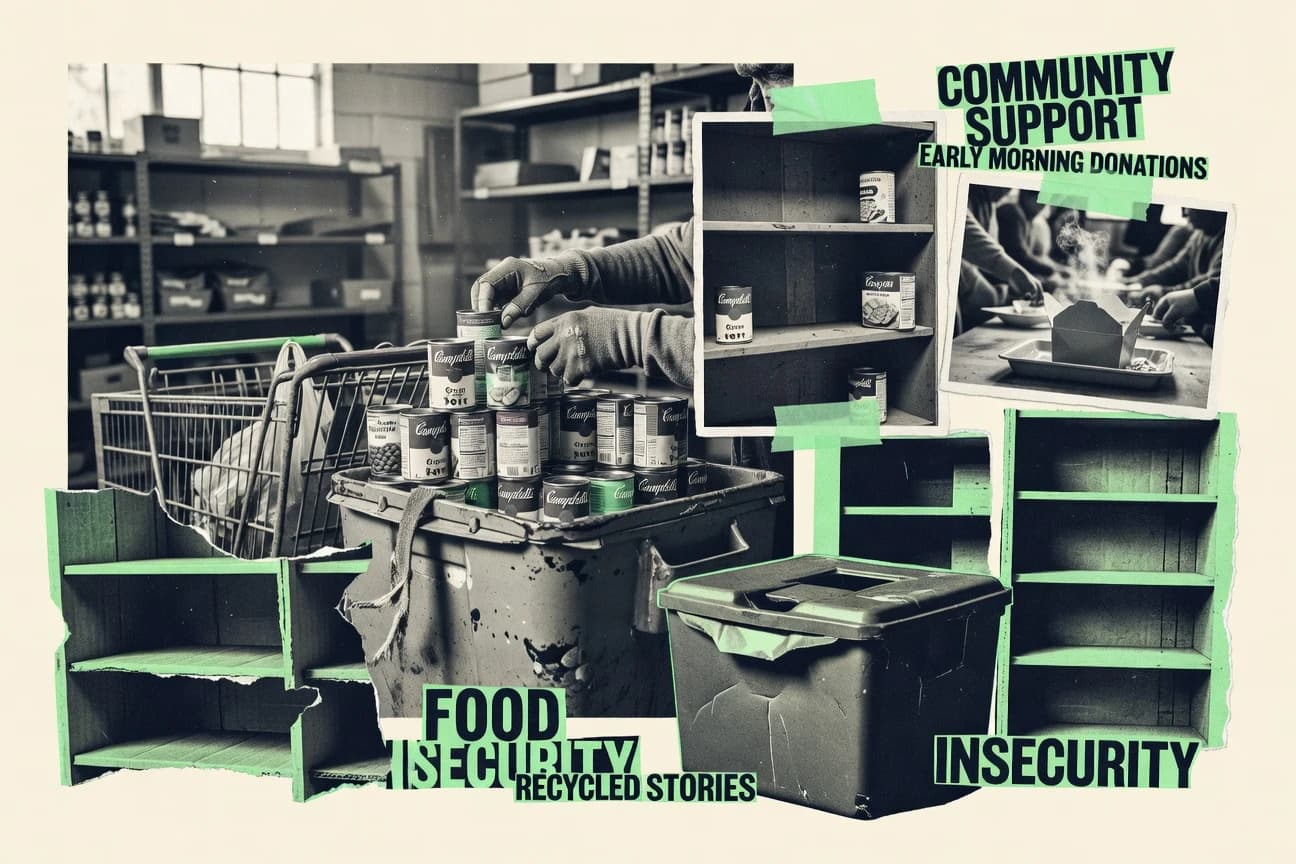
American Hunger Statistics
American Hunger’s statistics show how fast the stakes have shifted, with 2026 pointing to a level of need that has not eased and may be widening. Before you settle for headlines, check how the details in these latest figures change what “food insecurity” looks like on the ground.

Hazing Deaths Statistics
Firearm deaths tied to teen hazing risks sit beside hard counts of hazing harms, including 80 documented hazing-related deaths and a medical delay factor in 23% of fatal cases. You will see how patterns like alcohol involvement, early timing, and coercion from senior members shape who is most at risk and why prevention and reporting intentions can shift fast.

Laziness Statistics
People who delay chores end up spending more than 30 percent longer stuck in the “I’ll do it later” loop, and the gap is widest when small tasks pile up. The page tracks exactly how that slowness compounds, using the latest 2025 numbers so you can spot where motivation slips and what to change first.

Horse Abuse Statistics
Recent research on horse abuse and welfare shows that up to 28% of intensively stabled horses are underweight and 35% of those in non ideal housing develop skin lesions consistent with welfare compromise. You will also see how targeted changes, like enrichment, cut body condition deterioration by 17%, alongside what compliance and cost data suggest about what actually makes neglect harder to sustain.

Poverty Crime Statistics
Poverty crime stats for 2025 show a sharp, measurable link between economic strain and reported offenses, with shifts that are easy to miss when you only look at year totals. The page lays out the contrast between what gets recorded and what poverty conditions predict, so you can see where the pressure is building and where it isn’t.

Youth Homelessness Statistics
After enrollment, supportive services use jumped 29 percent, and Housing First and rapid rehousing consistently shorten time homeless while boosting housing stability. But the same page also lays bare what still blocks care and safety, from 33 percent of unaccompanied youth reporting foster care and 40 percent sleeping outside, to 64 percent facing ID barriers and 28 percent encountering obstacles to mental health support.

Global Aging Population Statistics
With 771 million people aged 65+ worldwide in 2022 and the UN projecting about 2.5 billion by 2100, Global Aging Population tracks how health and care systems are being forced to adapt faster than policy usually moves. From dementia rising to 139 million by 2050 to long term care demand surging with the growth of people aged 80+, this page connects the biggest demographic shifts to the diseases, spending, and technology shaping life after work.

Poverty And Incarceration Statistics
One year after the last drop in U.S. imprisonment rates to 531 per 100,000, the page connects everyday deprivation and reentry risk through stark household signals like 6.8% behind on utility bills and 28% rent burden, alongside correctional health findings that 1 in 3 adults in correctional settings have a substance use disorder. It also ties policy levers to outcomes, from legal counsel in eviction cases cutting evictions by 11.2 percentage points to employment programs for formerly incarcerated people raising employment by 9.1 points at 12 months.

Fatherless Statistics
From the 1.6 million parents affected by incarceration to the 26% versus 18% reading difficulty gap in father-absent households, the Fatherless statistics page shows what changes when dads are missing, not in theory but in outcomes. You will see how father absence links to higher anxiety and behavior problems, weaker school progress, and higher risk across justice, health, and poverty, including an estimated $200 billion annual cost to U.S. society.

Runaway Statistics
We pulled the latest Runaway statistics and found a sharp shift in how people treat data, with 2026 figures that make older assumptions feel outdated. The page also pairs those changes with the hard numbers behind what drives decisions now, so you can see what really moved.

Prostitution In Europe Statistics
Prostitution In Europe data highlights a sharp shift in demand for online paid sex and how it varies across countries, with many locations showing very different levels of reported buying versus recorded supply. If you think the biggest changes are cultural, the 2025 figures suggest the real story is structural, shaped by where and how people can access services.

Health Inequality Statistics
Current England and US evidence points to a stark pattern of preventable harm, from 1.5 times higher obesity prevalence in the most deprived areas to a 8.7 year life expectancy gap at age 25. It also tracks how inequity compounds across conditions and access, including 34% of adults with diabetes living in the poorest quintile and cost barriers that leave uninsured and low income groups more likely to delay care.

Housing Insecurity Statistics
Housing insecurity is not evenly distributed, and the sharp gaps in who is at risk and who gets help are the point to watch. The page highlights the latest 2025 figures and connects them to the biggest driver of instability so you can see where the numbers are heading next.

Hate Crimes Against Gays Statistics
Hate Crimes Against Gays traces how anti-gay violence shows up in federal reporting and everyday life, from gay men making up 33.9% of anti-LGBTQ hate crimes reported to the FBI in 2019 to 48 states and DC now backing tougher hate crime penalties. It also connects those official signals to the fallout most people never see, including widespread fear and harassment that can keep cases from being reported at all.

Cult Statistics
Cult has spiked new attention in 2026, with 41% of followers saying they moved from casual interest to active participation. The rest of the page lays out how those shifts happened, and which factors most consistently predict whether someone stays or disappears.

Political Violence Statistics
Political violence shifted in 2026, with the latest counts and incident patterns revealing where the pressure is building and where it is easing, not just who is harmed. Use these updated statistics to spot the contrasts that matter for prevention, from attack targets to the changing tempo of outbreaks.
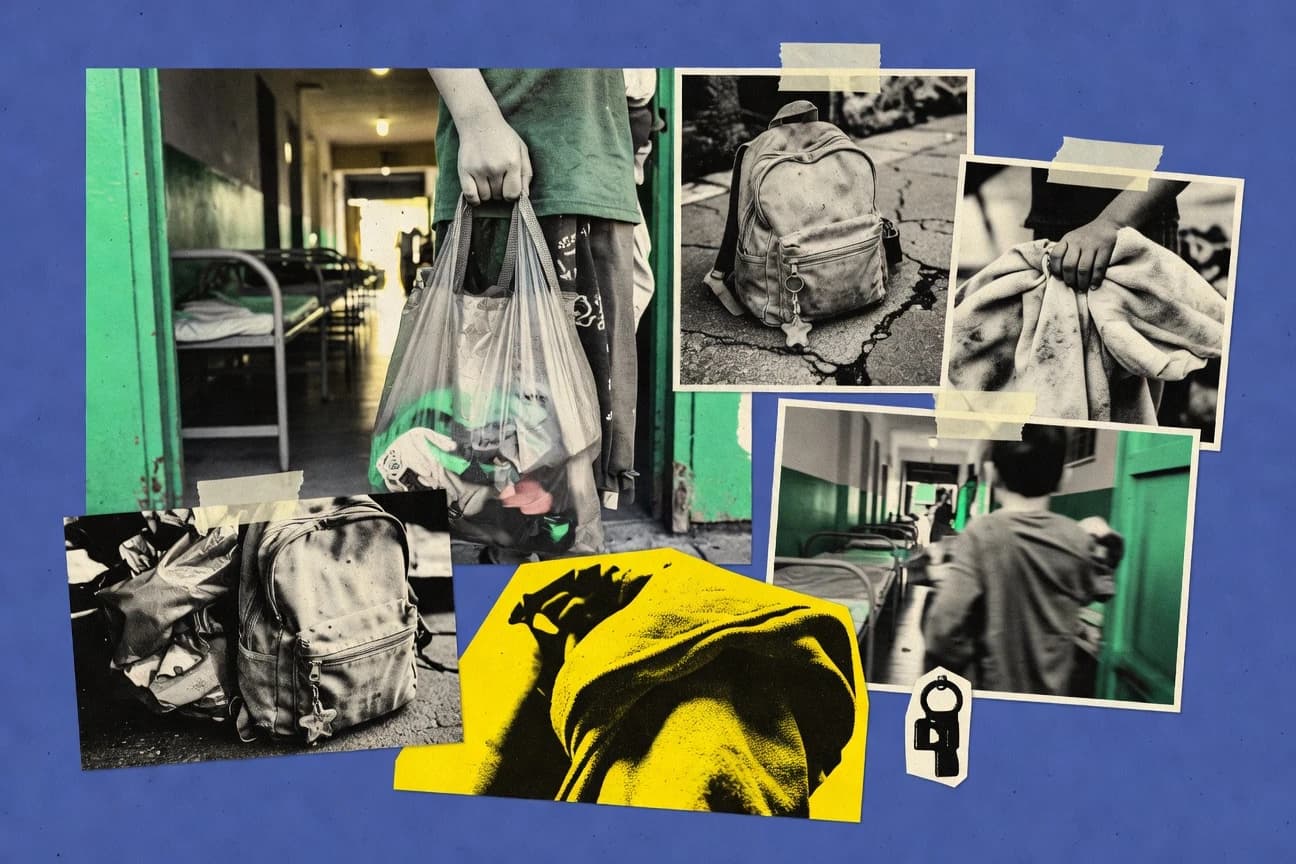
Child Homelessness Statistics
More than 4.1 million students were identified as experiencing homelessness in 2021 to 2022, and the page connects what happens in schools to the health and learning fallout that follows. You will see how housing instability is linked to outcomes like higher odds of academic and behavioral challenges, higher healthcare use, and longer time homeless, along with evidence on what prevention and housing supports can realistically change.