GITNUX MARKETDATA
Browse Our Category
Social Issues Societal Trends
Latest update:

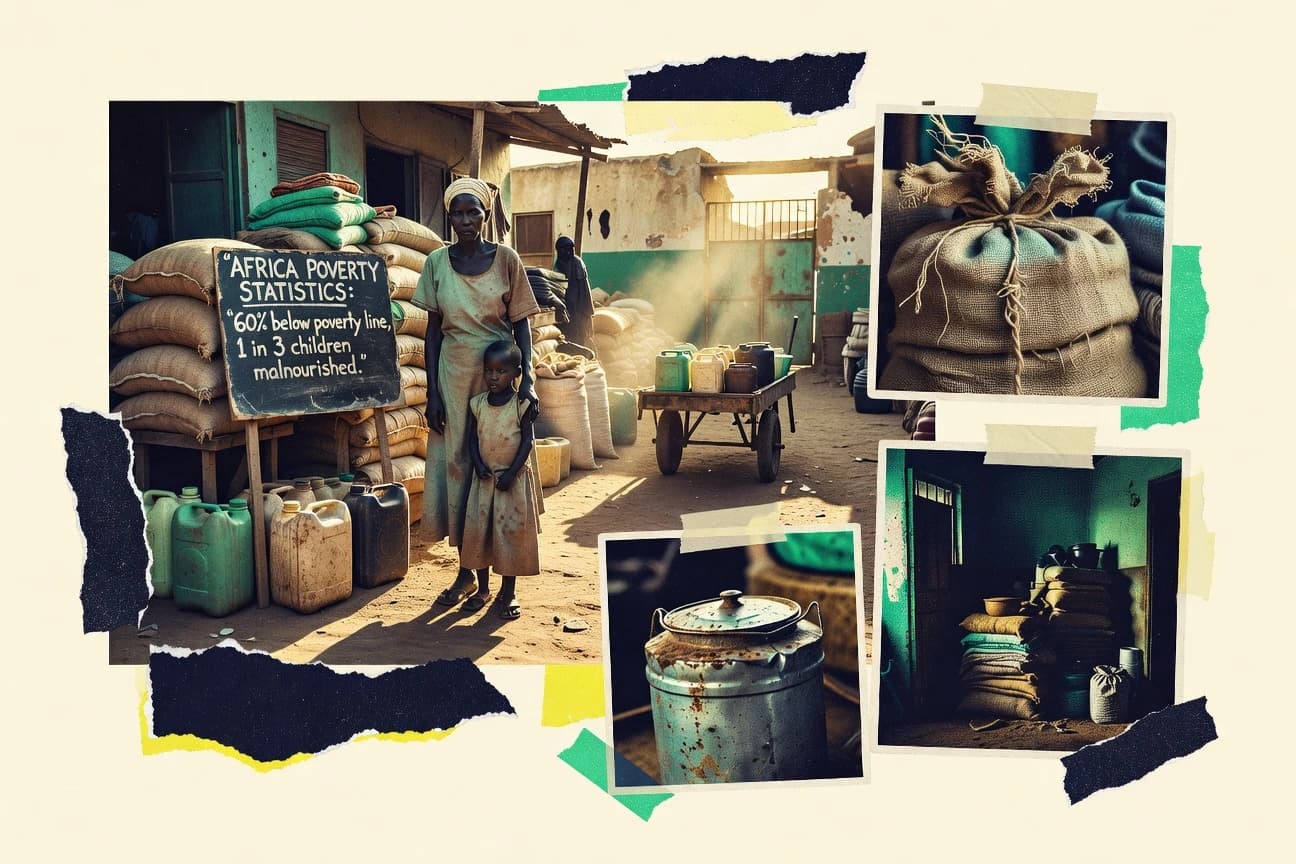
Africa Poverty Statistics
With 2022 extreme poverty at 35.1% of people in sub-Saharan Africa, the page tracks why poverty persists alongside human deprivation, from 60% lacking electricity to 345 million facing food insecurity. It also connects the social safety net and jobs picture, including 17.5% NEET youth, 72% of small firms without formal credit, and how climate and conflict push more people toward vulnerability.

Sweatshop Statistics
Across collapse, fire, poisoning, and forced labor, Sweatshop’s latest page puts the human cost in hard counts, including 4,000 garment injuries reported each year in Bangladesh and 75 million apparel workers worldwide in 2022 estimates. You will see how locked exits, debt bondage, and wage starvation sit next to 7.8 million disaster deaths and rising abuse patterns, turning “production” into something that can injure, silence, or kill.

Harassment Statistics
With 63% of reported harassment happening online at least sometimes, the way harm spreads is shifting faster than many policies do, and the impact is measurable too. See how multiple reporting channels can raise reporting odds by 2.5 times and why organizations that invest in investigations and case management keep running into the same hard question HR teams face every year.
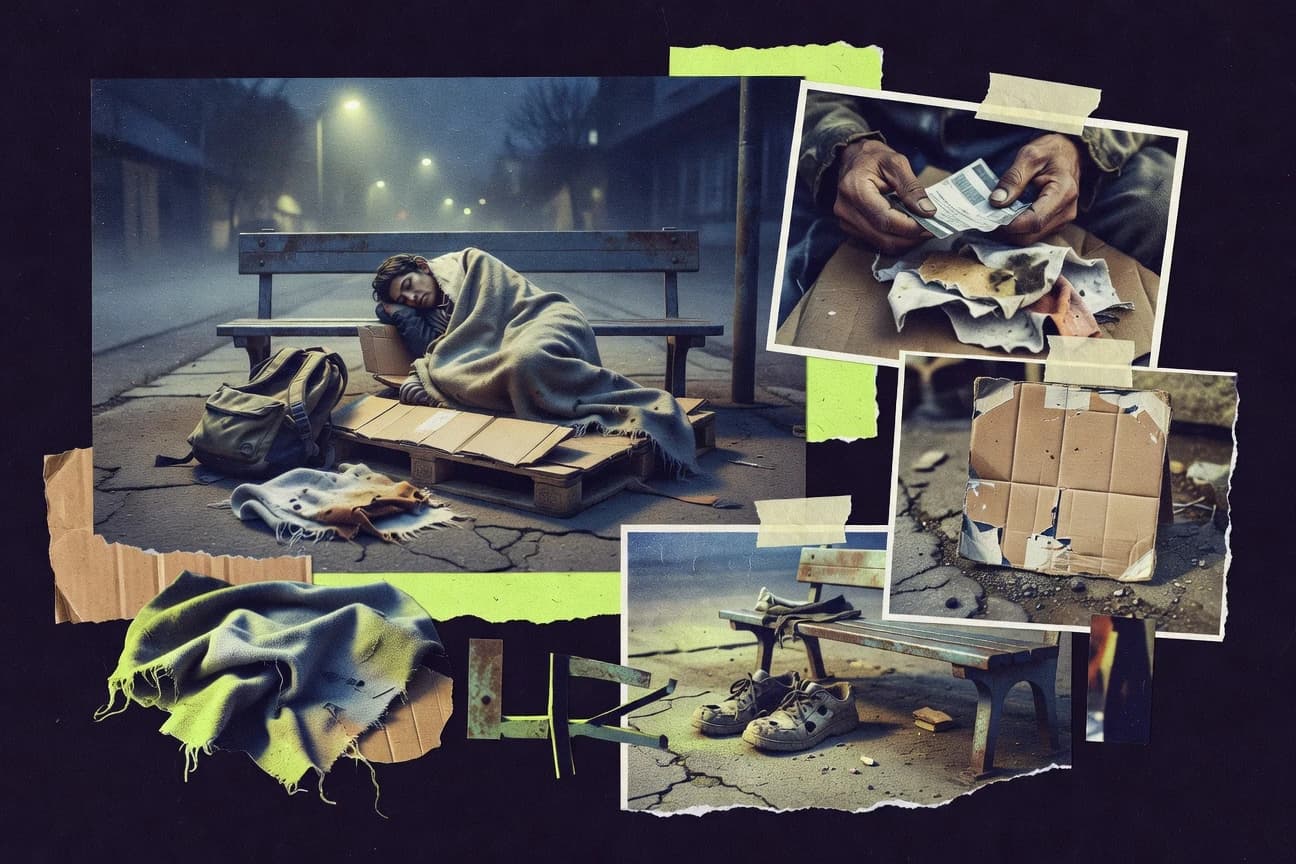
Homeless People Statistics
With 653,104 people experiencing homelessness on a single night in the United States and that total up 12% from 2022, housing costs and evictions create the fastest route into crisis, while domestic violence, mental illness, and substance use keep people from getting back. This page follows the chain from rent and wages to shelters and health outcomes, including unsheltered homelessness, chronic illness, and what housing first and rapid rehousing are doing when stability arrives too late.
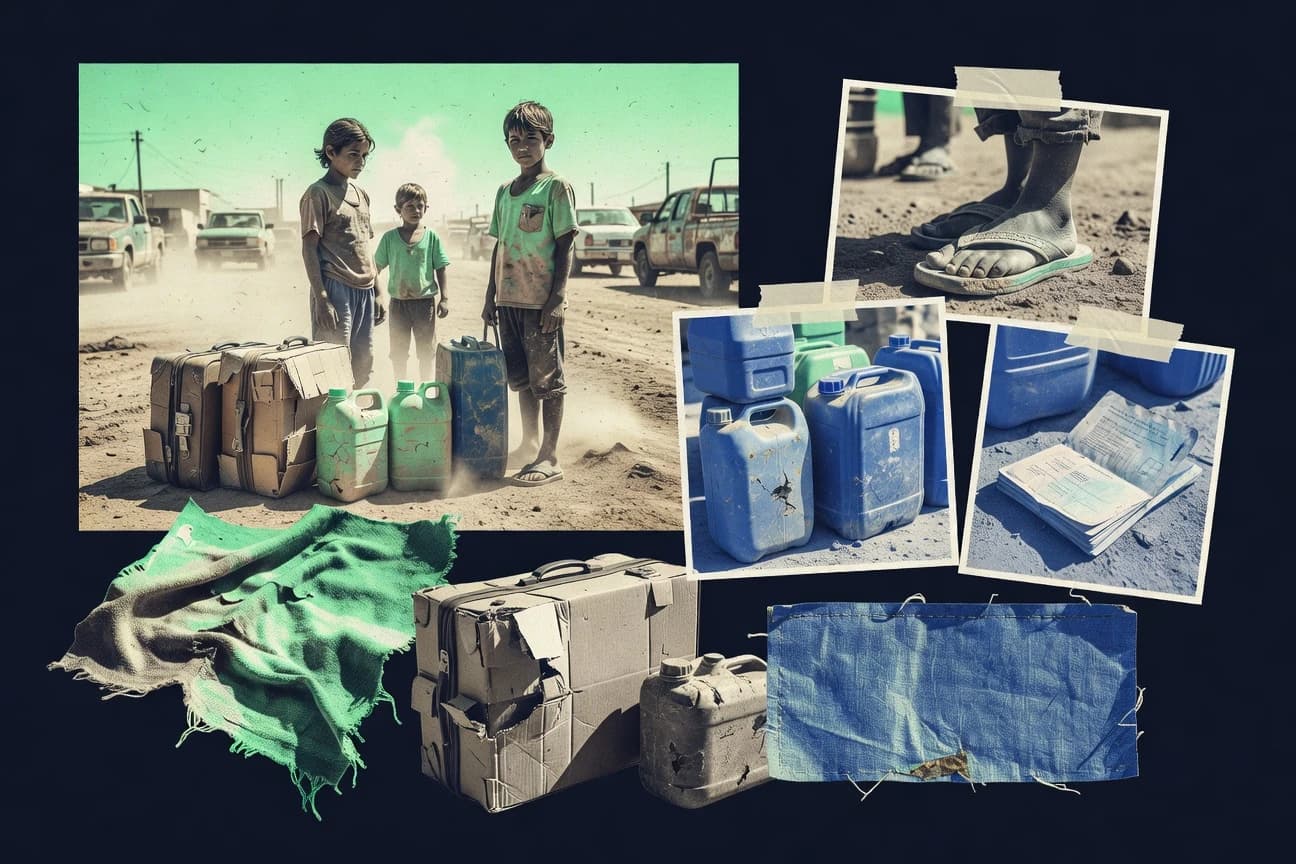
Climate Refugees Statistics
With climate pressures now tightly entangled with forced movement, the latest figures show 2.8 million EU residents were indirectly affected by climate and disaster risks in a single snapshot of vulnerability and mobility drivers, while 2024 global greenhouse gas levels reached 419.3 ppm CO2. The page connects those climate signals to what people experience on the ground, from urban hosted refugees to coastal flooding exposure, drought shocks, and the funding gaps that shape whether displacement is met with shelter, protection, and adaptation support.

Redlining Statistics
With 2018 analysis and enforcement linked to HOLC-style neighborhood grades showing large impacts on lending costs, property values, and foreclosure risk, this page connects 2,496 publicly downloadable HOLC maps to measurable, modern outcomes. You can compare the A to D rating system and its lowest grade that shaped underwriting risk perceptions with how mortgage access and rates translated into thousands of dollars of lost wealth for affected households and thousands of dollars in lost home equity over time.
Red States Welfare Statistics
Red States Welfare cuts through the familiar red blue divide with fresh 2023 contrasts such as federal welfare reaching $700 billion to red states, yet poverty reduction moving slower than expected, while red states still run welfare at 9% of GDP versus 7% in blue states. You can also see how entitlement rollups stack up state by state, from Texas’s $50 billion in 2023 federal welfare aid and Medicaid expansion aftershocks to SNAP participation averaging 16.5% in red states versus 13% in blue, making the page a must read for anyone trying to understand who depends on what and why.
Single Father Crime Statistics
Single Father Crime uncovers where risk spikes sharply, with 2023 Washington reporting single fathers facing 30% higher shoplifting costs while 2022 US data links custody battles to 3.4x more bankruptcy fraud tied to custody fights. It also challenges assumptions about “average” parenthood, from Utah’s 2023 adoption fraud rate 29% above norm to the 2019 finding that 18% of single fathers were convicted of child neglect versus 7% of married fathers.

Health Inequalities In The Uk Statistics
In 2025, health outcomes still split sharply by where people live, who they are, and what support they can access, with avoidable gaps showing up in the most basic measures of wellbeing. Read the UK statistics to see how progress can look uneven, and why the pattern of inequality is not shrinking evenly across communities.
Global Population Statistics
As of 2026, the world population has surged past 8.2 billion, yet the most dramatic story is how unevenly that growth is landing across regions and age groups. Global Population statistics put the tension in focus, from shifting birth patterns to where demand for jobs, food, and healthcare will rise fastest.

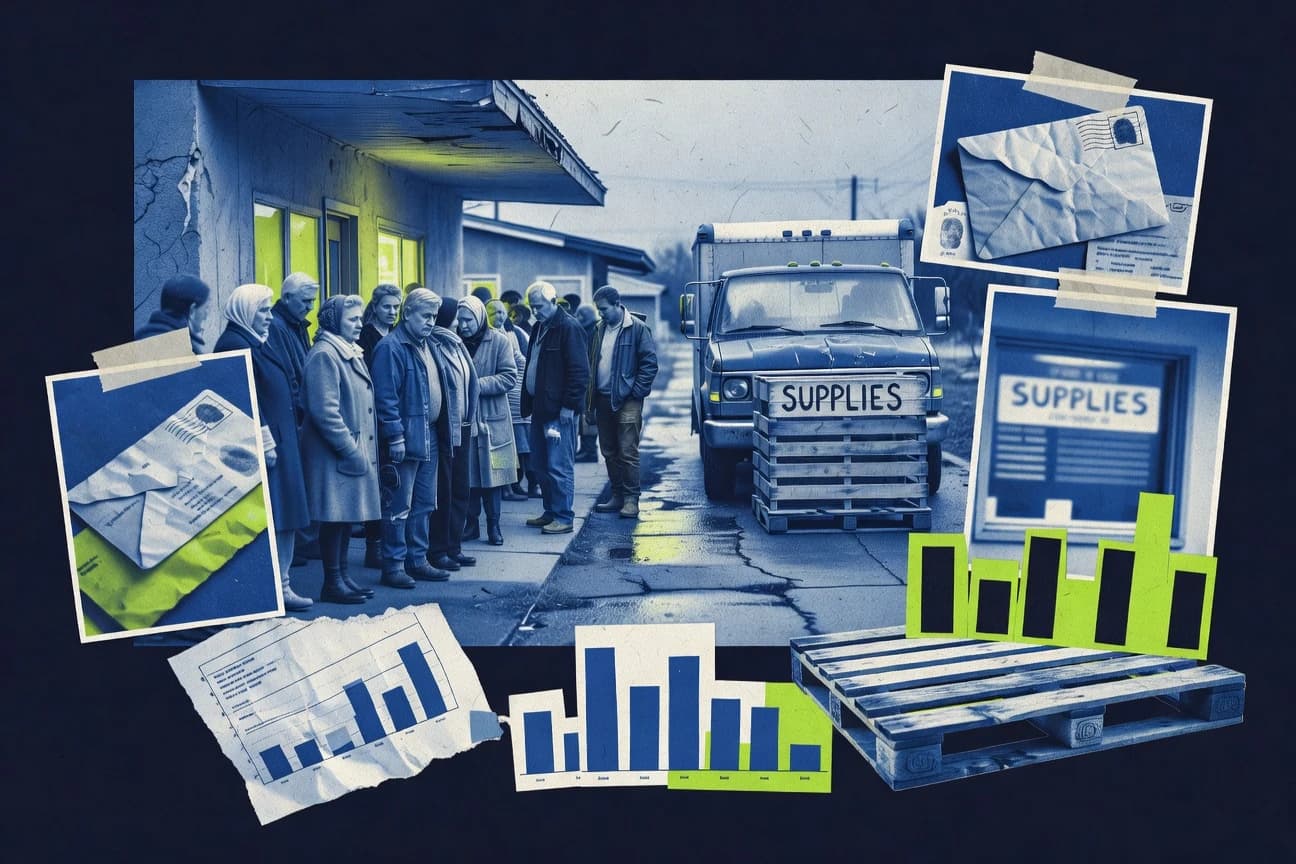
World Homeless Statistics
With 161,000 people experiencing homelessness in the US in 2023 and 17% sleeping unsheltered, the page connects what is happening on the street to what funding and housing policy are doing and not doing, from US$4.0 billion in ARPA allocations and ESF+ commitments to Housing First results like a pooled odds ratio of 2.14 for maintaining housing. It also weighs the human drivers of risk, including rent burden and eviction pressures, against interventions that cut shelter days, emergency visits, and crisis use, so you can see where current strategies are moving the needle.

Antisemitism Statistics
Antisemitic incidents surged in 2025, and the details make the pattern harder to ignore than the headline suggests. See which places, platforms, and forms of abuse drive the rise and what that shift means for prevention efforts right now.

American Emigration Statistics
American emigration is shifting fast and the latest figures show it in plain sight, from who is leaving and where they land to how 2025 patterns compare with the year before. If you want to understand why movement is accelerating in some directions while stalling in others, this is the page to read.
Syrian Refugee Crisis Statistics
More than 5.6 million Syrians remain refugees outside their country, and the needs inside Syria still reach 14.6 million people in 2024, putting displacement pressure on every neighboring response. From deep water and health-care gaps in Jordan to the scale of continued registration in Türkiye and Lebanon, this page pairs current, country-level realities with the long arc of UNHCR outflows to show how fast relief demands can outgrow funding.

Prostitution Us Statistics
The latest Prostitution Us figures show a sharp change that makes the story harder to ignore than the headline numbers suggest. If you want to understand who is impacted and how the risk landscape is shifting, these stats are the fastest place to see it clearly.

Assisted Suicide Statistics
Assisted Suicide statistics are quietly shifting, and the newest figures show how the reasons and circumstances are changing, not just the totals. If you care about what people report driving the decision, the page connects the trend to the real motivations behind it.
Cyberbullying Social Media Statistics
Nearly everyone is online, yet the harm scales fast. The global social media user base hit 5.04 billion in January 2025, while U.S. adults still report online threats and real studies link cyberbullying to higher odds of depression, anxiety, and suicidal ideation.

Social Media Distraction Statistics
With 2.6 hours a day of social media time for UK adults in 2024 and 83% of US teens reporting daily platform use, the “just a quick check” habit looks less harmless than it seems. The page connects that everyday switching to measurable costs like slower work and reduced focus, including notification and interruption studies that show how much productivity and wellbeing can slip when feeds constantly interrupt.

Catcalling Statistics
Find out what happens when “just a compliment” collides with the numbers. From 2026 data showing how often catcalling is still reported in public spaces to the sharp gaps in who gets targeted and who feels safe, this page turns everyday harassment into specifics you cannot ignore.

Homelessness Statistics
See how the latest 2025 numbers map the pressure points behind homelessness and what they reveal about who is being left out of support. You will also find the sharp contrasts between rising need and the services that struggle to keep up, down to the counts that change from one street to the next.