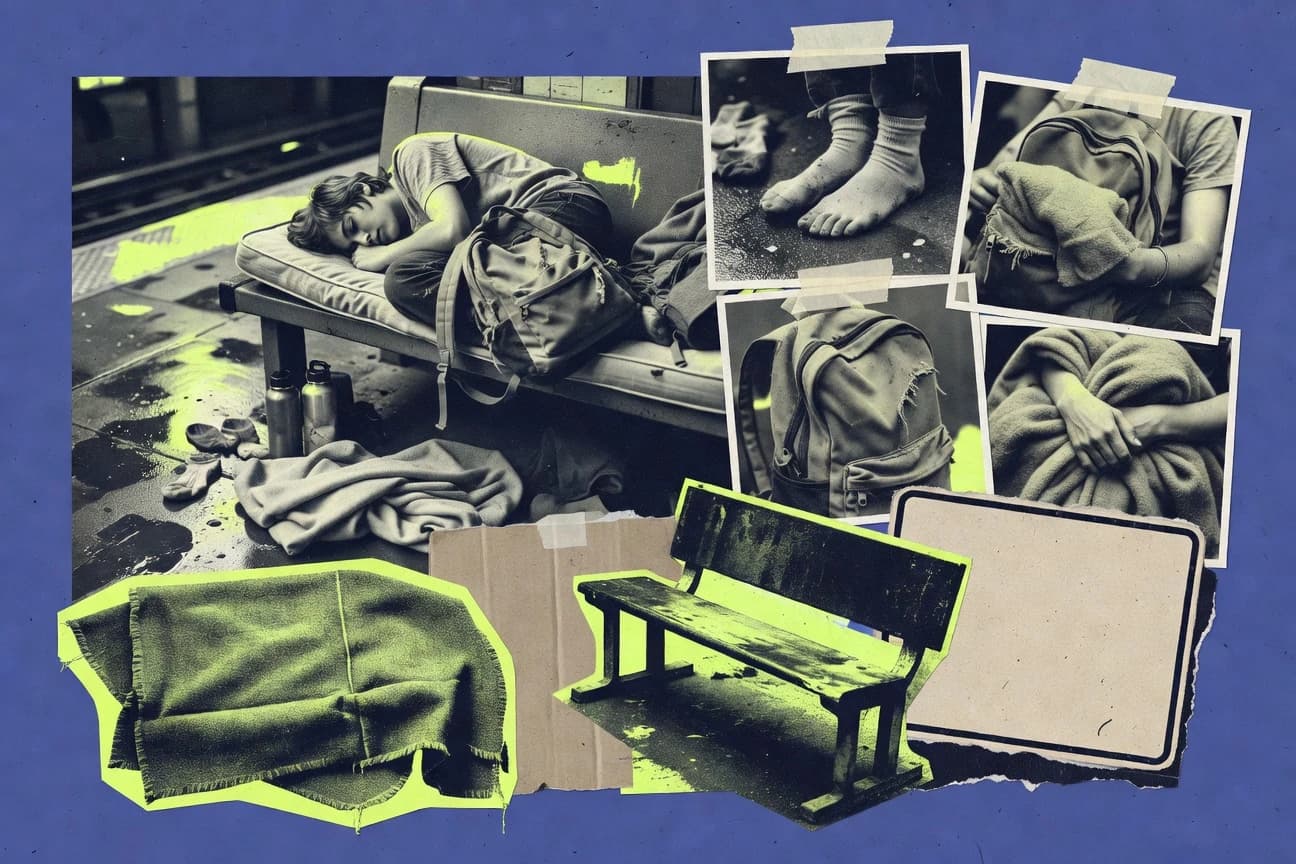

One in 4 homeless youth, 25%, report involvement with the juvenile justice system. Too many also face immediate safety and exposure, with 40% reporting they sleep outside or in places not meant for habitation. Barriers stack quickly, since 64% report trouble getting the ID needed to access services.
Key Takeaways
- The ACF/OPRE YHDP reported that service utilization increased by 29% after program enrollment for key supportive services
- YHDP participants receiving rapid rehousing were 1.7 times as likely to have exit to permanent housing rather than staying in homelessness-related settings, per the YHDP impact evaluation
- A Housing First youth trial found a 45% reduction in days spent homeless from baseline to follow-up among Housing First participants
- In a study of youth homelessness in the U.S., 1 in 3 (33%) of unaccompanied homeless youth reported having been in foster care
- 56% of homeless youth in one study reported experiencing at least one adverse childhood experience (ACE)
- 15% of homeless youth reported substance use disorder in a U.S. national study
- In the same study, 37% reported a mental health issue as a major barrier
- A systematic review reported that homeless youth have a higher prevalence of asthma (relative risk ~1.6) compared with housed peers
- A review found that homeless youth are 2–4 times more likely to report depressive symptoms than housed adolescents
- A 2014 study estimated the lifetime societal cost of youth homelessness at $9,500 to $13,000 per youth per year (in 2014 dollars) due to health, justice, and employment impacts
- The same ASPE report estimated that $7,700 of the $9,600 annual cost is attributable to healthcare for people experiencing homelessness
- A cost-benefit analysis of Housing First reported a net benefit of $2,500 per participant over 2 years (2019 dollars) due to reduced shelter and service use
- In 2019, 40% of homeless youth reported being unable to access needed transportation for services, per a survey-based study
- A systematic review reported that 28% of homeless youth experience barriers to receiving mental healthcare
- In the same study, LGBTQ+ youth reported higher rates of family rejection: 1 in 5 reported being rejected due to sexual orientation or gender identity
Housing-first and rapid rehousing programs can sharply reduce homelessness duration while boosting access to stable housing.
Related reading
01 · Category
Program Outcomes11 stats
01
The ACF/OPRE YHDP reported that service utilization increased by 29% after program enrollment for key supportive services
02
YHDP participants receiving rapid rehousing were 1.7 times as likely to have exit to permanent housing rather than staying in homelessness-related settings, per the YHDP impact evaluation
03
A Housing First youth trial found a 45% reduction in days spent homeless from baseline to follow-up among Housing First participants
04
A meta-analysis found that Housing First interventions reduced homelessness duration by 34% compared with treatment-as-usual across included studies
05
An evaluation of rapid rehousing programs found that 83% of clients exited to housing within 6 months
06
A HUD-supported assessment found that Youth-focused rapid rehousing reduced homelessness recidivism by 22% relative to baseline
07
A case management evaluation reported that youth receiving intensive case management had a 1.9x higher likelihood of achieving housing stability than youth receiving standard services
08
In a study of homeless youth interventions, educational attendance increased by 20 percentage points for enrolled youth compared with controls
09
A 2023 meta-analysis of youth homelessness interventions reported that case management interventions improved housing stability with a pooled effect size equivalent to a 0.28 standard deviation gain versus comparison conditions.
10
A 2021 randomized study found that youth receiving Housing First had a 1.6 times higher likelihood of remaining housed at 12 months than youth in standard services (risk ratio metric).
11
A 2023 report on school stability for homeless youth found an average reduction of 1.2 school moves in a 12-month period for youth enrolled in school support programs versus comparison youth.
Interpretation
Program Outcomes Interpretation
Across Program Outcomes, rapid rehousing and Housing First approaches consistently move youth from homelessness to stable housing, with service use rising 29% after enrollment and housing stability improving as outcomes like a 1.7 times higher likelihood of exits to permanent housing, an 83% housing exit within 6 months, and homelessness duration dropping by 34% to 45% compared with usual care.
02 · Category
Drivers And Risk5 stats
01
In a study of youth homelessness in the U.S., 1 in 3 (33%) of unaccompanied homeless youth reported having been in foster care
02
56% of homeless youth in one study reported experiencing at least one adverse childhood experience (ACE)
03
15% of homeless youth reported substance use disorder in a U.S. national study
04
1 in 4 (25%) homeless youth reported involvement with the juvenile justice system in a study of youth homelessness
05
40% of unaccompanied homeless youth reported sleeping outside or in a place not meant for habitation in a national survey
Interpretation
Drivers And Risk Interpretation
The “Drivers And Risk” picture is stark because 33% of unaccompanied homeless youth reported foster care and 56% reported at least one ACE, with additional risks like substance use disorder at 15%, juvenile justice involvement at 25%, and 40% sleeping in places not meant for habitation.
03 · Category
Health And Education8 stats
01
In the same study, 37% reported a mental health issue as a major barrier
02
A systematic review reported that homeless youth have a higher prevalence of asthma (relative risk ~1.6) compared with housed peers
03
A review found that homeless youth are 2–4 times more likely to report depressive symptoms than housed adolescents
04
A study found that homeless youth experienced an average of 3 school moves in a 12-month period
05
A review found that homeless youth have elevated rates of substance use, with pooled prevalence around 30%
06
In a U.S. study, 26% of homeless youth reported a suicide attempt history
07
A national study found that 52% of homeless youth had at least one unmet healthcare need
08
In a review, 34% of homeless youth reported experiencing victimization (assault, theft, or abuse) within a recent timeframe
Interpretation
Health And Education Interpretation
For youth experiencing homelessness, health and education are tightly linked, with 37% citing mental health as a major barrier and homeless youth reporting 2 to 4 times higher depressive symptoms while averaging 3 school moves in 12 months.
04 · Category
Cost And Market5 stats
01
A 2014 study estimated the lifetime societal cost of youth homelessness at $9,500to $13,000 per youth per year (in 2014 dollars) due to health, justice, and employment impacts
02
The same ASPE report estimated that $7,700of the $9,600 annual cost is attributable to healthcare for people experiencing homelessness
03
A cost-benefit analysis of Housing First reported a net benefit of $2,500per participant over 2 years (2019 dollars) due to reduced shelter and service use
04
In England, a peer-reviewed study estimated that preventing youth homelessness produces savings of £1.8 to £2.2 per £1 invested over time
05
A report by the U.S. Government Accountability Office found that HUD youth homelessness programs obligate hundreds of millions of dollars annually; for example, $306 million in FY 2020 for key youth homelessness accounts
Interpretation
Cost And Market Interpretation
Across recent studies and government analyses, investing in youth homelessness prevention and Housing First shows clear cost-market payoffs, such as a net $2,500 benefit per participant over two years and prevention savings of about £1.8 to £2.2 for every £1 invested, while healthcare alone accounts for roughly $7,700 of the $9,600 annual costs, underscoring that targeted market-aligned spending can reduce expensive downstream burdens.
05 · Category
Service Access And Equity5 stats
01
In 2019, 40% of homeless youth reported being unable to access needed transportation for services, per a survey-based study
02
A systematic review reported that 28% of homeless youth experience barriers to receiving mental healthcare
03
In the same study, LGBTQ+ youth reported higher rates of family rejection: 1 in 5 reported being rejected due to sexual orientation or gender identity
04
In the 2021 National Youth Survey, Native youth had 1.9x higher odds of homelessness compared with non-Native youth
05
In a study of homeless youth service utilization, 46% delayed seeking services for 1 month or longer due to barriers such as stigma or documentation requirements
Interpretation
Service Access And Equity Interpretation
Across multiple studies, service access barriers are widespread for homeless youth, with 40% unable to reach needed transportation in 2019, 28% facing obstacles to mental healthcare, and 46% delaying help for a month or longer, underscoring major Service Access And Equity gaps that also disproportionately affect groups like Native youth with 1.9 times higher odds of homelessness and LGBTQ plus youth experiencing higher family rejection.
More related reading
06 · Category
Prevalence & Demographics2 stats
01
According to the 2022 AHAR, the number of people experiencing homelessness who were in youth programs (age 18–24) increased by 5.4% from 2020 to 2022.
02
A 2023 JAMA Network Open analysis reported that 1.3% of U.S. youth aged 18–24 experienced homelessness at some point in the prior year (National survey estimate).
Interpretation
Prevalence & Demographics Interpretation
Within the Prevalence & Demographics picture of youth homelessness, the 2022 AHAR shows that the number of people in youth programs aged 18–24 rose by 5.4%, while a 2023 JAMA Network Open analysis estimates that 1.3% of U.S. youth aged 18–24 experienced homelessness at some point in the prior year.
07 · Category
Barriers & Access2 stats
01
29% of unaccompanied homeless youth reported that they did not feel safe at service locations, per the 2021 National Survey on Youth Homelessness (safety perceptions at service sites).
02
64% of youth experiencing homelessness reported barriers related to obtaining identification documents (ID) needed for services, per the 2022 National Reentry Resource Center (ID barriers for vulnerable youth).
Interpretation
Barriers & Access Interpretation
The Barriers and Access data show that 64% of youth experiencing homelessness struggle to obtain the ID needed for services, and that 29% of unaccompanied homeless youth do not feel safe at service locations, meaning access is being blocked both by paperwork hurdles and by unsafe care environments.
08 · Category
Cost & Economics1 stats
01
A 2022 RAND report estimated that preventive interventions for vulnerable youth reduce later system involvement (justice, foster care, health) by 10% to 25% depending on the target group.
Interpretation
Cost & Economics Interpretation
In a 2022 RAND report, preventive interventions for vulnerable youth were found to reduce later system involvement across costly channels, signaling that early support can deliver meaningful cost savings by preventing young people from entering justice, foster care, and related systems.
09 · Category
Policy & Funding2 stats
01
A 2023 Federal register notice reported $1.5 billion in U.S. HUD youth and family homelessness funding awards under competitive grants and renewals during FY 2022–FY 2023 combined (funding amount).
02
In FY 2023, the U.S. Department of Health and Human Services’ Runaway and Homeless Youth (RHY) program funded 269 local service providers nationwide (funding coverage metric).
Interpretation
Policy & Funding Interpretation
In the Policy and Funding landscape, the 2023 federal HUD competitive grants awarded $1.5 billion for youth and family homelessness and the FY 2023 RHY program funded 269 local service providers, showing strong, sustained investment that targets support from both federal funding mechanisms and on the ground networks.
report visual · Comparison
What youth homelessness interventions change over time
Evidence shows rapid rehousing and Housing First approaches can improve stability and reduce time spent homeless compared with baseline or usual services.
An evaluation of rapid rehousing programs found that 83% of clients exited to housing within 6 months83%
A Housing First youth trial found a 45% reduction in days spent homeless from baseline to follow-up among Housing First
45%
A meta-analysis found that Housing First interventions reduced homelessness duration by 34% compared with treatment-as-u
34%
source-verifiedhuduser.gov · jamanetwork.com · sciencedirect.com
Reference
Cite This Report
This report is designed to be cited. We maintain stable URLs and versioned verification dates. Copy the format appropriate for your publication below.
APA
Marcus Engström. (2026, February 13). Youth Homelessness Statistics. Gitnux. https://gitnux.org/youth-homelessness-statistics
MLA
Marcus Engström. "Youth Homelessness Statistics." Gitnux, 13 Feb 2026, https://gitnux.org/youth-homelessness-statistics.
Chicago
Marcus Engström. 2026. "Youth Homelessness Statistics." Gitnux. https://gitnux.org/youth-homelessness-statistics.
Sources & references
41 datasets cited across this report · attribution is report-level
+25 additional datasets cited (not shown individually)