GITNUX MARKETDATA
Browse Our Category
Mining Natural Resources
Latest update:


Lithium Industry Statistics
With 2026 figures highlighting how quickly new lithium supply and demand are reshaping pricing power, this page tracks the tightest bottlenecks and where capacity is actually landing. The contrast between ramped capacity claims and real-world production dynamics makes the stats essential for anyone trying to see what comes next before the market does.

Indonesia Nickel Industry Statistics
Track how Indonesia’s nickel industry is shifting in 2025, from upstream production momentum to downstream pressure that changes where the value lands. This page stitches the key 2025 indicators into one view so you can see the gap between capacity plans and the realities behind them.
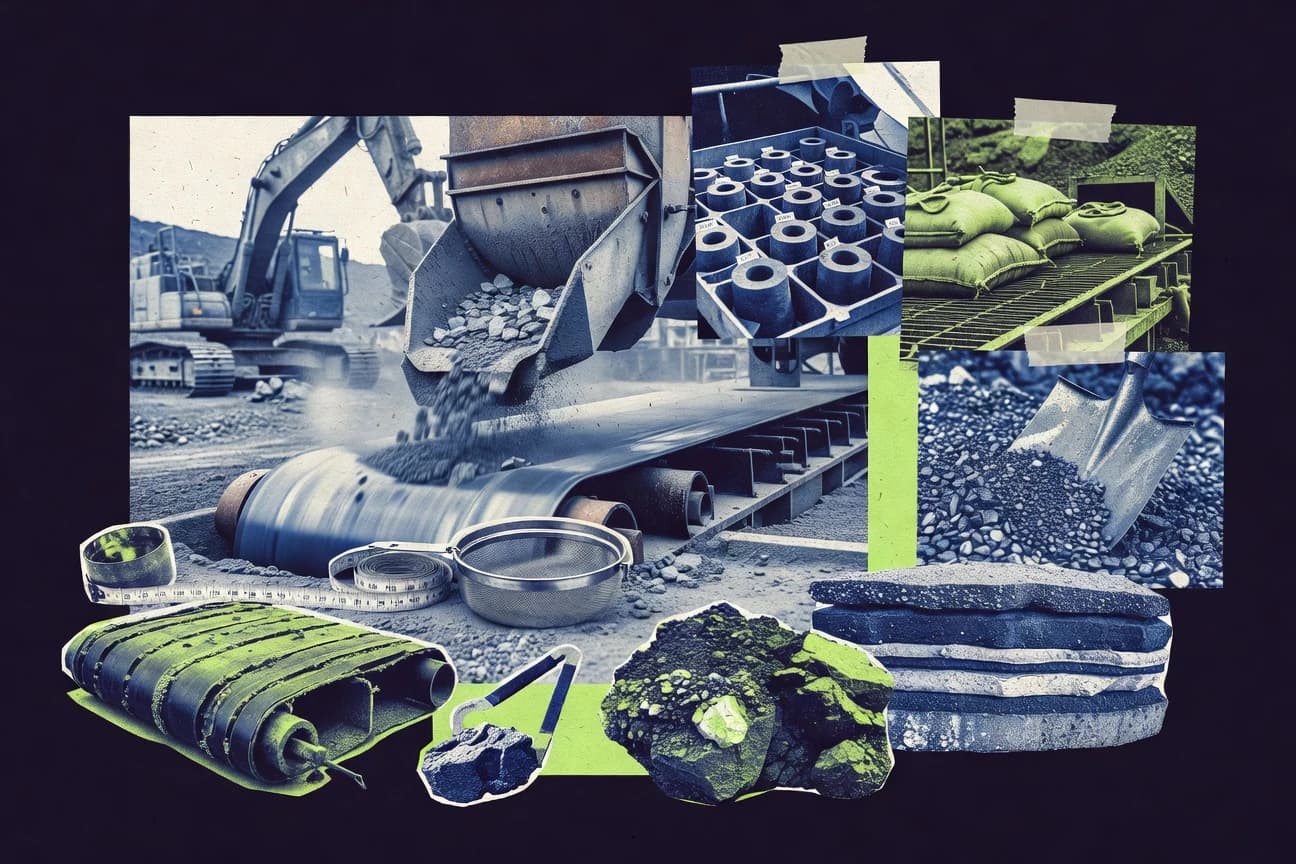
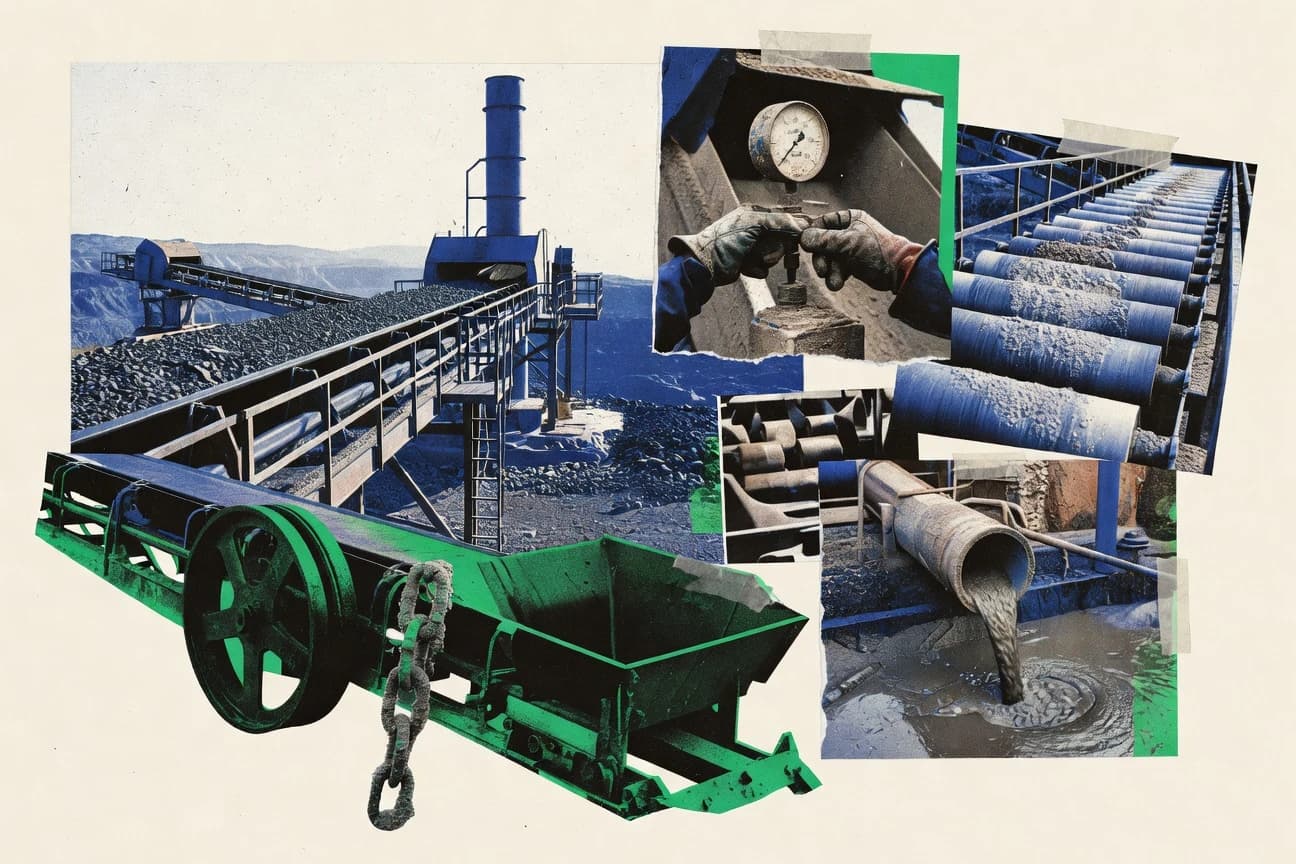
Mining Materials Industry Statistics
Watch how mining materials are shifting in real time, with 2026 numbers that sharpen the picture on production and demand versus earlier expectations. This page turns the sector’s key indicators into a clear, decision ready snapshot so you can spot where momentum is building and where it is stalling.

China Coal Industry Statistics
See how China Coal Industry is reshaping its picture for 2025, with key production and demand indicators moving in ways that don’t match the usual expectations. The page tracks the most recent shifts in output, consumption, and prices so you can spot what is actually driving the market right now, not what used to.
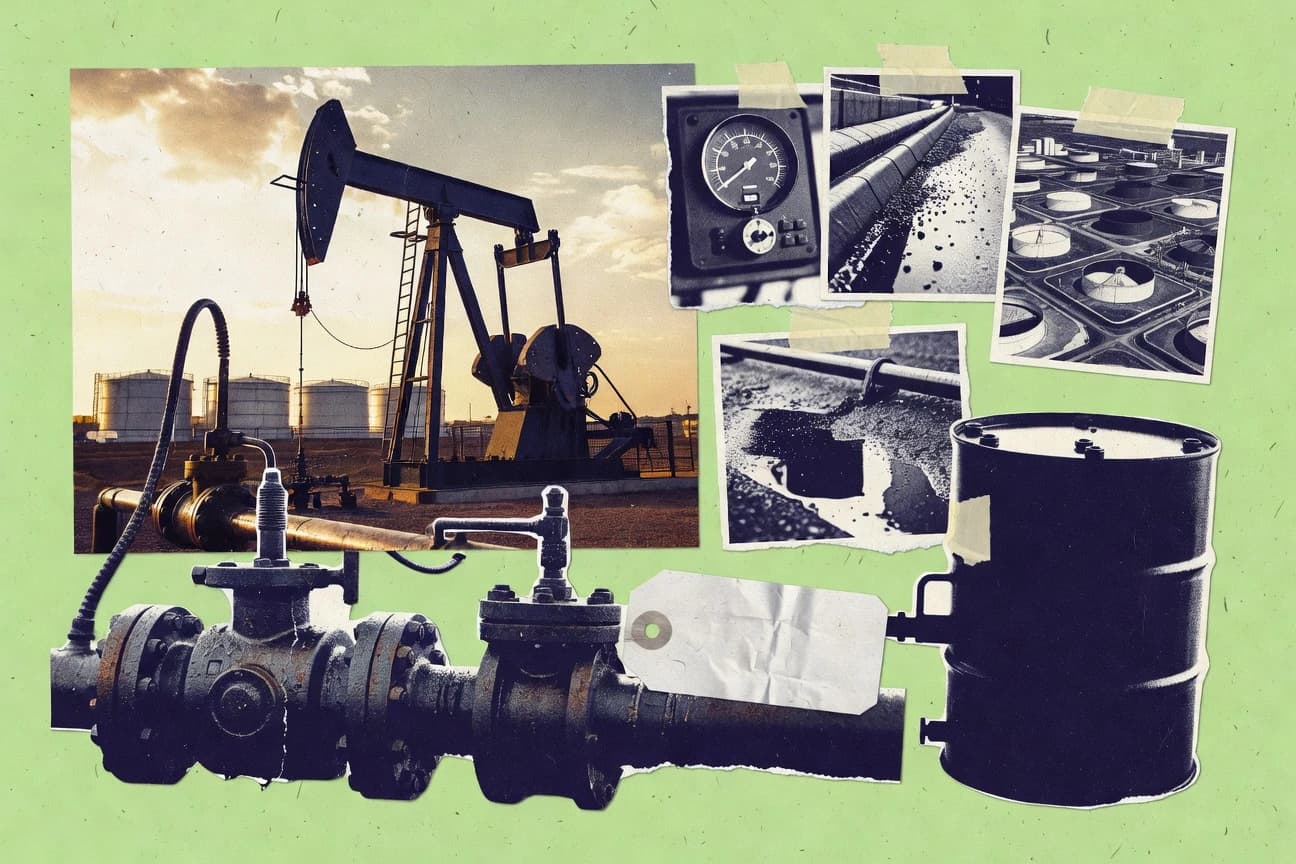
Petroleum Industry Statistics
Global oil demand is projected to ease to 102.4 mb/d in 2024 before rising to 104.1 mb/d in 2025, while OECD commercial petroleum stocks tick down to 2,662 million barrels in April 2024 and OECD oil inventories sit 61.7 million barrels below the five year average in May. At the same time, OPEC+ crude production has climbed to 40.4 mb/d in March 2024 as Brent averages $84.0 per bbl in 2024 YTD and U.S. refinery inputs run at 15.5 million b/d, setting up a tight, price sensitive balance between supply discipline and stock levels.
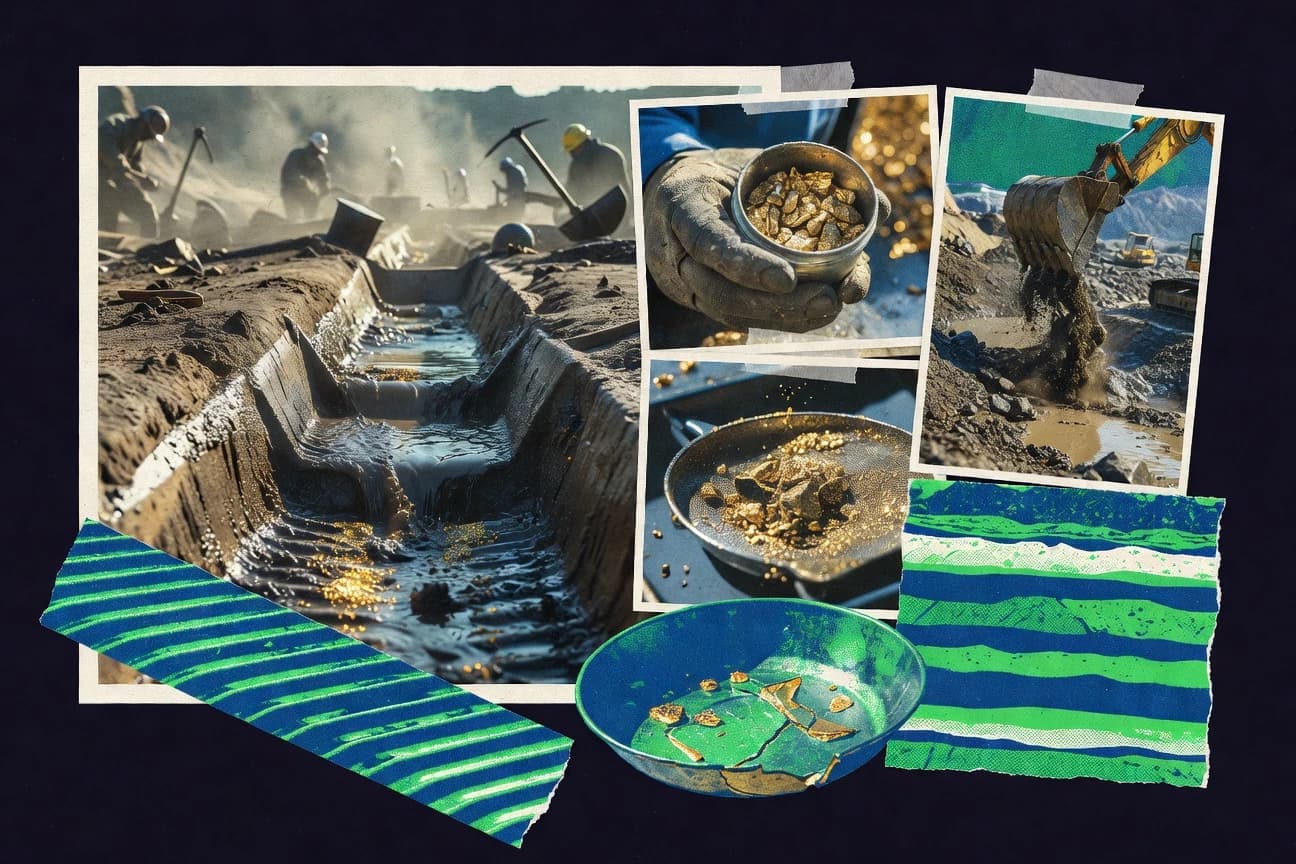
Gold Mining Industry Statistics
Global gold mine production rose to 3,421.5 tonnes in 2023, up 3.5% from the prior year, even as demand held fast at 4,317.9 tonnes. See how production is split by region and powerhouse countries, then weigh it against recycling of 1,539 tonnes and the shifting gold price backdrop that pushed annual averages above $2,000 in 2023.
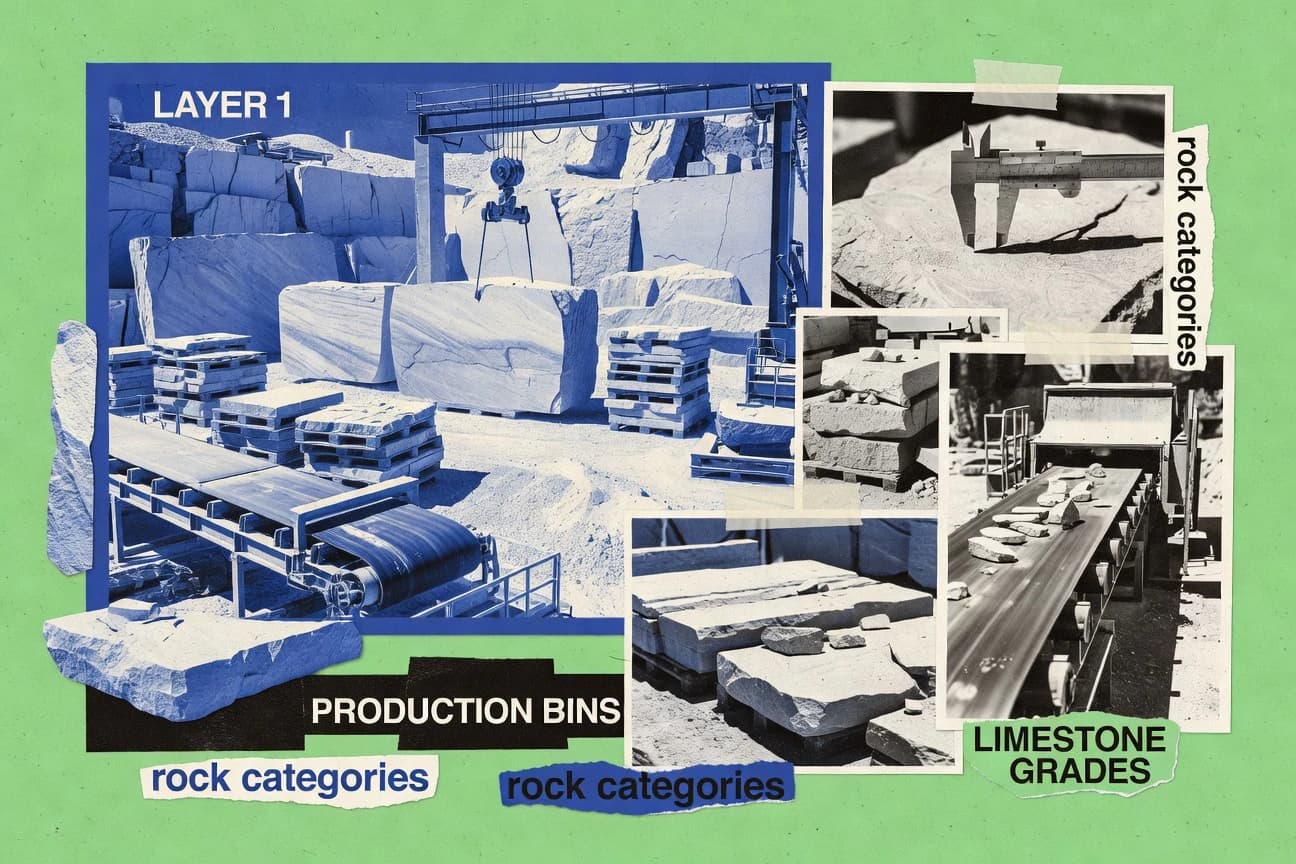
Natural Stone Industry Statistics
Projected at an 8.6% CAGR through 2032, the natural stone market is set to climb from $3.6 billion in the U.S. to $6.0 billion in Europe and $1.9 billion in India, but the real tension for buyers is whether tighter tolerances and EPD backed transparency justify a $0.5 to $1.5 per m² lifecycle premium. From OSHA silica compliance and IMO 2023/2024 shipping fuel rules to LEED up to 2 points for verified disclosures and a 1.2% global CO2 reduction potential from recycled aggregates, this page pinpoints the specific cost, safety, and sustainability factors driving specifications.

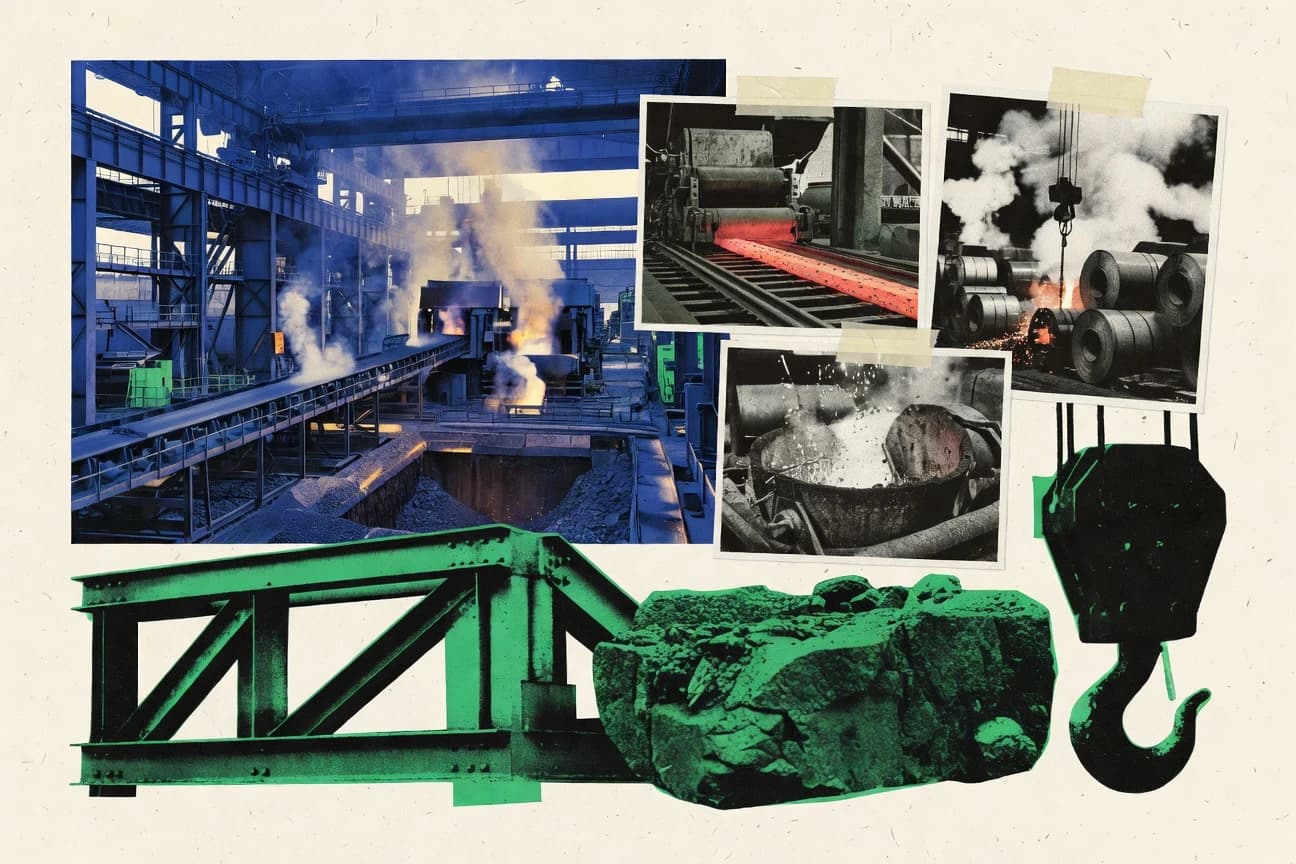
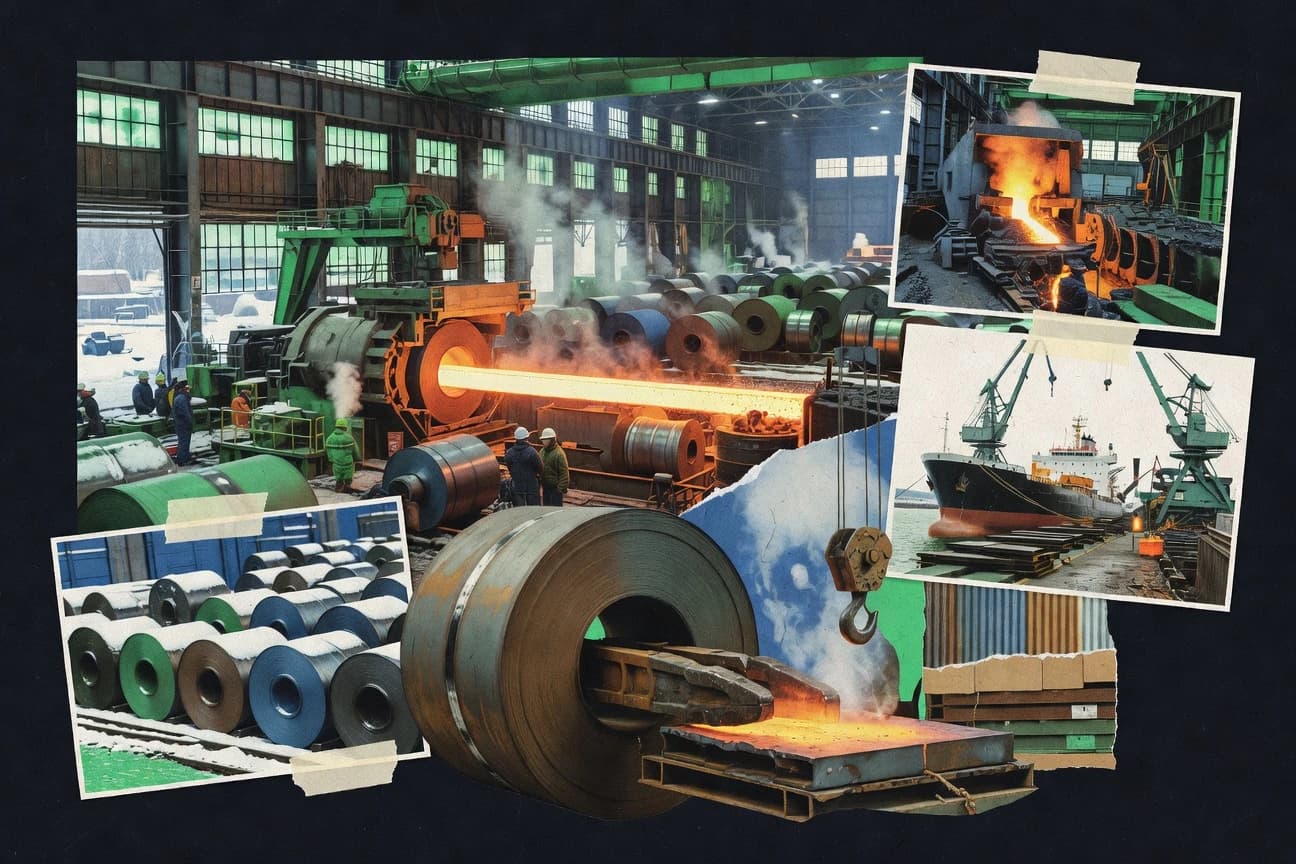
Italy Steel Industry Statistics
Italy’s steel story looks steadier on the surface in 2026 but the industry’s latest figures reveal where the pressure is really building, from production and capacity to imports and trade imbalances. If you want to understand what is changing now, not what used to be, these current Italy Steel Industry statistics will give you the context fast.
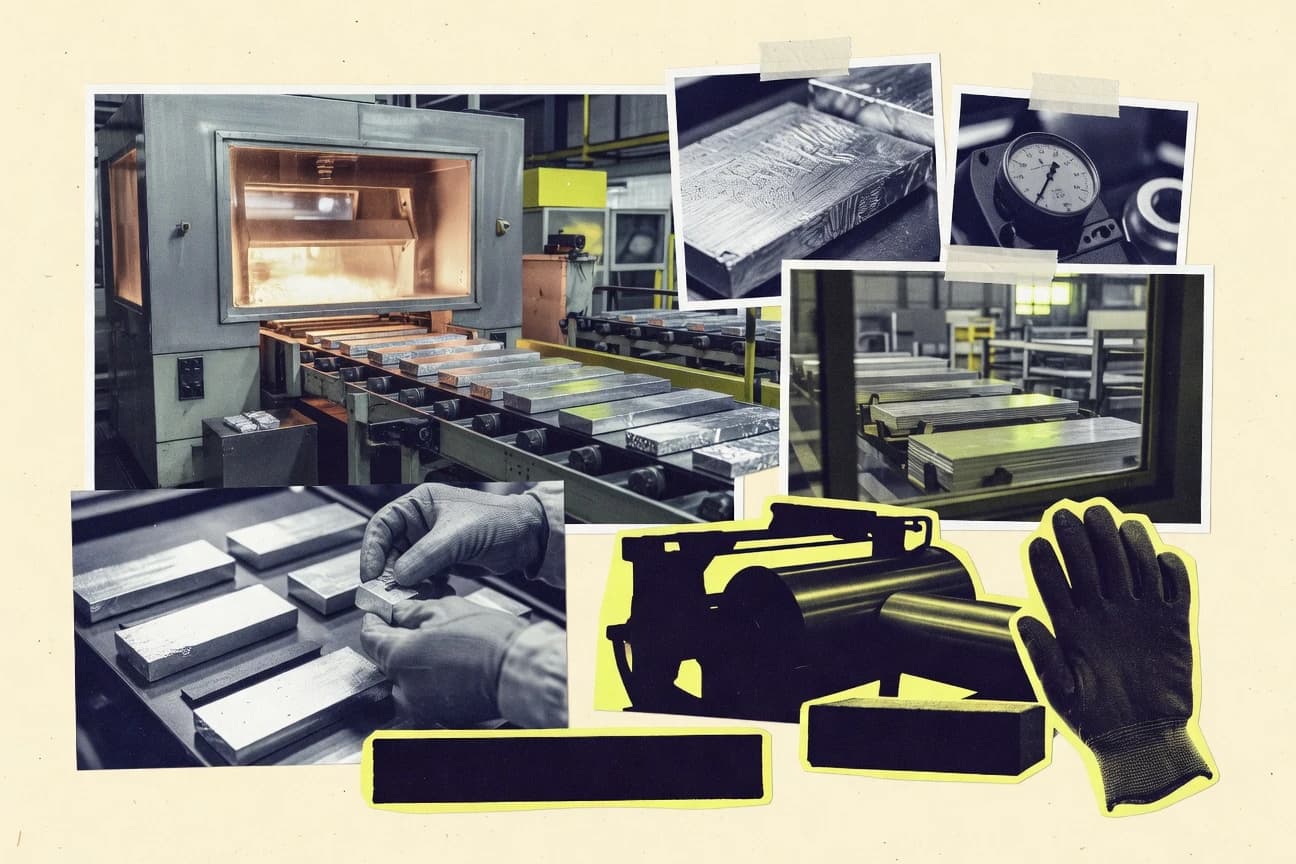
Japan Aluminum Industry Statistics
Japan’s aluminum economy is balancing dependence on bauxite imports with ambitious decarbonization targets, from a 46% GHG cut by FY2030 versus FY2013 to carbon neutrality by 2050. With bauxite refining typically driving 20–30% of primary aluminum costs, recycling already delivers a life cycle energy and emissions advantage of about 95% and 90% respectively, and the page ties those trade, capacity and market signals to what the numbers mean for Japan’s industry in the CBAM era.

Crystal Industry Statistics
See how the crystal industry is trending with the latest numbers from 2026 and what they reveal about demand, pricing pressure, and where value is actually concentrating. This page turns the raw figures into a sharp snapshot of a market that is shifting faster than many buyers expect.
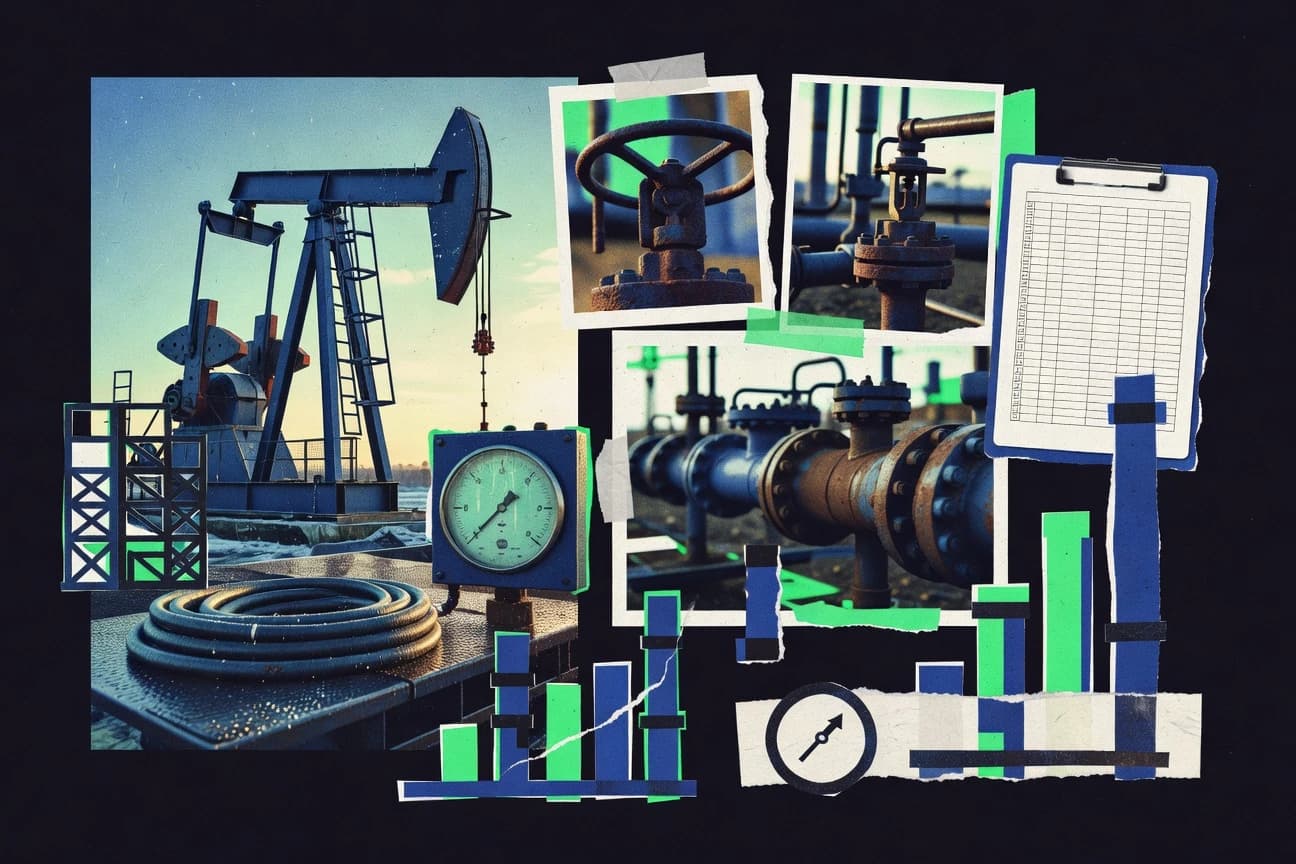
Oilfield Industry Statistics
Find out what’s really changing across the oilfield, from the latest 2026 figures shaping activity and investment to the pressure points revealed by production, rig, and supply chain trends. This page pulls the contrasts into focus so you can see where momentum is building and where it is quietly slipping.

Mining Equipment Industry Statistics
See how mining equipment demand and delivery cycles are shifting, with the latest 2025 figures setting a sharper pace than the slowdown implied by earlier trends. The page compares production and order signals side by side, so you can spot where equipment investment is accelerating and where it is stalling.
Germany Steel Industry Statistics
See how Germany’s steel industry is shifting in 2025, from output and demand to prices and trade flows, and why that balance is tightening fast. The page pairs the latest production and import export signals to show what is driving momentum and what is slipping.

Kaolin Industry Statistics
Kaolin Industry statistics for 2025 show a market that is quietly changing shape, with demand and pricing moving in directions many buyers did not expect. The page brings those 2025 figures into sharp focus against the latest industry shifts so you can spot what is driving decisions right now.
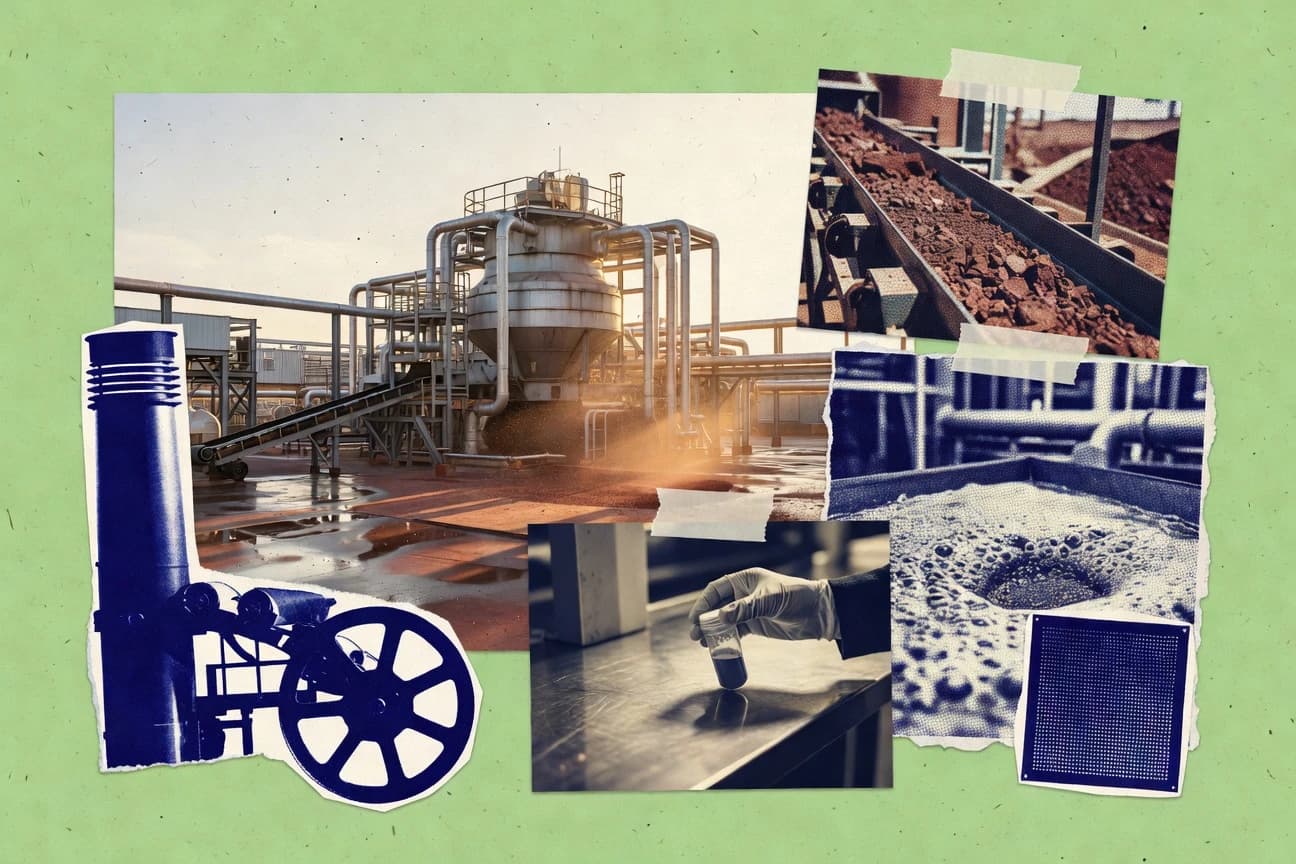
Alumina Industry Statistics
China dominates global alumina production, meeting most demand for aluminum smelting worldwide.

Iron Ore Statistics
Iron ore statistics in 2026 highlight how quickly prices, production, and trade pressures are shifting, and why that matters for anyone tracking margins and supply. One set of numbers shows a surprising break from the old rhythm, making the latest trends impossible to ignore.
Phosphate Industry Statistics
Phosphate Industry’s latest numbers track how demand, production, and trade are reshaping pricing power in 2026, revealing a sharper swing than most forecasts anticipated. See where growth is accelerating and where supply constraints are tightening, so you can separate short term volatility from the next durable shift in the phosphate market.
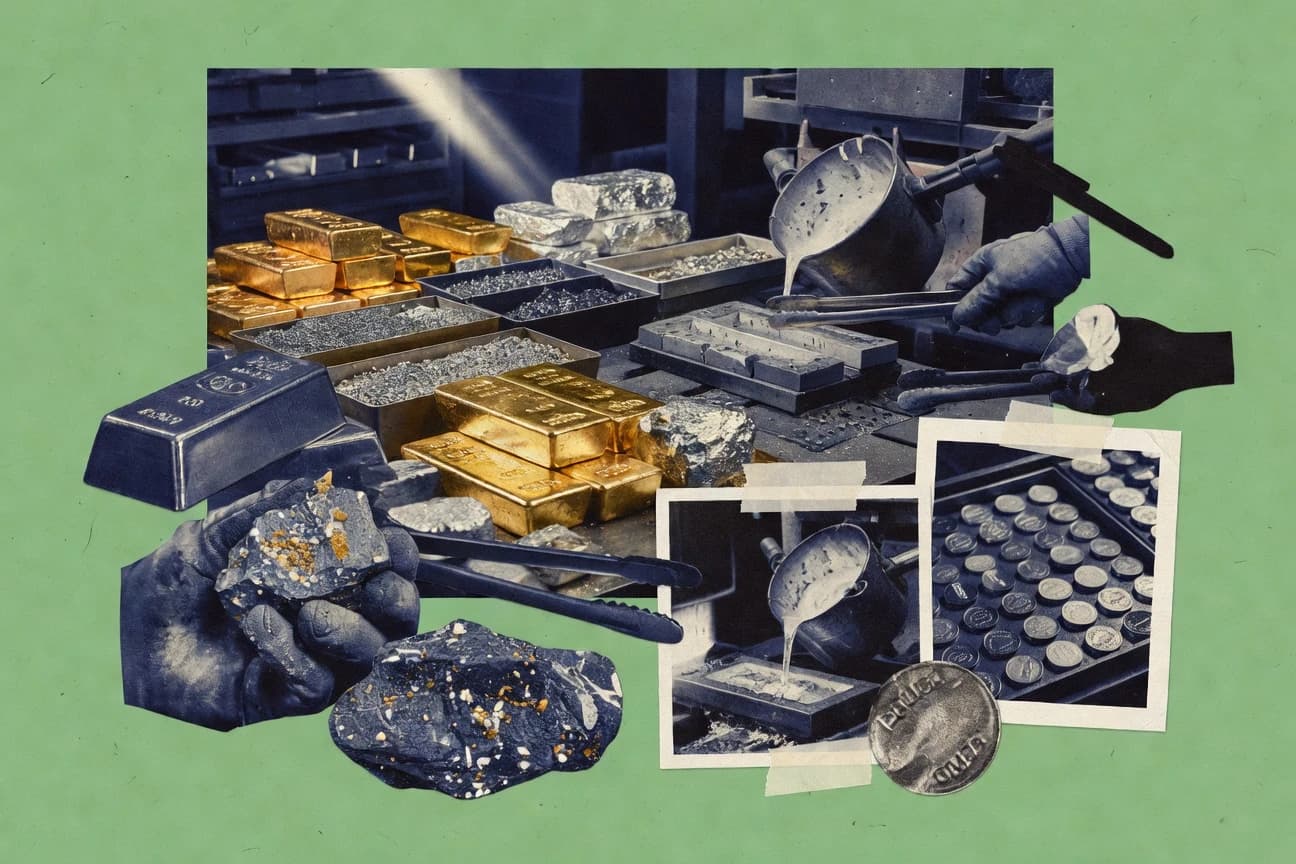
Precious Metals Industry Statistics
Gold reserves reached 1,525 million ounces by end 2023 while primary silver production fell from 2,516 tonnes in 2023 to just 2,489 tonnes the year before, and silver demand split sharply between 650.9 million ounces of industrial use and 208.5 million ounces of investment in 2023. If you want the clearest link between metal prices, supply discipline, and demand behavior, this Precious Metals Industry statistics page brings them into one place, down to 7–10 year project timelines and the cost pressures of mining recovery.
Canadian Steel Industry Statistics
Canada’s steel footprint is quantified right up front with 9.2 million tonnes shipped in 2023 and $24.4 billion in iron and steel mills and ferroalloy sales, even as crude steel production slipped to 8.6 million tonnes. Track how different segments stack up side by side, from $12.7 billion in steelmaking operating revenues to $112.6 billion in fabricated metal shipments, plus the trade squeeze where imports outweigh exports by millions of tonnes.
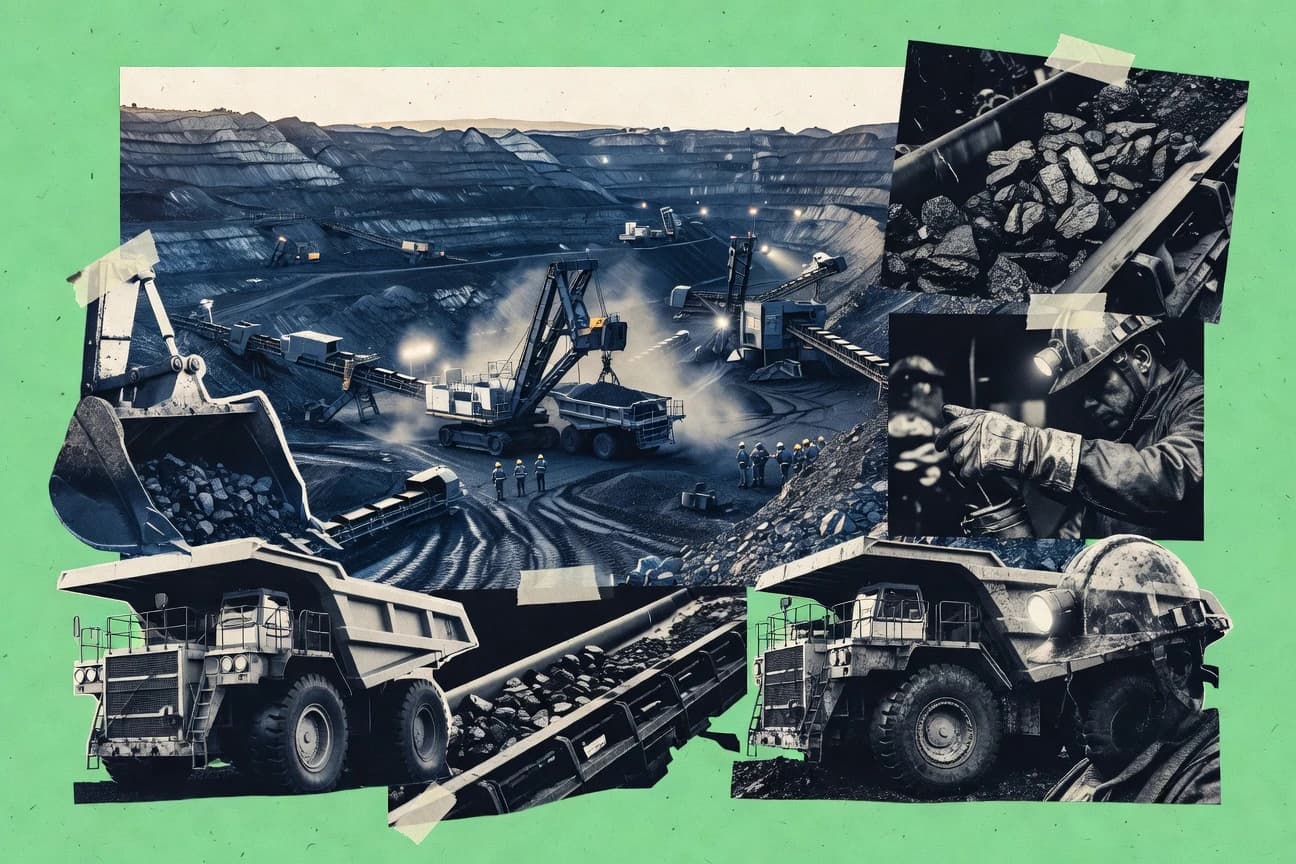
Coal Mining Industry Statistics
China and India are still expanding coal production while the climate math keeps tightening, with coal responsible for 10.0% of direct global CO2 emissions and 7.4% growth in global thermal coal demand. From 2,441 operating coal plants and a 9.3 thousand TWh coal power output forecast for 2023 to where methane slips from mines, this page maps the supply chain, trade, and costs that keep coal central in 2025 research debates.