
Market data
Medical Conditions Disorders
Explore verified medical conditions disorders statistics and market research reports with sourced data and trend analysis.
Latest update:
 Elif Demirci

Cancer Misdiagnosis Statistics
With lung cancer misdiagnosed as pneumonia and thyroid screening overdiagnosis reaching 61 to 90 percent, this page shows how diagnostic errors can quietly shift patients from early treatment to advanced-stage reality and higher mortality, with delayed diagnosis raising death risk by 6 to 8 percent per month. You will also see where the biggest mixups happen across cancers and care settings, plus what reduces errors fastest, from follow-up triggers and AI flagging to checklists and double-reading mammograms.

Hsv Statistics
Primary genital HSV-1 is now up to 50 to 60% of first infections in some US clinics, yet it still recurs far less often than HSV-2, creating a striking contrast between early takeover and long term frequency. From 36% aseptic meningitis in primary genital HSV-2 to 300,000 to 500,000 annual HSV keratitis cases worldwide and the 10 to 20% asymptomatic shedding that fuels spread, this page connects what happens in the body to what the transmission risk actually looks like.

Testicular Cancer Statistics
From the 70 to 90% of diagnoses that begin with a painless lump, to the way “minor” symptoms like dull heaviness, scrotal discomfort, or even gynecomastia can point to tumors producing hCG, this page turns the most telling testicular cancer markers into clear, testable clues. You will also find why reliable diagnosis often hinges on ultrasound vascularity and radical inguinal orchiectomy, plus how staging trends and survival figures help explain why cure rates can exceed 90% even when disease is metastatic.

Autism In Children Statistics
Get the full picture behind autism risk and diagnosis with current US ADDM data that places prevalence at 27.6 per 1,000 eight year olds and pairs it with striking clues from genetics and pregnancy exposures, from valproic acid raising risk about 10-fold to early developmental patterns like speech delays in 70 to 80% and regression for many before diagnosis.

Hep B Statistics
Globally in 2019, 296 million people were living with chronic HBV, and yet the burden is anything but uniform with prevalence running from 5% in the Western Pacific down to 0.8% in Europe. From Africa, where HBV exceeds 8% in parts of the region, to the US with 862,000 people living with chronic infection and 21,600 new cases each year, these statistics show exactly where transmission is still accelerating and where vaccination and screening have changed the odds.
Postpartum Ocd Statistics
Most new mothers get intrusive thoughts, but when Postpartum OCD hits, 91% report violent intrusive thoughts and 85% experience both obsessions and compulsions. With diagnosis delayed by an average of 6 months in 60% and CBT with ERP delivering 75% remission, this page turns those startling patterns into practical, time sensitive takeaways for recognizing and treating harm themed, ego dystonic fears that peak around 3 months postpartum.

Adhd Canada Statistics
ADHD Canada estimates 2.8 million Canadian adults are living with ADHD, and 80% remain undiagnosed even as executive dysfunction hits 70% and unemployment runs 15% higher at 12%. See how the impact reaches beyond symptoms, from 45% reporting relationship strain and 1.8 times higher driving accidents to schooling gaps like 15-20 lower standardized test scores and 32% of ADHD adults completing post secondary.
Lymphoma Statistics
From PET CT staging that detects disease in 90 to 95% of Hodgkin lymphoma to the fact that Reed Sternberg cells appear in 95% of classical HL biopsies, this page connects the symptoms and test findings that matter most. You will also see how risk and survival hinge on details like LDH elevation in 30 to 50% of advanced NHL, and why modern outcomes keep improving, including US 5 year relative survival for NHL rising to 74% in 2020.

Oral Cancer From Dipping Statistics
For dip users, oral cancer risk can reach 50.3 per 100,000 person years after more than 30 years, compared with 5.2 in non users, and quitting before diagnosis improves 5 year survival by 18%. See why the burden is so concentrated in men 40 to 64, rural communities, and high exposure groups such as veterans, miners, and blue collar workers, where the same habit can shift outcomes from treatable lesions to late stage disease.
Renal Cell Carcinoma Statistics
With 81,610 new kidney and renal pelvis cancer diagnoses in the US and about 90% being renal cell carcinoma, this page turns the most revealing RCC facts into a fast clinical picture, from classic triad symptoms that appear in only 10% to “incidental” imaging findings in 50 to 60% of cases. You will also see how paraneoplastic hypercalcemia, anemia, and anemia mimics can stack up, alongside where treatment decisions hinge on modern staging and risk groups.

Strep Throat Statistics
Untreated strep throat can quietly escalate to rheumatic fever in 0.3 to 3 percent of cases, yet antibiotics prevent about 70 percent of acute rheumatic fever in high risk populations. This page connects the rest of the cascade with striking odds including PSGN after 1 to 2 percent of pharyngitis episodes in epidemics and invasive GAS complications that occur in only 3 to 5 times the usual adult risk after pharyngitis, helping you understand what to test for, treat fast, and prevent.
Ringworm Statistics
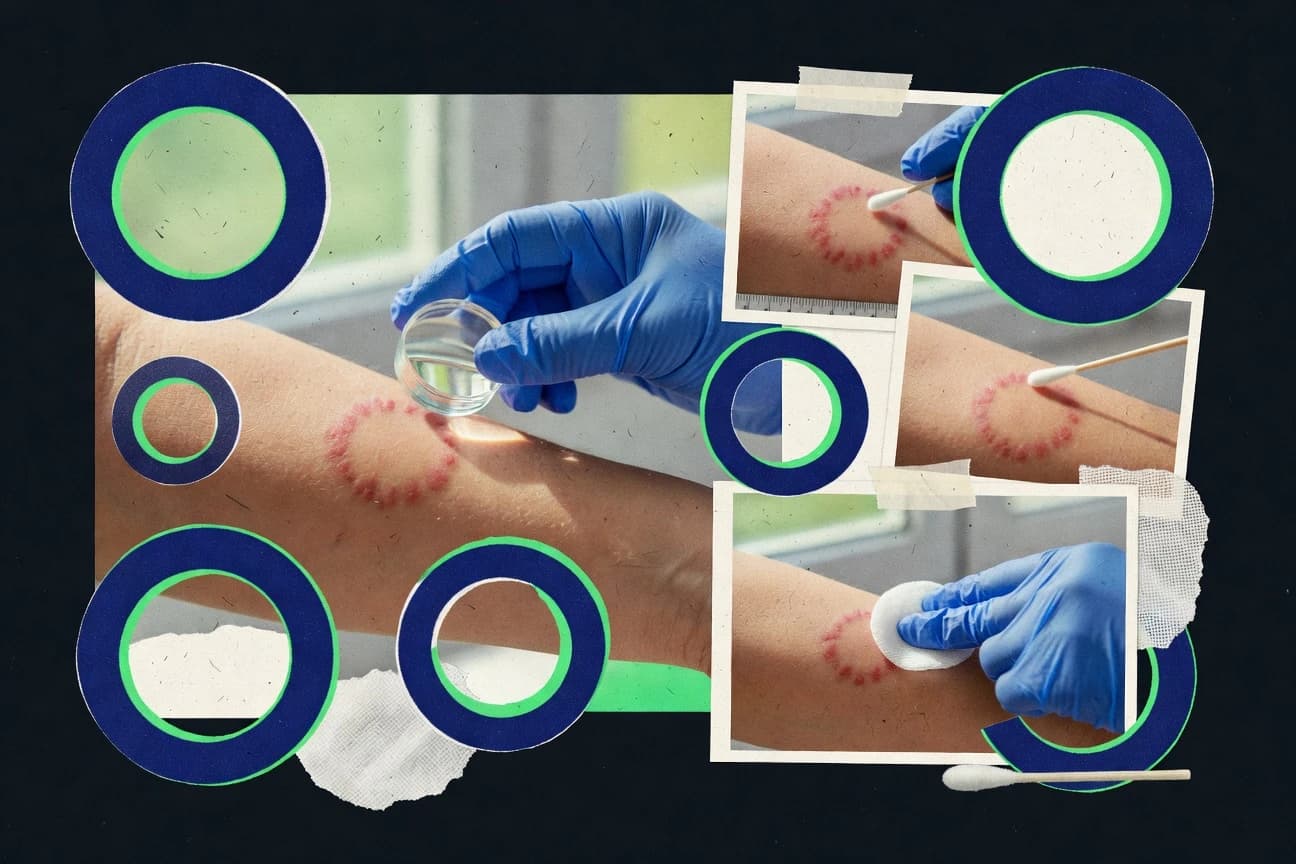
Ringworm can start as tiny red papules and expand into classic patterns like 70% interdigital maceration or 20% tinea capitis kerions, yet what catches clinicians is how often it is misread, with teledermatology misdiagnosing it as eczema in 25% of cases. This 2025 focused stats roundup connects symptom fingerprints, diagnostic test performance, and treatment outcomes so you can separate tinea incognito and moccasin tinea pedis from lookalikes fast.

Male Breast Cancer Statistics
From lumps or nipple inversion that appear in 90% and 15 to 20% of cases to a median diagnostic delay of 6 to 12 months, this up-to-date Male Breast Cancer statistics page helps you spot what is easy to miss and why it matters. You will also see current survival and tumor facts such as 90% of men being diagnosed at stages II to III, mammography sensitivity of 85 to 90%, and 5-year survival dropping from 92% for localized disease to 24% when cancer is distant.

Sudden Adult Death Syndrome Statistics
Sudden Adult Death Syndrome is sharply male skewed across countries, with men making up 65% of UK adult cases aged 16 to 64 and up to 72% of US cases in ages 18 to 35. This page weighs the most recent pattern shifts too, including UK SADS cases rising 12% annually in 2021 to 2023 and the genetics and pathology clues that help explain why some hearts fail without warning.

Pregnancy At 40 Statistics
At age 40, your odds in assisted reproduction can look surprisingly steadier than you expect, with overall assisted reproduction success at about 25 to 30 percent and an autologous IVF live birth rate of 15.3 percent per cycle, then shifting again once you compare transfer, miscarriage, and delivery outcomes. This Pregnancy At 40 statistics page puts the real tension front and center, from lower natural conception rates around 5 percent per menstrual cycle and higher cesarean and postpartum hemorrhage risks to reassuring targets like a 75 to 80 percent term delivery rate with careful monitoring.

Gay Men Hiv Statistics
In 2021, 85% of gay and bisexual men with HIV in the US knew their status, but only 64% of Black MSM were virally suppressed, linked to late diagnosis and unequal access. From PrEP reaching 91,000 infections prevented in the US to UK and EU gaps in late stage diagnoses, this page connects prevention, testing, and treatment coverage so you can see where progress is working and where it still stalls.

Heart Disease In Women Statistics
Heart disease still takes 1 in 3 deaths among women worldwide, and women face sharper penalties after major events including 50% higher post heart attack mortality and 29% 1 year mortality after heart failure diagnosis in women over 65. This page turns those contrasts into action, from why treatment delays raise women’s 30 day mortality by 10% to what prevention can change, including lifestyle shifts that could help make up 80% of heart disease in women preventable.

Postpartum Preeclampsia Statistics
Postpartum preeclampsia is rare but serious, affecting about 3% to 5% of pregnancies globally and showing up with seizures in case series within days to weeks after delivery. Get the practical timing and treatment signals that change outcomes, including WHO advice to check blood pressure no later than 7 to 10 days postpartum, recurrence risk often estimated around 20%, and evidence that remote blood pressure monitoring can cut postpartum readmissions for hypertensive disorders by 25%.

Women Heart Attack Statistics
In the U.S., women make up 53.0% of age adjusted cardiovascular disease deaths and 1 in 5 women who have a heart attack dies, yet they are less likely to get timely, guideline recommended care like reperfusion therapies and aspirin within 24 hours. Women’s symptoms are also more often atypical, including nausea or shortness of breath, which can delay emergency action and shape outcomes, even though cardiac rehab can cut all cause mortality by about 20%.

Hsv1 Statistics
HSV-1 diagnosis can swing from near perfect to misleading, with type-specific gG testing and PCR catching active lesions in 95 to 100 percent while IgM stays unreliable with 30 to 50 percent false positives. You also get the clinical reality checks that matter, including CSF PCR for encephalitis at 98 percent sensitivity and 94 percent specificity and the global snapshot that about 3.7 billion people under 50 carry HSV-1, shaping both testing choices and transmission risk.