Market data
Manufacturing & Engineering
Explore manufacturing & engineering statistics and market research reports with sourced data and trend analysis.
Latest update:
 Ryan Townsend


Statistics · 2026
Crane Industry
Aging fleets mean global crane fleets average 15 years old—discover how that impacts safety, utilization, and the market drivers reshaping crane operations.
Statistics · 2026
Corrugated Industry
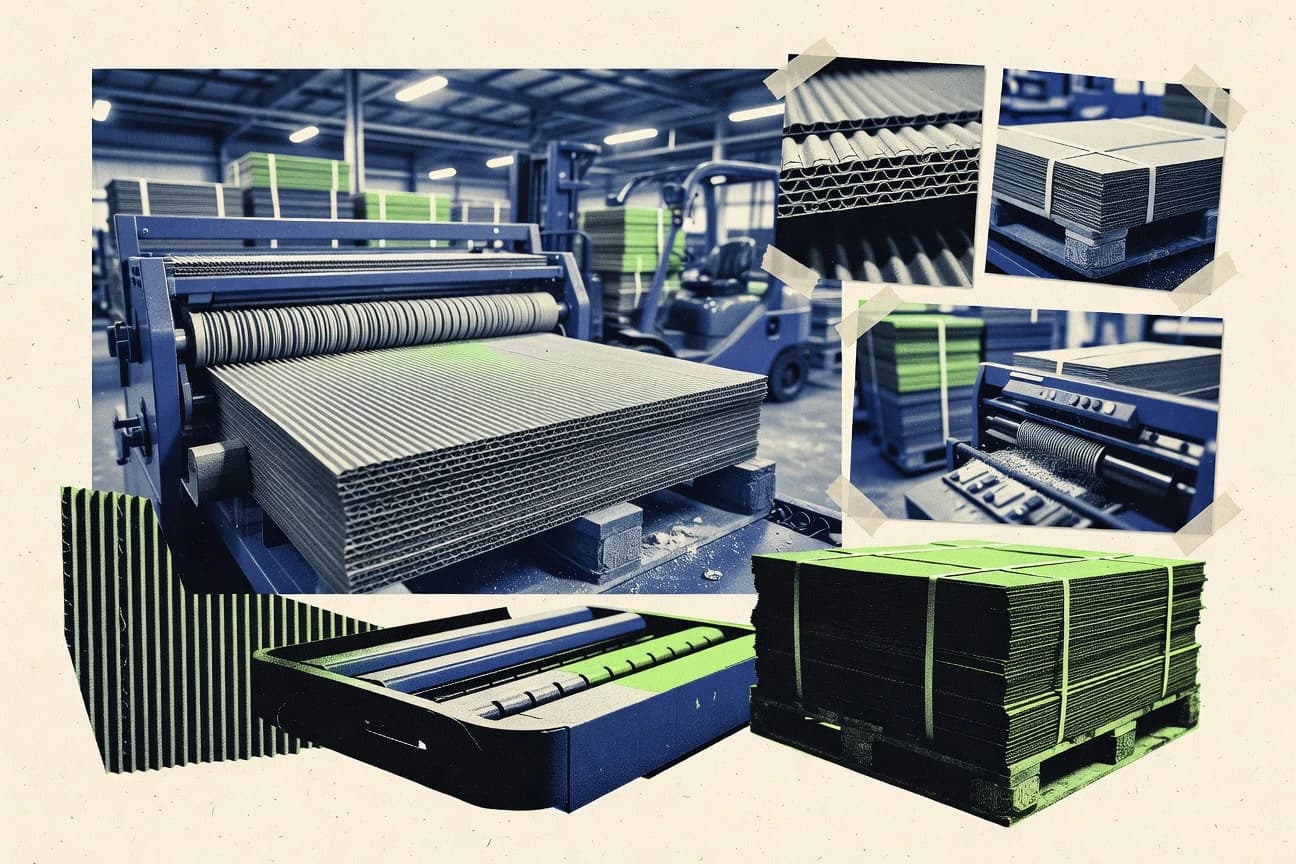
Corrugated Industry statistics make a clear point that production and demand are moving in different directions, with 2026 figures pointing to tightening pressure across the supply chain. If you want to understand where costs, capacity, and customer behavior are headed next, these up to date numbers are the fastest way to see the shift.

Statistics · 2026
Corrugated Cardboard Industry
With the global corrugated packaging market projected to hit a 4.2% CAGR from 2023 to 2030 and the EU pushing paper and cardboard recycling toward an 85% 2030 target, this page connects circularity and profitability with hard inputs like 85% of U.S. corrugated packaging being recovered after use and recycled fiber cutting greenhouse gas emissions by up to 74% versus virgin. You will also see the tradeoffs that matter on the plant floor, from moisture limits for box durability to contamination levels that can drag down recovered fiber yields.

Statistics · 2026
Corrugated Box Industry

Statistics · 2026
Corrosion Industry
See how corrosion pressures are changing fast, with 2026 figures that turn long term assumptions into something more urgent for today’s maintenance and materials decisions. The page contrasts where failures are rising with where mitigation is working, so you can spot the real risks before they show up on the schedule.

Statistics · 2026
Cooling Tower Industry
Cooling towers emitted 120 million tons of CO2e in 2023 from power-plant energy use—see which sectors and technologies drive it.

Statistics · 2026
Cooling Industry
Cooling and refrigeration are already a major electricity load, with refrigeration and air conditioning together at about 7% of global demand, and U.S. commercial cooling taking roughly 60% of summer peak electricity use. This page pairs the latest market scale signals with the practical levers driving change, from variable speed HVAC savings up to 10% to 60% and smart controls reducing cooling energy by 10% to 30% to low GWP transitions shaped by new EU F gas rules.
Statistics · 2026
Conveyor Industry
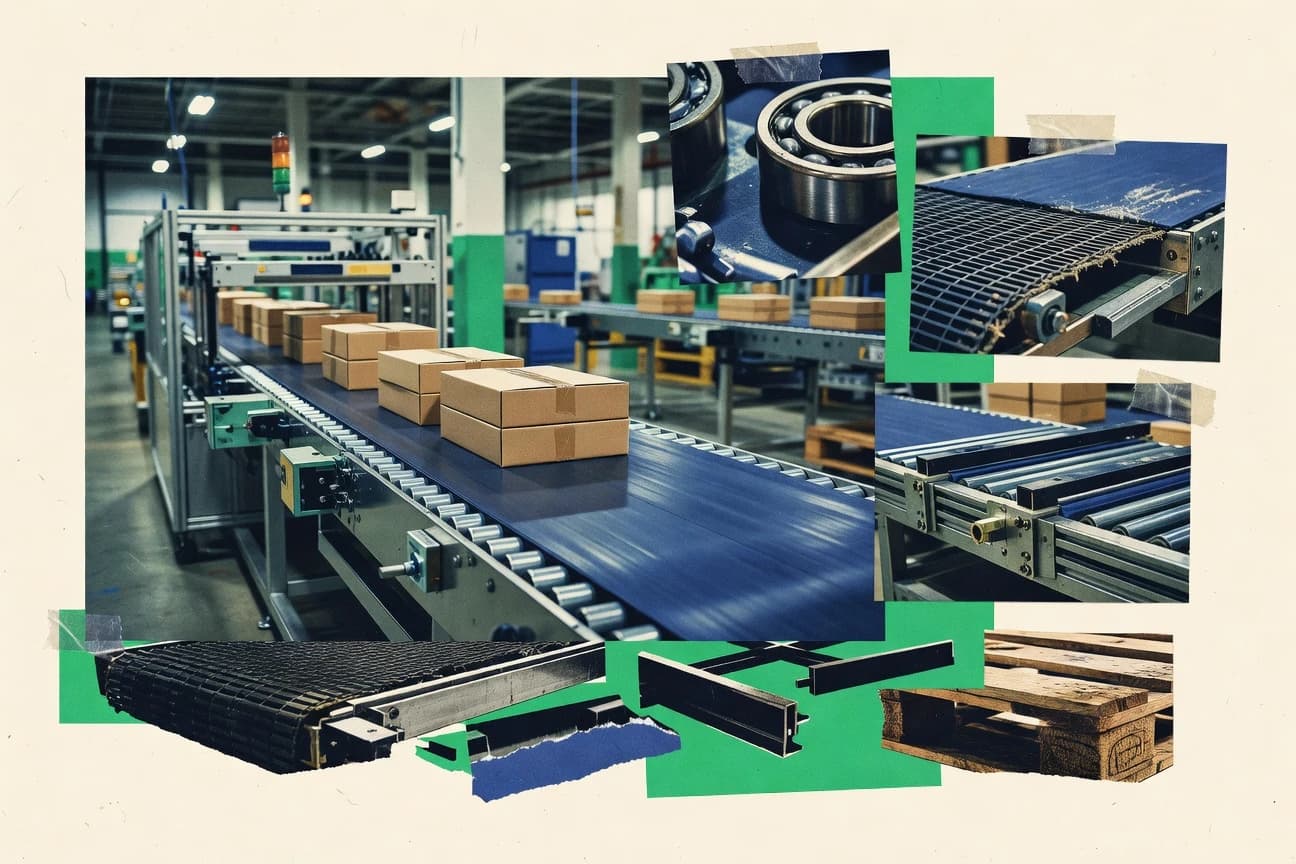
Conveyor Industry statistics show a sharp shift heading into 2025, with operating pressures and adoption patterns changing fast enough to reorder what matters most on every line. Get the concrete figures behind how demand, performance, and investment are moving now, so you can spot what will constrain throughput next and what won’t.

Statistics · 2026
Conveyor Belt Industry
450 million meters of belts were consumed by logistics and warehousing in 2022—see how sectors drive demand and growth.
Statistics · 2026
Container Manufacturing Industry
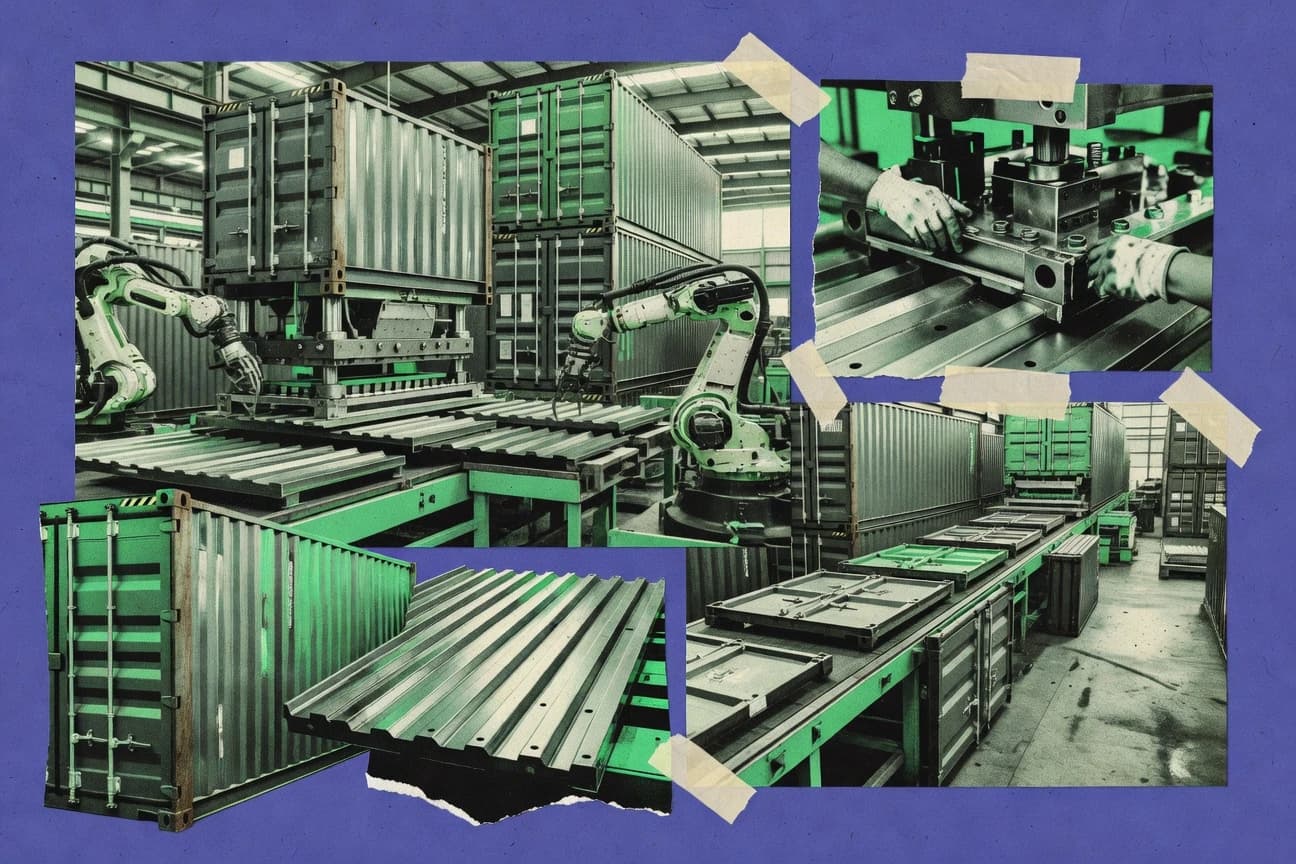
By 2029, the global container manufacturing market is projected to reach $22.0 billion, pulled by ISO container demand where over 90% of containerized cargo moves by sea and new large ships push typical capacity toward the 1,000 to 2,000 TEU range. The page connects that headline growth to what actually drives factory output and costs, from ISO 668 dimensional standards and 60 to 120 micron powder coating specifications to freight rate shifts and the 6 to 10 week lead times that ports and repair cycles can stretch or compress.

Statistics · 2026
Container Glass Industry
A 2023 global glass packaging recycling market at $6.4 billion sits alongside a 75.6% EU glass packaging recycling rate in 2022, so the page pinpoints why cullet supply and furnace economics are inseparable. It connects sharp climate and operational gains such as 10% cullet cutting energy by about 3% and up to 80% less landfill volume with the real-world bottlenecks of contamination, yield losses, and logistics that shape container glass output.

Statistics · 2026
Construction Equipment Industry
Electric and hybrid construction equipment are set to reach USD 25 billion by 2030—explore market stats, adoption signals, and forecasts.

Statistics · 2026
Compressor Industry
With 2025 compressor industry figures showing demand tightening while efficiency expectations keep rising, the gap between what customers want and what manufacturers can deliver is getting sharper. Read the page to see how production, pricing pressure, and adoption trends are moving at the same time, and where that creates both risk and opportunity for operators.

Statistics · 2026
Compressed Air Industry
Compressed air demand is anything but uniform, ranging from 100% oil free needs in semiconductor wafer handling to 15% of the portable air market for jackhammers, while system efficiency still averages only 50 to 60% even as modern VSD tech can reach 85% in 2023. This page maps where compressed air is truly going and what it costs to waste, using hard targets like 35% energy cuts from VSD compressors per DOE studies and 20 to 30% losses from leakage to show where upgrades deliver the fastest payoff.

Statistics · 2026
Coffee Machine Industry
Coffee Machine Industry tracks where demand is surging and who is winning it, from Nespresso’s 28% global brand awareness and Keurig Dr Pepper’s 36% US single serve share to De’Longhi’s 22% lead in European bean to cup. You will also see how buyers are changing habits and expectations, with 65% of US millennials owning machines and 78% of Gen Z prioritizing app connected features, alongside a market projected to reach USD 22.3 billion by 2030.

Statistics · 2026
Coding And Marking Industry
Barcode scanning errors can cost organizations billions—see the data on coding and marking growth through 2030.

Statistics · 2026
Co Packing Industry
Contract packaging is still scaling fast, with the market projected to reach USD 644.2 billion by 2030 alongside pharma CDMO revenues of USD 36.0 billion by 2032 and a growing need for better traceability and serialization as compliance tightens. Use these signals to pressure test your co-packing capacity and quality systems, especially as 79% of US shoppers want sustainable products and supply chain disruptions have driven demand for visibility, from EPCIS event level tracking to cost pressures that make timing and accuracy non negotiable.

Statistics · 2026
Cnc Woodworking Industry
Global machine tool spending hit $98.6B in 2023—how that translates into CNC woodworking demand, investment, and production trends.

Statistics · 2026
Cnc Router Industry
Woodworking used 45% of CNC router capacity in 2023—see how segments, regions, and tech trends are reshaping demand.

Statistics · 2026
Cnc Manufacturing Industry
CNC machinist uptime reached 92% in 2023 (up from 88% in 2020) thanks to IoT—what’s changing across the CNC industry now?