
The annual global cost of corrosion is estimated at USD 2.5 trillion, about 3.4% of global GDP. In the United States alone, corrosion costs reach USD 276 billion, with highway bridge corrosion driving an estimated USD 8.3 billion per year in maintenance. These sector-by-sector gaps show where metal loss accelerates and where monitoring and standards may be falling behind.
Key Takeaways
- Annual global cost of corrosion estimated at USD 2.5 trillion, or 3.4% of global GDP in 2016
- 60% of global oil production uses corrosion inhibitors dosed at 10-50 ppm
- Oil and gas industry in North America sees 28% of corrosion in downstream refining
- The global corrosion inhibitors market size was valued at USD 4.12 billion in 2023 and is expected to grow at a CAGR of 5.1% from 2024 to 2030
- Impressed current cathodic protection systems used in 60% of new pipelines
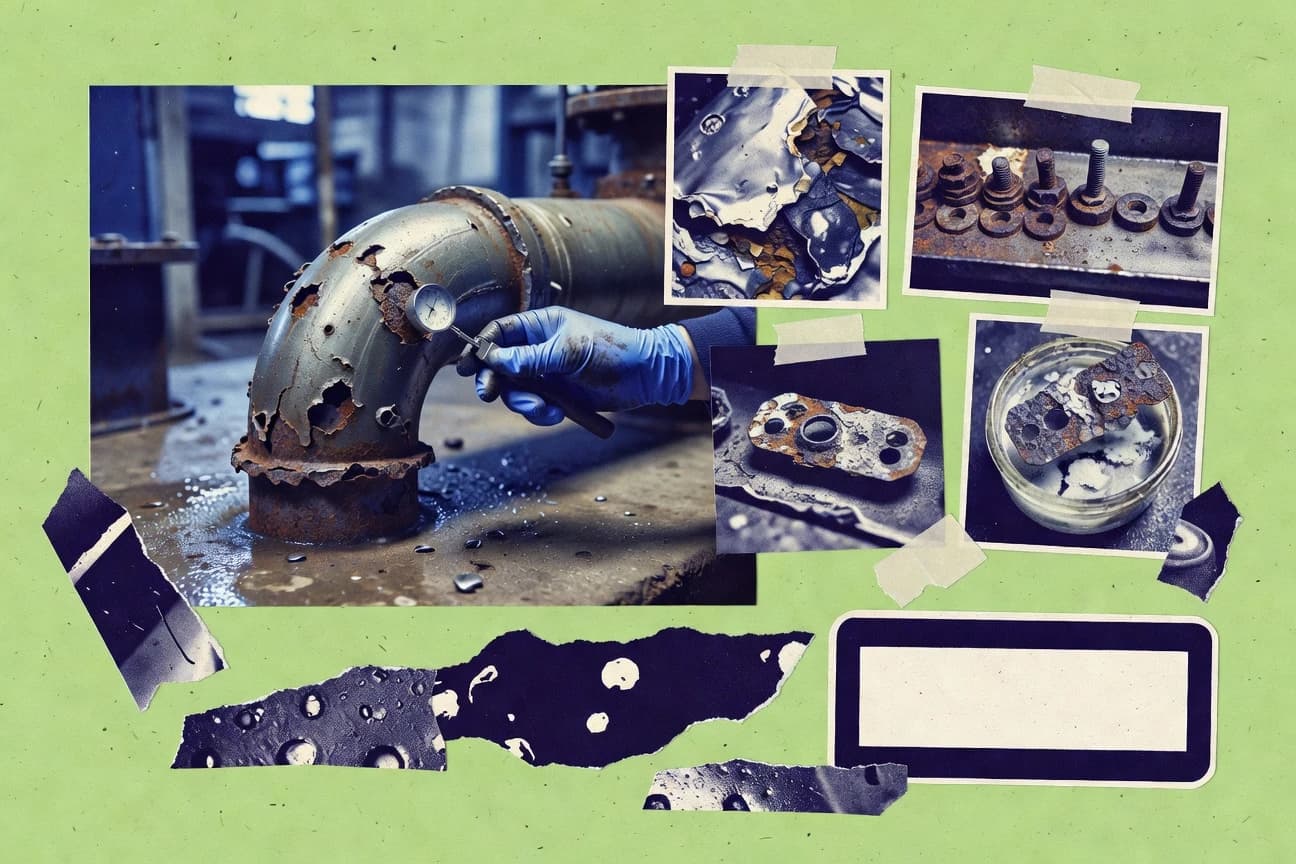
Corrosion costs industries billions each year, making prevention a top priority for global asset protection.
Related reading
01 · Category
Corrosion Costs And Economic Impact30 stats
01
Annual global cost of corrosion estimated at USD 2.5 trillion, or 3.4% of global GDP in 2016
02
U.S. annual corrosion cost USD 276 billion in 1998, equivalent to 3.1% of GDP
03
India corrosion costs industry USD 100 billion annually, representing 3-4% of GDP
04
China corrosion economic loss CNY 2 trillion per year, about 3.34% of GDP as of 2020
05
European Union corrosion costs EUR 250-300 billion annually, 3-4% of GDP
06
Oil and gas sector global corrosion costs USD 1.4 billion per day in 2019
07
U.S. highway bridge corrosion costs USD 8.3 billion yearly due to maintenance
08
Global shipping industry corrosion-related losses USD 20-30 billion annually
09
Australian corrosion cost AUD 24 billion per year, 2.6% of GDP in recent study
10
Brazilian infrastructure corrosion damage BRL 50 billion annually
11
UK annual corrosion cost GBP 60 billion, impacting productivity
12
Saudi Arabia oil infrastructure corrosion costs SAR 15 billion yearly
13
Global water and wastewater corrosion losses USD 50 billion per year
14
U.S. military equipment corrosion costs USD 20 billion annually
15
Japan industrial corrosion economic impact JPY 7.3 trillion yearly, 1.2% GDP
16
Russia pipeline corrosion losses RUB 500 billion annually
17
South Africa mining sector corrosion costs ZAR 20 billion per year
18
Global aviation corrosion maintenance costs USD 2.5 billion yearly
19
Canada infrastructure corrosion USD 10 billion CAD annually
20
Nigeria refinery corrosion shutdown costs USD 1 billion in 2019 alone
21
Germany manufacturing corrosion losses EUR 20 billion per year
22
Power plants worldwide corrosion-induced downtime costs USD 15 billion annually
23
U.S. pulp and paper industry corrosion USD 1.8 billion yearly
24
Global pharma equipment corrosion losses USD 3 billion per year
25
France nuclear power corrosion management costs EUR 500 million annually
26
Indonesia oil & gas corrosion USD 500 million yearly losses
27
Automotive industry global corrosion paint failures USD 10 billion annually
28
Highways in India corrosion repair costs INR 500 billion per year
29
Global electronics PCB corrosion losses USD 5 billion yearly
30
U.K. rail network corrosion maintenance GBP 1 billion annually
Interpretation
Corrosion Costs And Economic Impact Interpretation
Across major economies, corrosion is a persistent economic drain, costing about 2.5 trillion globally in 2016 and typically around 3.1 to 3.4% of GDP in countries like the US, China, and the EU, with the oil and gas sector alone losing roughly 1.4 billion per day in 2019.
02 · Category
Environmental And Regulatory Statistics20 stats
01
60% of global oil production uses corrosion inhibitors dosed at 10-50 ppm
02
EPA regulates 150+ chemicals as potential corrosion byproducts in water
03
IMO ballast water management requires corrosion-resistant coatings since 2024
04
EU REACH restricts 20 chromate compounds used in corrosion primers
05
OSHA records 500+ corrosion-related incidents in U.S. manufacturing yearly
06
NACE SP0169 standard adopted by 80% pipelines for control of external corrosion
07
Global VOC emissions from coatings reduced 40% since 2000 regulations
08
API 571 damage mechanisms include 15 corrosion types for refineries
09
ISO 12944 classifies corrosive environments C1 to CX5 for coating selection
10
PHMSA reports 20% pipeline incidents from corrosion annually in U.S.
11
EU RoHS directive bans lead in 95% corrosion solder alloys since 2006
12
China GB/T 19288 standard for cathodic protection on 70% buried pipelines
13
50 million tons CO2 equivalent saved yearly by corrosion prevention globally
14
ASTM G31 immersion test used in 90% lab corrosion rate validations
15
Australia AS 2312 specifies 8 durability categories for steel coatings
16
30% reduction in H2S corrosion mandated by NORSOK M-001 offshore
17
U.S. Clean Water Act limits copper corrosion products to 1.3 mg/L
18
SSPC-VIS 2 visual standards used in 75% coating inspections worldwide
19
Brazil ABNT NBR 7500 regulates fuel storage tank corrosion protection
20
85% renewable energy structures require CX4 coating per ISO 12944
Interpretation
Environmental And Regulatory Statistics Interpretation
Regulatory and environmental pressure is intensifying for corrosion control, as shown by EPA oversight of 150+ potential corrosion byproduct chemicals in water and EU REACH restricting 20 chromate compounds in primers while new IMO requirements for corrosion-resistant coatings take effect in 2024.
03 · Category
Industry Applications By Sector30 stats
01
Oil and gas industry in North America sees 28% of corrosion in downstream refining
02
Marine sector uses 35% epoxy-based coatings for corrosion protection on ships
03
Power plants boilers suffer 50% corrosion failures from water chemistry issues
04
Automotive industry applies 15-20 microns average zinc phosphate primer for corrosion resistance
05
Oil pipelines employ impressed current cathodic protection in 70% of installations
06
Construction rebar epoxy coating covers 40% market share in corrosion prevention
07
Aerospace aluminum alloys like 7075-T6 require chromate primers in 80% applications
08
Water treatment plants use polyphosphate inhibitors in 60% of systems
09
Chemical plants stainless steel 316L used in 55% of corrosive environments
10
Offshore platforms galvanic anodes protect 90% of submerged structures
11
Railways use zinc-rich primers on 65% of steel bridges for corrosion control
12
Pulp and paper digesters lined with titanium in 75% high-corrosive mills
13
Nuclear plants employ Alloy 690 for steam generators in 85% PWRs
14
Wind farms monopile foundations use sacrificial anodes in 95% cases
15
Food processing tanks use 304 stainless steel in 70% acidic environments
16
Mining equipment abrasion-resistant coatings applied to 50% of slurry pumps
17
Pharmaceuticals use Hastelloy C-276 for 60% of reactor vessels
18
Bridges in coastal areas require 3-coat paint systems in 80% designs
19
Refineries hydrocrackers use clad CS with Alloy 625 in 90% internals
20
Electronics enclosures use conformal coatings on 40% PCBs in harsh environments
21
Oil storage tanks 80% protected by internal linings like epoxy phenolic
22
Solar panel frames use anodized aluminum in 75% installations for corrosion resistance
23
Breweries fermentation tanks electropolished SS304 in 85% setups
24
LNG terminals cryogenic steels like 9% Ni used in 100% storage tanks
25
Highways guardrails hot-dip galvanized with 85 microns zinc in 90% U.S. specs
26
Desalination plants use Duplex SS2205 in 70% reverse osmosis pipes
27
Cement kilns refractory linings with anti-wetting agents in 60% operations
28
Textile dyeing vats titanium heat exchangers in 50% high-acid processes
29
Data centers cooling towers FRP composites in 65% corrosion-prone areas
30
Fertilizer plants urea reactors with 316LUG in 80% modern plants
Interpretation
Industry Applications By Sector Interpretation
Across industry applications, corrosion prevention is sector specific and heavily concentrated in the biggest risk areas, with downstream refining accounting for 28% of corrosion in North America, power plant boiler failures reaching 50% due to water chemistry issues, and construction rebar epoxy coatings leading with a 40% market share.
More related reading
04 · Category
Market Size And Forecasts29 stats
01
The global corrosion inhibitors market size was valued at USD 4.12 billion in 2023 and is expected to grow at a CAGR of 5.1% from 2024 to 2030
02
The corrosion protection coatings market was valued at USD 18.5 billion in 2022 and projected to reach USD 25.6 billion by 2028 at a CAGR of 5.6%
03
North American corrosion monitoring market size stood at USD 1.2 billion in 2023, expected to grow to USD 1.8 billion by 2030 at 6% CAGR
04
Asia-Pacific corrosion protection market valued at USD 10.4 billion in 2022, forecasted to hit USD 15.7 billion by 2027 at 8.5% CAGR
05
Global cathodic protection market size was USD 6.8 billion in 2023, projected to reach USD 9.5 billion by 2030 with 4.8% CAGR
06
European corrosion inhibitors market estimated at EUR 1.1 billion in 2023, growing at 4.2% CAGR to 2029
07
U.S. corrosion protection chemicals market reached USD 2.3 billion in 2022, expected CAGR of 5.3% through 2030
08
Middle East & Africa corrosion monitoring systems market size USD 450 million in 2023, to USD 680 million by 2028 at 7.1% CAGR
09
Global corrosion-resistant alloys market valued at USD 7.9 billion in 2023, projected 6.2% CAGR to USD 11.8 billion by 2030
10
Latin America corrosion protection coatings market at USD 1.5 billion in 2022, growing to USD 2.2 billion by 2027 at 7.8% CAGR
11
India corrosion inhibitors market size USD 250 million in 2023, expected to reach USD 380 million by 2029 at 7.2% CAGR
12
China cathodic protection market valued at CNY 5.2 billion in 2022, forecasted 5.9% CAGR to 2028
13
Global pipeline corrosion protection market USD 4.7 billion in 2023, to USD 6.9 billion by 2030 at 5.5% CAGR
14
South Korea corrosion monitoring market size USD 180 million in 2023, growing at 6.4% CAGR to 2030
15
Australia & New Zealand corrosion protection chemicals market USD 420 million in 2022, projected 4.9% CAGR to 2028
16
Global marine corrosion protection market valued at USD 3.2 billion in 2023, expected 5.7% CAGR to USD 4.8 billion by 2030
17
Brazil oil & gas corrosion inhibitors market USD 150 million in 2023, to USD 220 million by 2029 at 6.5% CAGR
18
Russia corrosion-resistant materials market size RUB 120 billion in 2022, growing 4.3% CAGR to 2028
19
Southeast Asia corrosion coatings market USD 800 million in 2023, projected 7.0% CAGR to 2030
20
Global water treatment corrosion control market USD 2.1 billion in 2022, to USD 3.0 billion by 2028 at 5.2% CAGR
21
Saudi Arabia cathodic protection systems market USD 350 million in 2023, expected 6.8% CAGR to 2029
22
UAE corrosion monitoring market size AED 450 million in 2022, growing at 5.9% CAGR to 2028
23
Canada pipeline integrity management market including corrosion USD 1.1 billion in 2023, to USD 1.6 billion by 2030
24
Japan industrial coatings for corrosion protection market JPY 250 billion in 2023, 4.7% CAGR forecasted
25
Global aerospace corrosion protection market USD 1.8 billion in 2022, projected 6.1% CAGR to 2030
26
Mexico automotive corrosion inhibitors market USD 90 million in 2023, to USD 140 million by 2029 at 7.5% CAGR
27
Turkey construction corrosion protection market TRY 2.5 billion in 2022, growing 5.4% CAGR
28
Global power generation corrosion control market USD 5.4 billion in 2023, expected 4.9% CAGR to 2030
29
Nigeria oilfield corrosion management market USD 120 million in 2023, 6.2% CAGR to 2028
Interpretation
Market Size And Forecasts Interpretation
In the Market Size And Forecasts outlook for corrosion industries, strong growth is evident across segments, such as the global corrosion protection coatings market rising from USD 18.5 billion in 2022 to USD 25.6 billion by 2028 at a CAGR of about 5 percent.
05 · Category
Technologies And Products30 stats
01
Impressed current cathodic protection systems used in 60% of new pipelines
02
Epoxy intumescent coatings provide 120 minutes fire resistance in 70% industrial uses
03
Linear polarization resistance (LPR) sensors deployed in 50% real-time monitoring setups
04
Nano-ceramic coatings offer 10x abrasion resistance over traditional epoxies
05
Sacrificial magnesium anodes last 15-20 years in seawater applications
06
Electrochemical noise (ECN) technique detects pitting corrosion early in 80% lab tests
07
Polyurea spray coatings cure in 5 seconds for rapid corrosion protection
08
Wireless corrosion sensors reduce inspection costs by 40% in oil & gas
09
Duplex stainless steels like 2205 have PREN >35 for chloride resistance
10
Vapor phase inhibitors (VPI) protect 95% void spaces in packaged equipment
11
Ultrasonic thickness gauging used in 75% pipeline integrity assessments
12
Sol-gel coatings on aluminum provide 2000+ hours salt spray resistance
13
Bio-based corrosion inhibitors from plant extracts show 90% efficiency vs. synthetics
14
Pulsed current cathodic protection reduces power consumption by 30%
15
Fiber optic corrosion sensors monitor pH and strain in real-time
16
Fluoropolymer coatings like PTFE withstand 260°C continuous service
17
Electrical resistance (ER) probes detect metal loss at 1 mil/year sensitivity
18
Self-healing polymers with microcapsules repair 70% scratch damage autonomously
19
AC interference mitigation systems protect 85% of pipelines near power lines
20
Titanium thermal spray coatings achieve 99.9% purity for marine use
21
Hydrogen-induced cracking prevented by sulfide stress cracking resistant alloys
22
Robotic coating applicators increase efficiency by 50% in tank internals
23
Corrosion under insulation (CUI) detected by pulsed eddy current in 90% cases
24
Graphene oxide composites enhance coating barrier properties by 300%
25
Digital twins for corrosion prediction reduce failures by 25% in refineries
26
Alkaline zinc phosphate primers provide 1000 hours salt spray protection
27
Field signature method (FSM) monitors 100% pipeline girth welds non-intrusively
28
Silane-based pretreatments replace chromates with 95% efficacy on steel
29
AI-driven corrosion forecasting models predict rates with 92% accuracy
30
High-velocity oxy-fuel (HVOF) WC-Co coatings have <0.1 mm/year wear rate
Interpretation
Technologies And Products Interpretation
Under the Technologies and Products category, adoption is strongly product driven as impressed current cathodic protection is used in 60% of new pipelines and nano-ceramic coatings deliver 10x abrasion resistance, showing a clear shift toward more advanced, longer lasting corrosion protection and monitoring solutions.
report visual · Breakdown
Corrosion’s scale: global cost vs. share of GDP
Corrosion costs reach trillions globally and remain a persistent economic burden—measured as a meaningful share of GDP across major economies.
25%
Production and manufacturing corrosion costs 25% of total in Europe
75%
SSPC-VIS 2 visual standards used in 75% coating inspections worldwide
Reference
Cite This Report
This report is designed to be cited. We maintain stable URLs and versioned verification dates. Copy the format appropriate for your publication below.
APA
Daniel Varga. (2026, February 13). Corrosion Industry Statistics. Gitnux. https://gitnux.org/corrosion-industry-statistics
MLA
Daniel Varga. "Corrosion Industry Statistics." Gitnux, 13 Feb 2026, https://gitnux.org/corrosion-industry-statistics.
Chicago
Daniel Varga. 2026. "Corrosion Industry Statistics." Gitnux. https://gitnux.org/corrosion-industry-statistics.
Sources & references
100 datasets cited across this report · attribution is report-level