Market data
Food & Nutrition
Explore food & nutrition statistics and market research reports with sourced data and trend analysis.
Latest update:
 Yumi Nakamura


Statistics · 2026
Mineral Water Industry
See how mineral water brands are reshaping volume and value swings with the 2026 numbers, where growth and pricing pressures collide. You will get the specific industry metrics behind changing demand, consumption patterns, and the market’s momentum, so you can spot what is driving the next shift.

Statistics · 2026
Non Alcoholic Spirits Industry

Statistics · 2026
Metal Detector Food Industry
Statistics · 2026
Cottage Cheese Industry

Statistics · 2026
Tinned Fish Industry

Statistics · 2026
Protein Coffee Industry

Statistics · 2026
Prebiotic Soda Industry
Statistics · 2026
Meat Snacks Industry
Get the latest Meat Snacks Industry stats that show where demand is accelerating and what’s pressuring margins, with 2026 figures highlighting the sharp shift from growth talk to buying behavior. You’ll see how changing tastes and supply realities are reshaping sales, so the next decision makers make in this category is grounded in what consumers are actually reaching for.

Statistics · 2026
Meal Prep Industry
In 2022, HelloFresh alone reached 25% US market share, while Factor’s ready to eat push surged 40% to 500K weekly boxes and the global meal prep and meal kit delivery market keeps climbing at a 14.2% CAGR through 2028. See how shoppers balance macro goals like 82% low carb and 65% high protein with practical decisions such as a 48% urban time crunch and 85% of EU kits arriving in recyclable compostable materials.

Statistics · 2026
Matcha Industry
Matcha Industry’s 2026 snapshot shows how quickly production, demand, and pricing signals are shifting at once, not in isolation. If you’ve been tracking matcha by volume alone, these statistics will challenge that comfort zone with the kind of current numbers that change purchasing and forecasting decisions.

Statistics · 2026
Maple Syrup Industry
From 40 percent e commerce growth to $180 million in imports valued from Canada, the 2025 update tracks how maple keeps outpacing expectations while pure syrup still commands a steep premium, with global retail market growth projected at 5.2 percent CAGR to 2030. Expect sharp contrasts like breakfast using 60 percent of maple sold and pure versus pancake, plus production realities from Quebec’s 175 million pounds to the Northeast states holding 70 percent of US consumption.
Statistics · 2026
Malting Industry
With 2026 malting industry statistics showing how supply pressures and brewing demand are moving in different directions, the gap between what malt makers can source and what brewers need is getting sharper. This page pulls out the clearest signals behind volume, costs, and production so you can spot the shift before it becomes the next bottleneck.
Statistics · 2026
Malt Industry
Beer’s 78% share makes it the biggest force in the $18.5B global malt market (2023). Explore the data behind consumption, production, and exports.
Statistics · 2026
Hot Honey Industry
Statistics · 2026
Hop Water Industry

Statistics · 2026
Functional Gummies Industry
Statistics · 2026
Freeze Dried Candy Industry
Statistics · 2026
Bone Broth Industry
Statistics · 2026
Jerky Industry
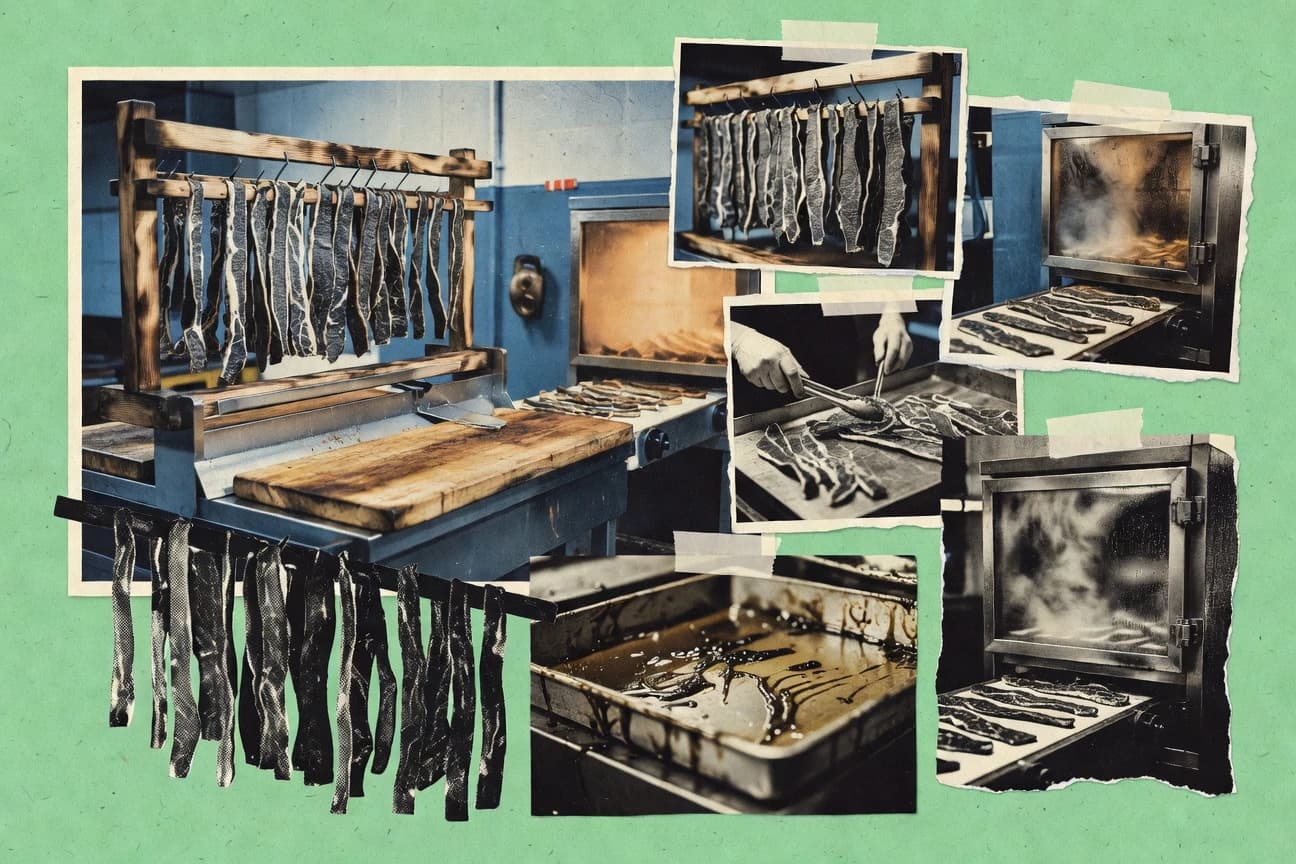
Jerky is still a volume play with momentum, including a 1.9% average annual U.S. retail growth rate for meat snacks from 2019 to 2023 and a $2.2 billion jerky market estimate for 2022, even as pricing pressure and shipping costs push brands to rethink ingredients, claims, and shelf strategy. Get the jerky specific signals behind demand and regulation at once, from protein and sodium claim thresholds to the manufacturing footprint and food safety rules that shape what can hit the rack.
Statistics · 2026
Instant Noodles Industry
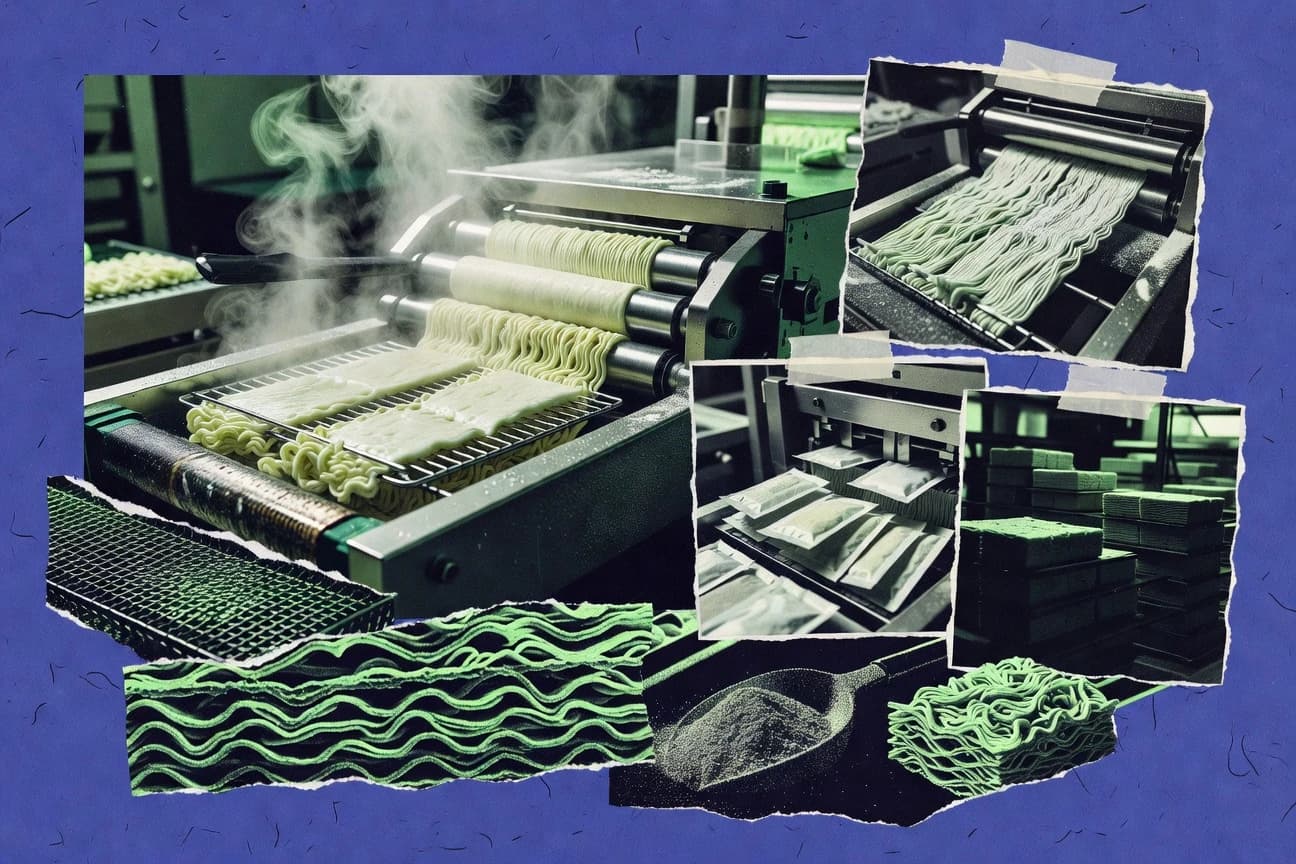
From a USD 72.7 billion instant noodles market forecast for 2030 to Korea leading with 74.0 servings per person per year, this page connects demand intensity with hard export and import flows from major HS 1902.30 players. You will also see what global cost pressures such as the 2023 Henry Hub natural gas average of about USD 2.47 per MMBtu and the FAO Food Price Index average of 122.4 were doing to the economics behind everyday bowls.