GITNUX MARKETDATA
Browse Our Category
Events Holidays
Latest update:


Spring Break Statistics
Spring break traffic and travel demand collide with safety realities, from 34% of US traffic deaths involving speeding and 29% involving alcohol impaired driving to seat belts at 90% and still thousands of unbelted and distracted losses. Pair that with how 2024 hotel and airfare peak weeks shape who gets stranded and who gets there, including TSA surges above 3.0 million screened on multiple April days, and you have a clear snapshot of what changes during spring travel week and what never should.
Earth Day Statistics
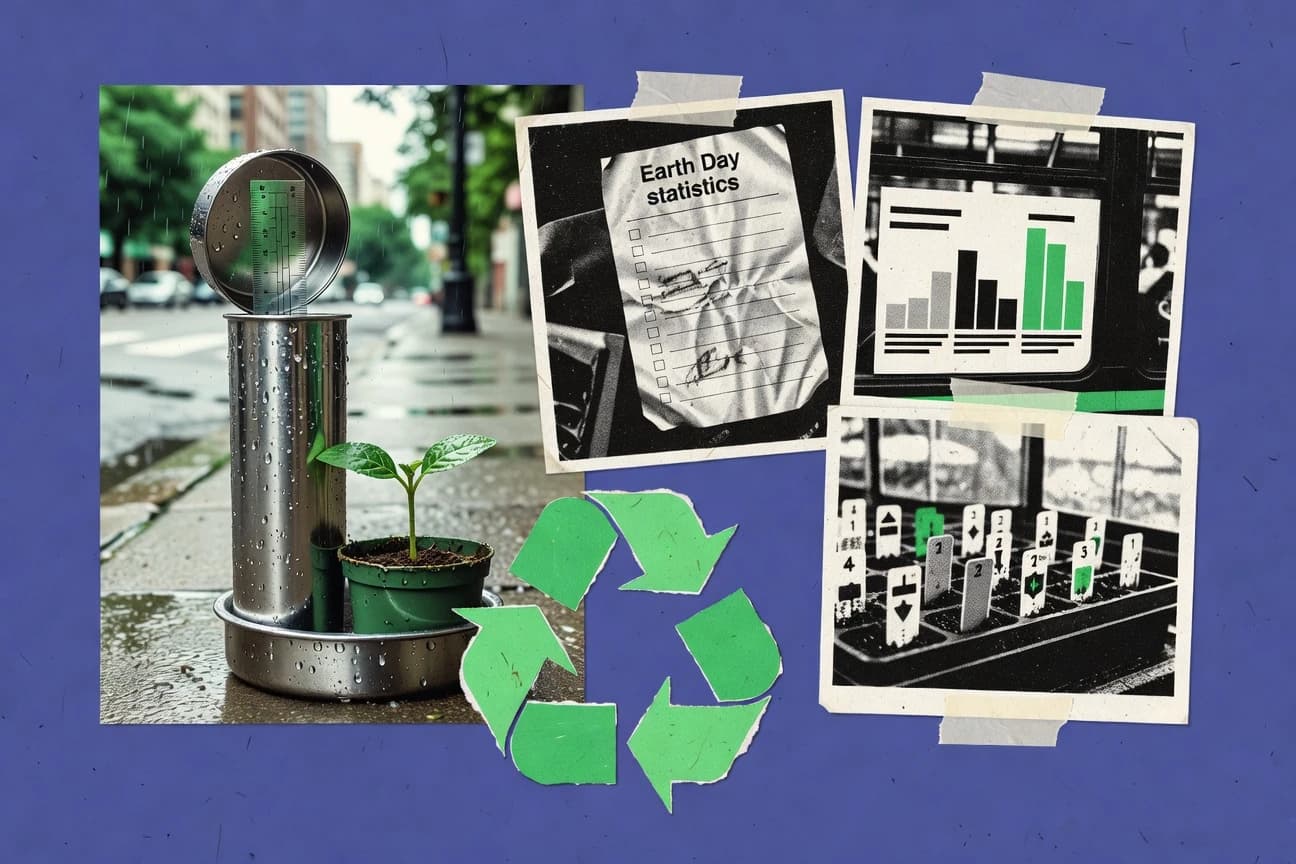
Earth Day began with 20 million Americans in 1970 and has since grown into a global mobilization, with today’s most urgent figures showing what we are still up against. From fossil fuel emissions and record greenhouse gas highs to plastic pollution and water and sanitation gaps, this page connects Earth Day themes and participation trends to the latest pressures on people and the planet.
Thanksgiving Statistics
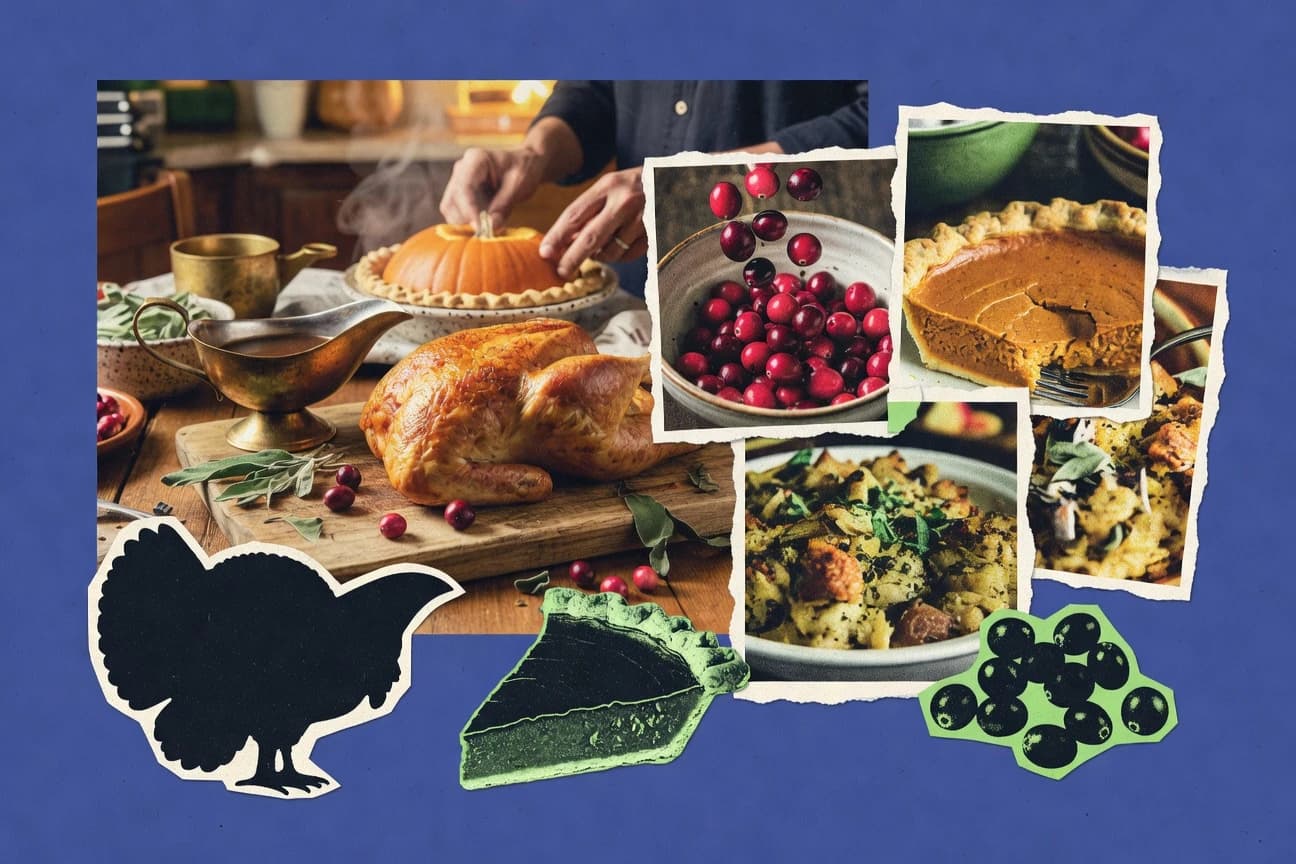
From $70.2 per week for U.S. household food at home and a 9.4 million traveler security surge on the Thanksgiving peak day to 165°F turkey safety and the 2 hour rule for perishable foods, this page ties the holiday shopping rush to the food safety moments that matter. You will also see why beverages, produce, and desserts are trending in 2023 menus, how weather in the 40 to 55°F range shapes last minute buying, and what foodborne illness risk looks like when you stack norovirus, campylobacter, and leftover handling together.

Holiday Statistics
From record Cyber Week and Black Friday volumes to a mobile surge that still leaves conversions and checkout times vulnerable, the holiday statistics page maps how shoppers actually behaved when the pressure hit. You will also see why fraud claims scale during peak weeks, alongside the operational realities of mail and shipping capacity, so you can separate festive momentum from hidden risk.

Singles Day Statistics
Singles Day 2023 momentum is still obvious in the sharpest shifts, from Alibaba GMV up 8.5 percent YoY and JD.com’s 18 percent sales growth to mobile orders rising from 70 percent to 90 percent and AI recommendations lifting conversion by 15 percent. You will also see how cross border demand, live commerce, and faster logistics rewired the peak experience, right down to 9.6 billion total orders and 5 percent refunds.
Halloween Candy Statistics
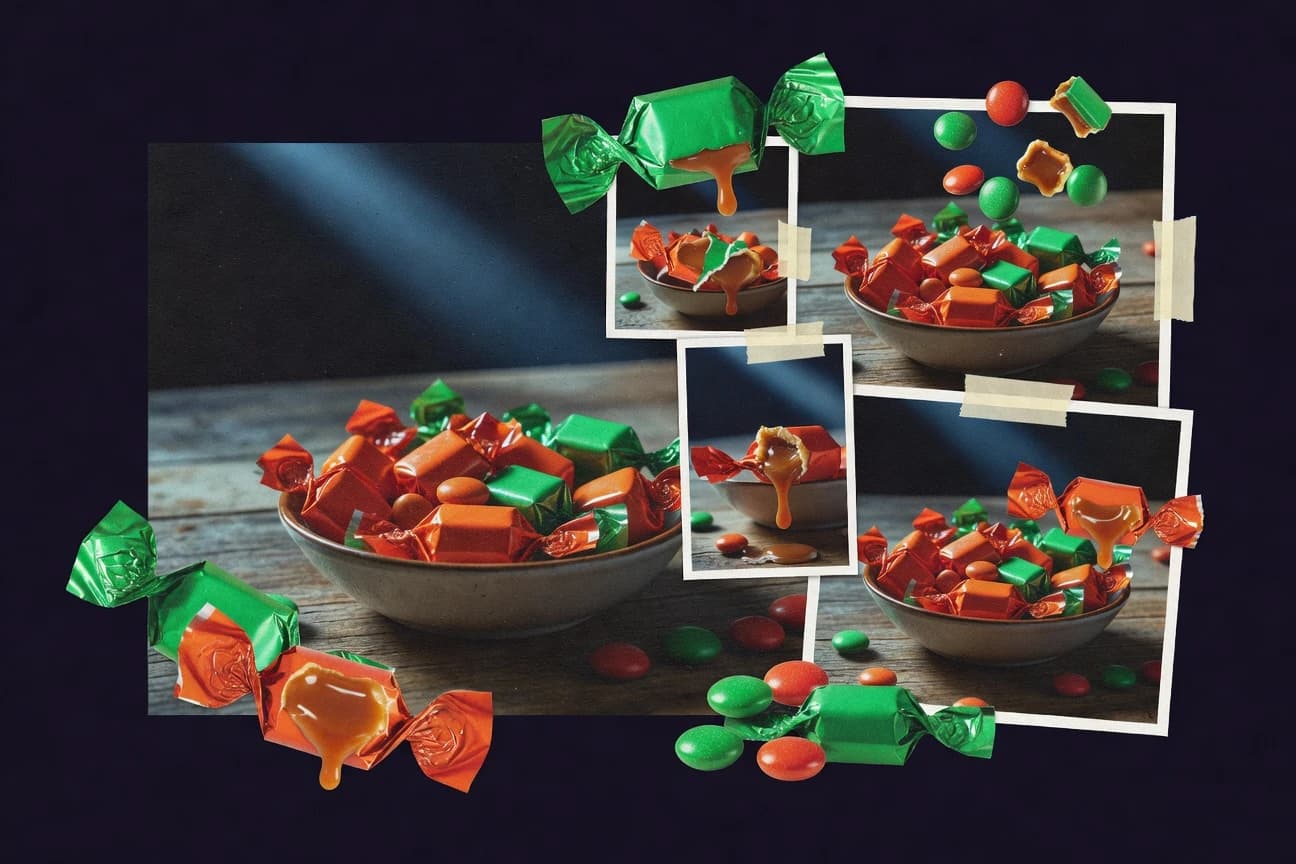
With Americans spending a record $3.5 billion on Halloween candy in 2023 and 72% planning to hand it out, the page reveals exactly how a “just in case” haul of 600 million pounds turns into leftovers no one can resist. You will see who really eats the candy after dark, how the Oct 28 to 31 shopping rush shapes 4,800 kid calories worth of candy, and why adults grab 65% of it instead of leaving it for trick or treaters.

Halloween Crime Statistics
Halloween crime patterns are shifting fast, with nationwide Halloween DUI arrests up 12% to 4,500 in 2022 and pedestrian accidents rising 17% on Halloween 2021 as more fatal crashes turn alcohol-linked. Arson and theft move in unsettling tandem too, from Philadelphia’s 28% spike in porch arson to 5,200 candy theft reports in 2023, plus NYC’s 1,200 purse snatchings in 2022.

Birthday Party Industry Statistics
See how birthday planning is shifting through 2025 realities like 62% of parents favoring eco supplies and health protocols adding a lasting 10% cost, while virtual parties still make up 12% of 2023. From AI personalized invitations up 40% to hybrid events expected to hit 25% by 2030, this page ties the biggest trends and market figures to what planners, venues, and suppliers should do next.

St Patricks Day Statistics
Americans are expected to keep the party economy humming, with $10 million a day in NYC bar revenue and $7.3 billion in St. Patrick’s Day retail spending in 2023, while big shifts hide in the details like corned beef jumping 13-fold and Guinness spiking 200% on March 17. Follow how the day’s luck ritual, from 34 million four-leaf clovers to 50 million pints of green beer, turns into a measurable rush across food, drink, parades, and travel.

Easter Statistics
Americans buy 90 million chocolate bunnies each Easter and spend $22 billion in 2023, but the surprises do not stop at candy, with Easter egg and brunch budgets, seasonal jobs, and even symbolism traditions all in one place. From global chocolate peaks of 10% to 50 million Cadbury Creme Eggs sold in the U.S., this page connects what people buy to why they celebrate.

Christmas Tree Industry Statistics
Even with competition from artificial, 34% of U.S. households still buy real trees each year, and top buyers do it for one very human reason scent, backed by 80% selecting fragrance and 72 million households displaying a tree by season end. This page connects what people do, from peak sales on the first weekend after Thanksgiving to 92% recycling into mulch plus the industry’s real footprint, including a $2.5 billion direct consumer spend yearly and North Carolina’s 15.1% production share.

Groundhog Day Statistics
From viewership jumping 300% to viral TikTok clips that racked up 500 million views in 2023, this Groundhog Day statistics page tracks how a single shadow forecast became a year round pop culture engine. But the real tension is predictive, with research finding Phil’s calls land only 39% of the time in a National Geographic Channel analysis, even as Punxsutawney tourism surged 400% after the 1993 film.

Boxing Day Statistics
Follow how Boxing Day grew from Medieval gift boxes into a UK bank holiday with rules and rituals that traveled the globe, then check the modern shock of scale where Boxing Day shopping alone brings about £4B to UK retail and online traffic surges by +300% worldwide. The page pairs its church alms origins with punchy modern figures like 80% of Australia off work and 1M Amazon UK orders to show exactly why December 26 never feels like a slow day.

Mothers Day Statistics
U.S. Google searches for “Mother’s Day gifts” top 25,000+ queries per month, with demand peaking exactly in the week of the holiday and staying unusually elevated from late April into early May. Beyond flowers and cards, the page tracks the sharp swings behind spa gift cards, brunch plans, and last minute “what to get mom,” plus the scale of giving across 84% of Americans and the surprising growth signals in retail and mail for Mother’s Day.

Christmas Lights Industry Statistics
US households are buying Christmas lights at a 65 percent rate with average spend rising to $52, while 47 percent of shoppers still wait for Black Friday. The details get even sharper as smart, LED, and app controlled demand pull buyers away from older options, with urban shoppers buying 1.8 times more than rural and women making up 58 percent of purchases.

Valentines Day Statistics
With 54% of Americans planning to celebrate and social media posts spiking 300% on Feb 14, this Valentine’s Day statistics page captures the shift between grand gestures and everyday reality. It also confronts the tensions behind the spending frenzy, from 15% of adults dreading the holiday to women initiating 69% of romantic gestures, plus what people really buy like 92% of Valentine chocolate purchased by women, and why breaks often rise the weekend after.
Summer Statistics
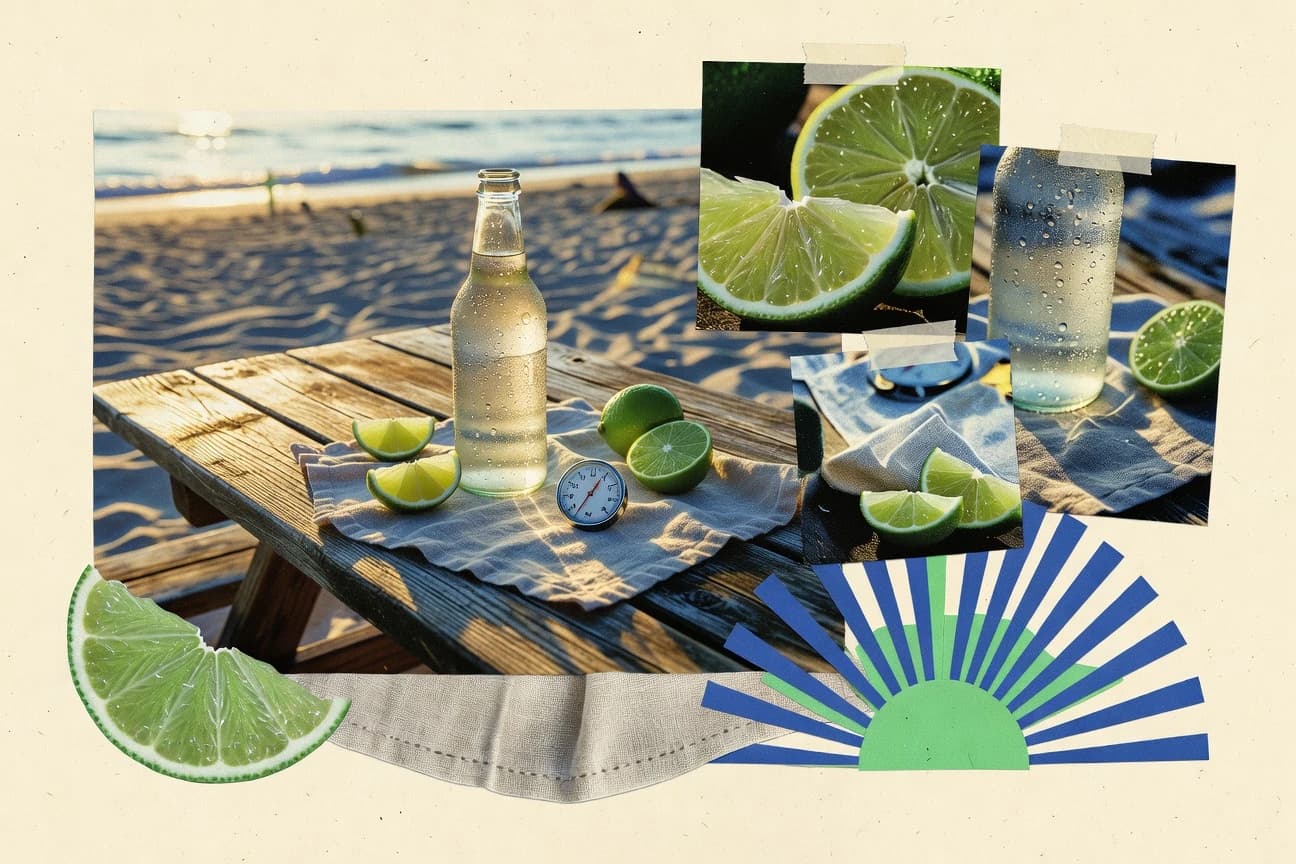
As summer heat rises, the U.S. already logged 28 billion dollar weather disasters in 2023 and heat stress is tied to 22.6 age adjusted deaths per 100,000 in 2021, while air pollution adds another global toll. At the same time, cannabis policy and use track shifting attitudes from record ocean warming and rising greenhouse gases to 38 states that allow medical marijuana and a 2024 snapshot showing 2,000 licensed retail outlets.

Birthday Statistics
From Germany’s 80% party throw rate to the way 23 people can already carry a 50.7% chance of matching birthdays, this page turns birthdays into hard data you can feel. You will also see how celebrations swing health, spending, and even the daily calendar around the day you least expect.
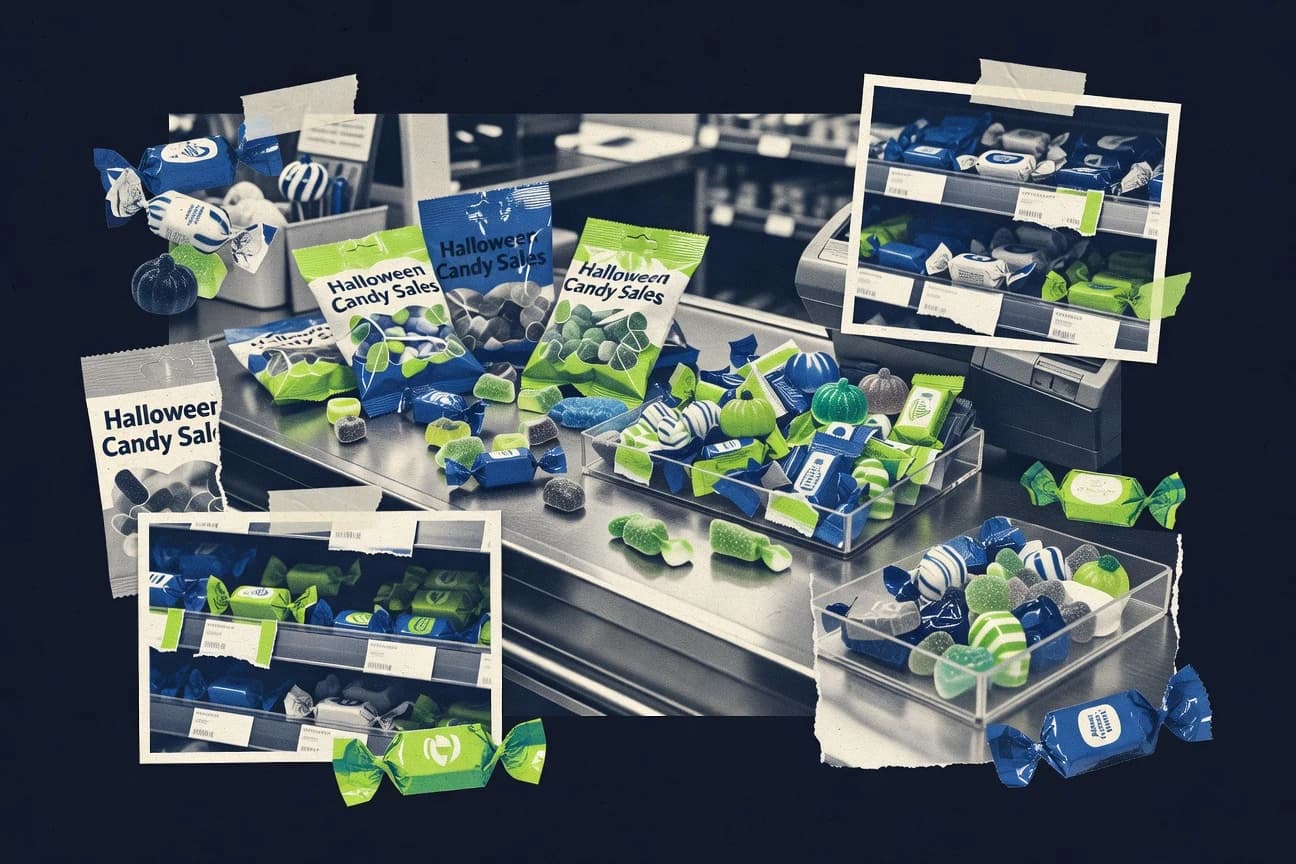
Halloween Candy Sales Statistics
Americans are expected to spend $3.2 billion on Halloween candy in 2024, yet the biggest surprise is how shoppers build that total, with 96% buying for trick or treating while 72% stock up by mid October and impulse buys at checkout jump 30% right before the holiday. Track how preferences swing too, from 65% favoring fun size packs to 40% searching for low sugar options, and see exactly which brands and behaviors are driving the candy aisles in 2024.
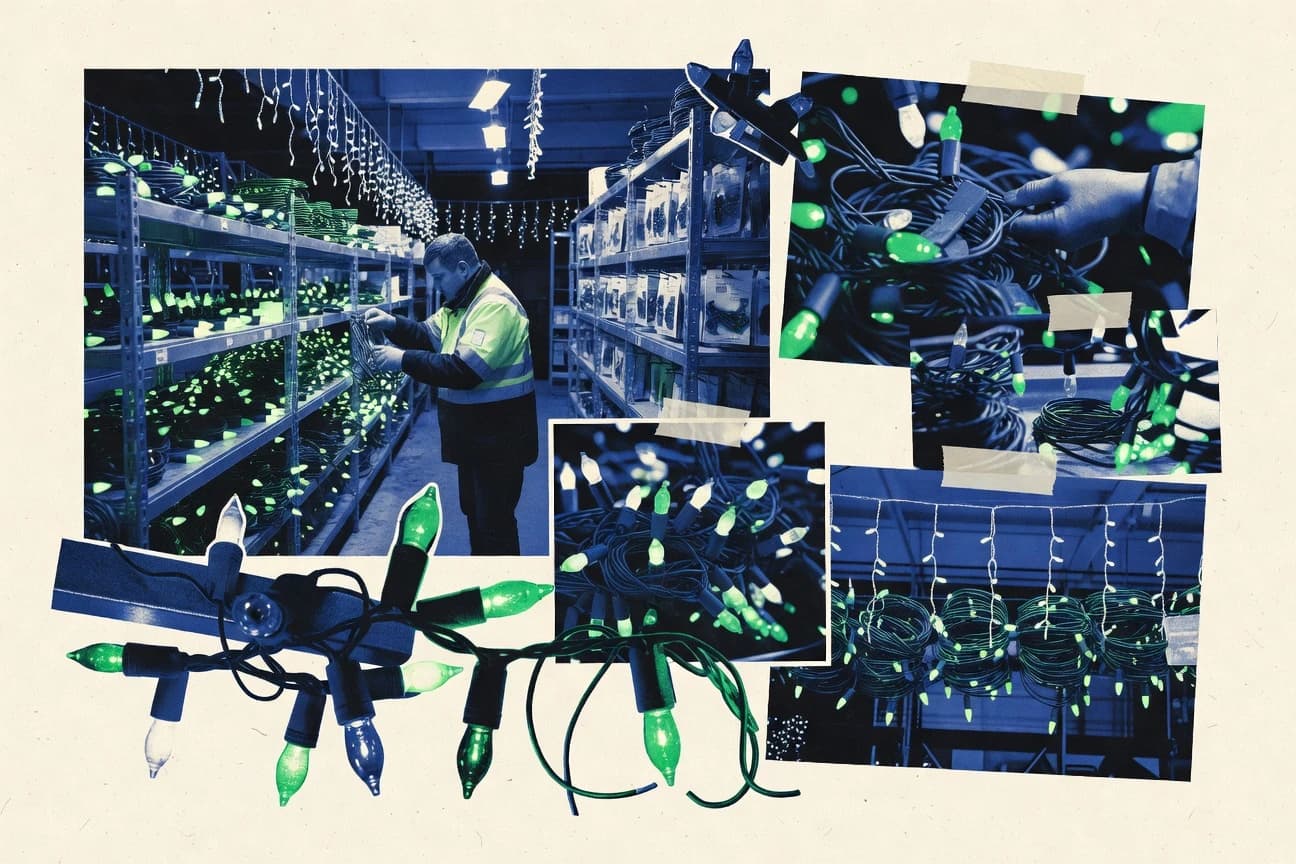
Holiday Lighting Industry Statistics
Holiday Lighting Industry lighting specialists are seeing demand and spending shift fast, with 2026 figures that make the season feel less predictable than last year. The page pulls together the most current benchmarks so you can spot where margins are tightening, where installs are accelerating, and what that means for your next planning cycle.