GITNUX MARKETDATA
Browse Our Category
Electronics And Gadgets
Latest update:


Electronics Industry Statistics
Smartphones and screens keep getting bigger while buying habits keep shifting online, with 25% US smartphone market share and 1.15 billion units sold globally in 2023 alongside 50% of consumers buying electronics online exclusively. From 5G chips at $85 billion and smart home shipments at $135 billion to electronics market growth toward $4.3 trillion by 2030, this page connects how quickly devices, supply chains, and preferences are reshaping the industry.

Taiwan Electronics Industry Statistics
Taiwan’s electronics sector still powers global supply chains with a workforce of 1.2 million and exports of US$360 billion, but the real tension is people and pay. With semiconductor wages up to NT$85,000 per month, women holding 42% of manufacturing roles, and productivity at US$450,000 per worker, this page connects how Hsinchu’s talent, job growth, and margins translate into performance.

Photography Camera Industry Statistics
Canon still leads with 49.1% of the global camera market, but mirrorless momentum is the real plot twist, with 72% of shipments going mirrorless in 2023 and buyers under 35 actively hunting social ready vlogging features. From GoPro’s 65% action dominance and DJI’s 42% gimbal share to lenses and cinema gear, the page connects brand power with what photographers actually prioritize, including 62% prioritizing video and 39% of professionals demanding 4K 120fps.

Quebec Battery Industry Statistics
Quebec’s battery sector already employs 3,500 people directly by 2023 and projects 20,000 by 2030, even as new projects like the Ford LG Bécancour plant are set to add 2,500 workers by 2026. You will see how 15% Indigenous participation in northern mining, 25% women in the workforce, and $13 billion in supply chain investment by end of 2023 sit alongside a projected $50 billion total economic impact by 2030.

Camera Module Industry Statistics
Smartphone camera modules still dominate consumer photography with 72% usage, yet the same precision is proliferating fast beyond phones, from 450 million surveillance shipments and 1.2 trillion factory images processed yearly to 150 million webcams shipped for video conferencing in 2023. See who holds the key shares and components, including Samsung Electro-Mechanics at 22% in smartphone modules and Largan Precision at 28% in lenses, alongside the sharp tech shift toward 120 million ToF module shipments and under display camera arrivals.

Display Industry Statistics
Smartphone displays alone shipped 1.52 billion units while OLED keeps reshaping the mix with 52 percent share, even as PC monitors slip to 142 million panels and tablets fall to 120 million. The 2026-ready snapshot ties market giants and emerging formats together, from 45 million flexible display shipments to $170.5 billion in global display revenue and the latest panel power shifts like LG’s 55 percent WOLED TV share and E Ink’s 75 percent ePaper dominance.

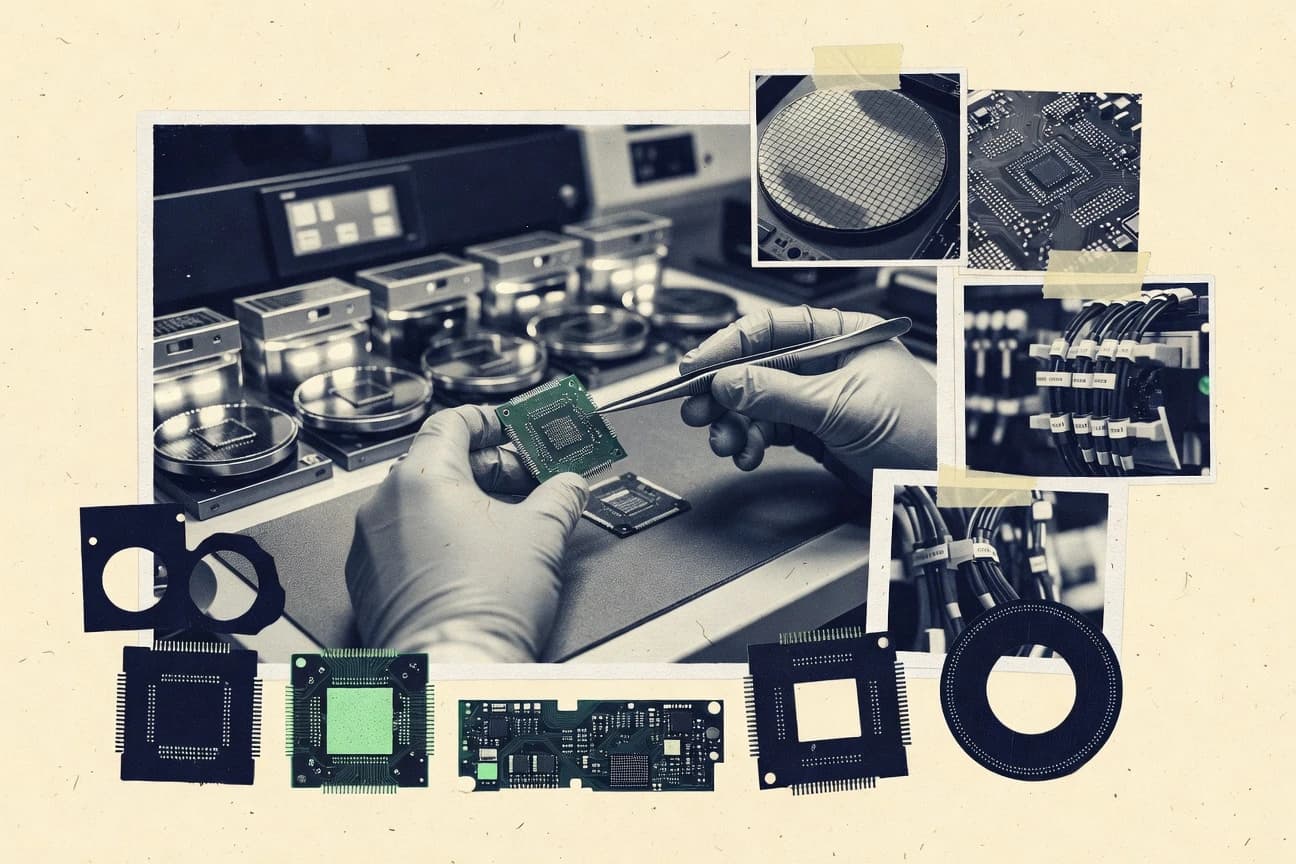
Today Semiconductor Industry Statistics
TSMC still controls 61.7% of foundry share in Q4 2023 and $69.3 billion in 2023 revenue, but the momentum is shifting as NVIDIA’s FY2024 Q4 revenue jumped 126% YoY to $26.97 billion on data center GPU demand and ASML shipped 47 EUV systems. This page ties those breakthroughs to the slower parts of the cycle too, from Samsung’s 2023 semiconductor decline to a record $109 billion global fab equipment spend, so you see what is accelerating and what is catching up.

Camera Industry Statistics
Canon still leads global camera revenue with 46% share, but mirrorless is tightening the field as it makes up 68% of ILC value and commands 65% of interchangeable lens market value at USD 22.4 billion worldwide. From DJI’s 77% drone share to Canon’s Japan retail lead at 55%, plus premium ASP hitting USD 8,500 for Leica, these 2025 ready insights explain who is winning now and where the next shift is most likely to land.

South Korea Battery Industry Statistics
South Korea Battery Industry trade power peaks in 2023 with exports hitting $32.8 billion, 47% higher year on year, while battery exports to the US surge 120% to $10 billion as LG Energy Solution alone sends $15.6 billion worth of batteries abroad. Track how the surplus reaches $25 billion and how production scale moves alongside market share and supply chain depth, including 380 GWh shipped globally, cathode output at 35,000 tons per year, and $60 billion in total industry revenue driven 90% by exports.

Thermal Imaging Industry Statistics
See how the 2025 supply chain pressure is reshaping thermal imaging, from security and surveillance driving 32% of global demand at USD 2.4 billion to rapid advances like 4K thermal video streaming at 60 fps. You will also find hard industry contrasts behind market winners and challengers, including Teledyne FLIR’s 25% share and a swarm of application stats that explain why defense budgets, healthcare screening, and predictive maintenance are all pulling at the same sensor pipeline.
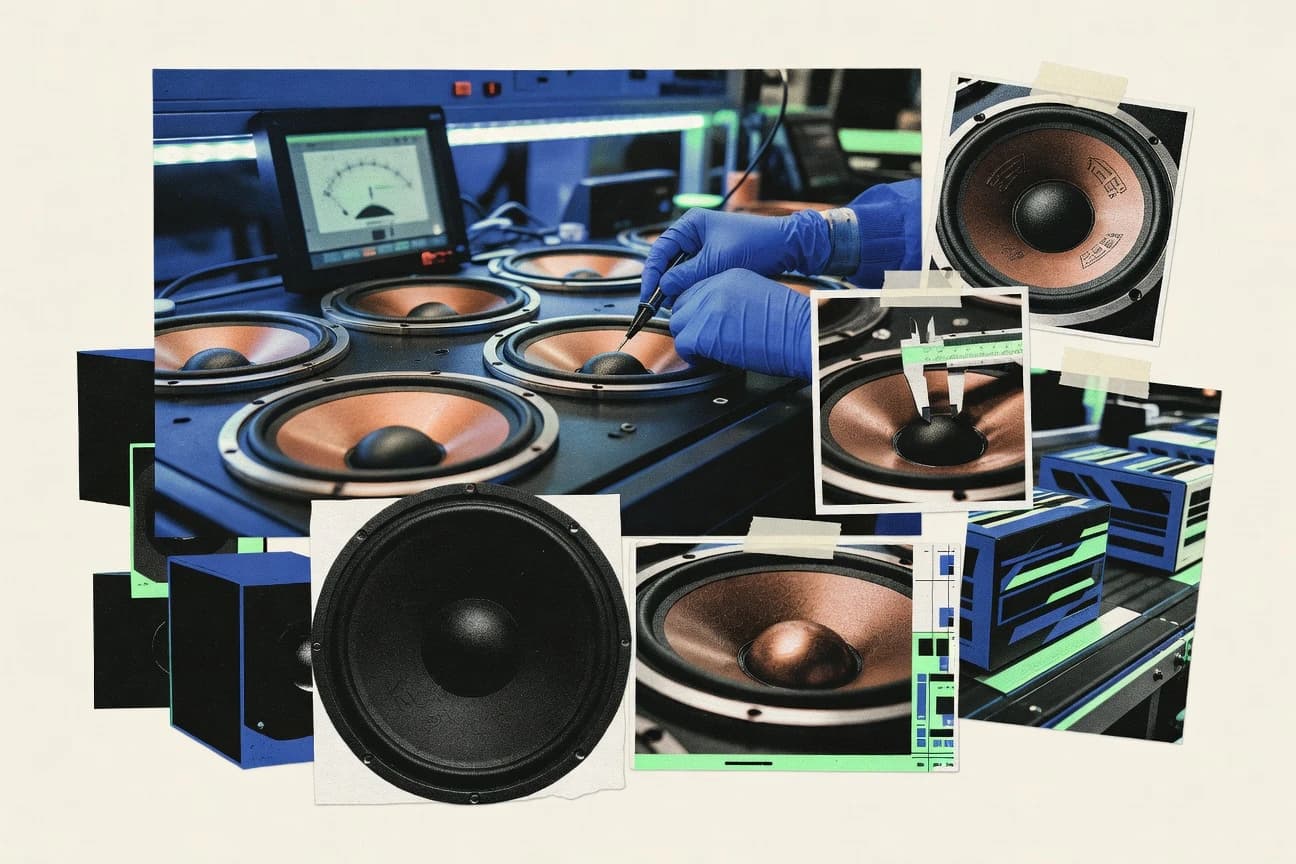
Loudspeaker Industry Statistics
Wireless and AI enabled audio is tightening its grip, with wireless loudspeakers taking 68% of global shipments in 2023 and smart speaker AI integration growing to 35% of the home market. But buyers are also voting with their wallets and behavior, from online channels driving 62% of market revenue to satisfaction with wireless sound quality reaching 72%, while pricing swings like Bluetooth speakers dropping to USD 45 in 2023 reveal what truly moves demand.
IoT Sensors Industry Statistics
Global IoT sensor spending is projected to climb toward US$ 64.85 billion by 2030, while connected devices are expected to top 18 billion units by 2025, making sensors and the analytics behind them a bottleneck and a growth engine at the same time. You will also see why predictive maintenance is already used by 41% of industrial teams and why data protection matters as breaches in 2023 took a median of 204 days to contain.

Cell Phone Repair Industry Statistics
US wireless equipment and devices repair services are up 1.6% year over year to a $33.5 billion market in 2024, while global mobile phone repair is projected to grow at a 2.3% CAGR through 2030. You will see how pricing, parts access, and faster workflows collide with real benchmarks like a 48 hour screen turnaround at independent shops and 38 states pushing right to repair bills, reshaping what customers expect from repair providers.
Netherlands Chip Industry Statistics
With 1.9 million enterprises employing at least one ICT professional and 10.2% of companies receiving orders electronically, the Netherlands is showing how chip powered compute is turning into everyday business demand. At the same time, €1.7 billion of Dutch venture capital for semis enabling hardware and software and 45% of manufacturers using RFID traceability point to a fast moving supply chain that still needs more industrial space and cloud capacity to keep up.

Smartphones Statistics
See how smartphones are reshaping everything from the pocket data bill to the OS upgrade timeline, with 3.6 billion mobile broadband subscriptions and $1.2 trillion in global smartphone consumer spending in 2024 sitting beside performance and security tensions like 3.7 second median app launches and 79% of buyers saying smartphone security matters. Then compare the hardware investment behind it all, such as $45 billion in camera module revenue and OLED topping 70% of 2023 shipments, against risks like $2.7 billion in reported US losses from smartphone related fraud in 2023.
Japan Electronics Industry Statistics
Japan’s inflation is easing to 1.9% while real GDP growth edges up to 1.0% for 2025, a backdrop for an electronics sector still carrying big momentum in R and D and firm-level supply chain strain. From $746.3 billion in 2023 exports to rapid cybersecurity adoption and semiconductor market share shifts, these Japan Electronics Industry statistics connect macro pressure with the operational choices that shape what gets built next.

China Display Industry Statistics
China Display Industry tracks how Beijing turned scale into dominance, from display exports hitting $85 billion in 2022 and global reliance on China panels reaching 60% for TVs to the 2023 shift where US tariffs cut China LCD export share to 35% and squeezed the market by more than raw volume. You will also see where bottlenecks are forming, including restricted imports of OLED EVE machines while domestic capacity lifts, plus the race across miniLED, flexible OLED, e-paper, and modules that is reshaping supply chains and pricing for 2026 watchers.

Projector Industry Statistics
With a 4.6% 2023 to 2028 CAGR pointing to steady projector market growth and standby power treated as a regulated, make or break cost driver, this page links energy use, TCO, and carbon estimates to the real procurement choices buyers face. Expect concrete benchmarks like 12,000 lumens minimum brightness, 25,000 hour laser lifetimes, and kWh pricing from the US and EU grids that turn “always on” decisions into measurable emissions and maintenance impact.

Optics Industry Statistics
From a 19.5% CAGR for AR VR optics to a 5.25% CAGR for the global optics market, these stats map where demand is accelerating and where it is steady, including photonics projected to grow from $19.3 billion in 2022 to $34.3 billion by 2030. You will also see how performance and adoption collide, from OCT’s 9.5% CAGR and 52% retinal screening uptake to the tight tradeoffs behind eye safe lasers and fiber standards.

Mobile Phone Statistics
With the global smartphone installed base projected to hit 7.1 billion devices in 2025 while 66.0% of the world already relies on mobile broadband, Mobile Phone pulls the latest trends into focus. You will see how daily app use reaches 2.8 billion users, why mobile security investment tops $40.7 billion, and what 5G’s 60% share in 2023 means for the next wave of shipments and data traffic.