GITNUX MARKETDATA
Browse Our Category
Electronics And Gadgets
Latest update:


Cameras Photography Industry Statistics
With smartphone photography still pulling in 65% of US consumers in 2023, the buying story is now being rewritten by 78% who say video capability matters most and 71% who want image stabilization, all while mirrorless takes 72% of camera shipments. This page connects those shifts to where money and attention are going next, from online sales driving 62% of US purchases and TikTok and Instagram fueling 55% of Gen Z inspiration to pro gear, sensors, and shooting tech that are reshaping everything from weddings to wildlife.
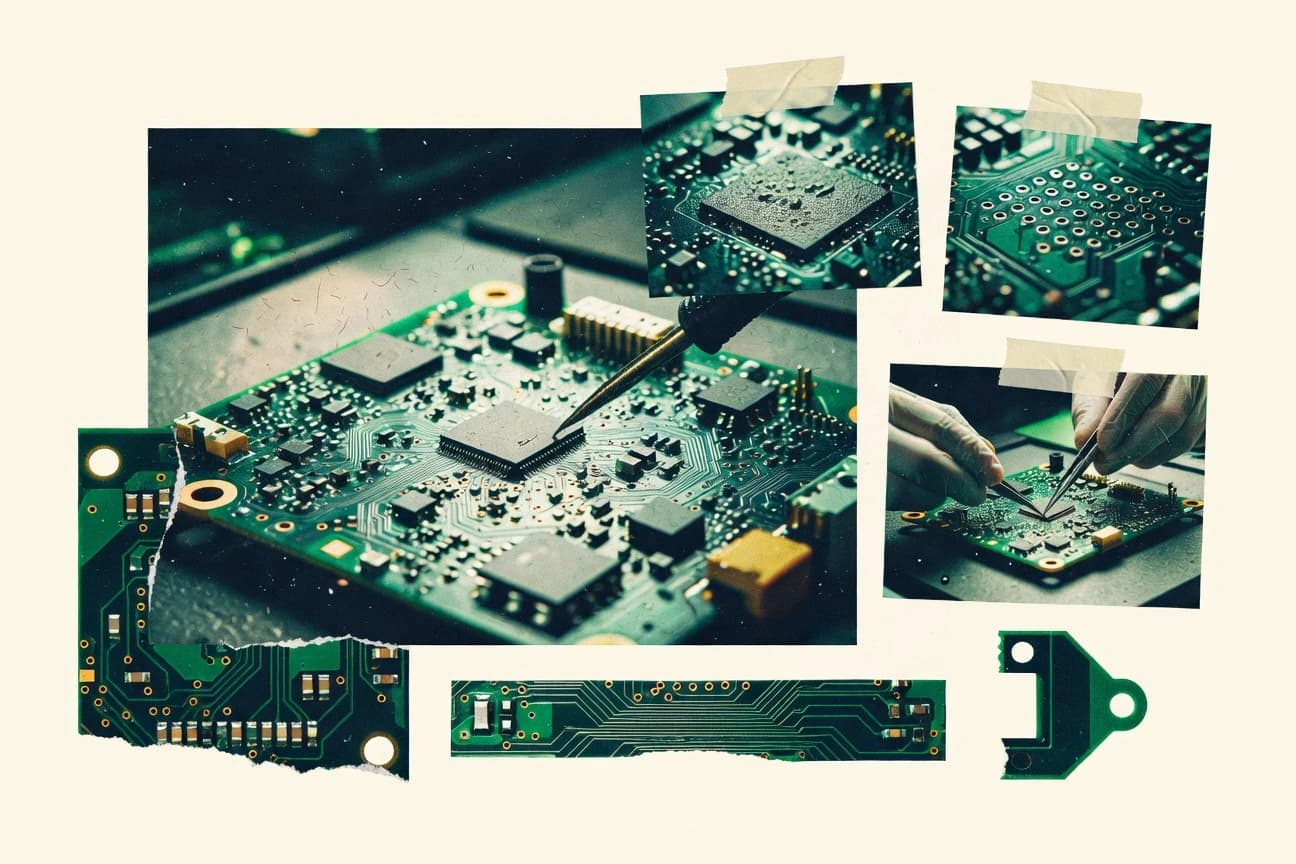
Pcb Industry Statistics
With the PCB growth forecast reaching $97.2 billion by 2028 and global power capacity planned through 2030 set to support electronics, this page connects macro shocks like IMF growth slowing to 3.1% in 2024 with real upstream demand signals from semiconductors and data center buildouts. It also tracks the material and compliance pressures manufacturers feel now, from copper price volatility and RoHS constraints to sustainability pull, so you can see exactly why PCB volumes keep moving even when growth rhythm changes.

Gan Sic Semiconductor Industry Statistics
See why the semiconductor shift is no longer gradual with 2025 facing a $62.0 billion projected global power semiconductor market by 2029 and $46.2 billion for analog by 2029, while wide bandgap like SiC and GaN keep pushing efficiency gains through lower switching losses. The page ties those demand forecasts to real supply chain and adoption signals, from 150mm SiC ramp momentum and packaging cost pressure to data center and EV battery investment that is steadily pulling more power electronics onto new platforms.

Oled Industry Statistics
OLED is projected to reach a $45.6 billion market by 2030 while OLED display alone is forecast to hit $9.1 billion by 2032, even as penetration keeps climbing from single digits in TV shipments toward over 20% of smartphone display share. If you care about why OLED keeps winning on efficiency, response time and lifetime, this page connects the lab metrics like above 20% EQE and near 1 ms gaming lag to the supply chain realities like vacuum deposition capex and encapsulation WVTR targets.
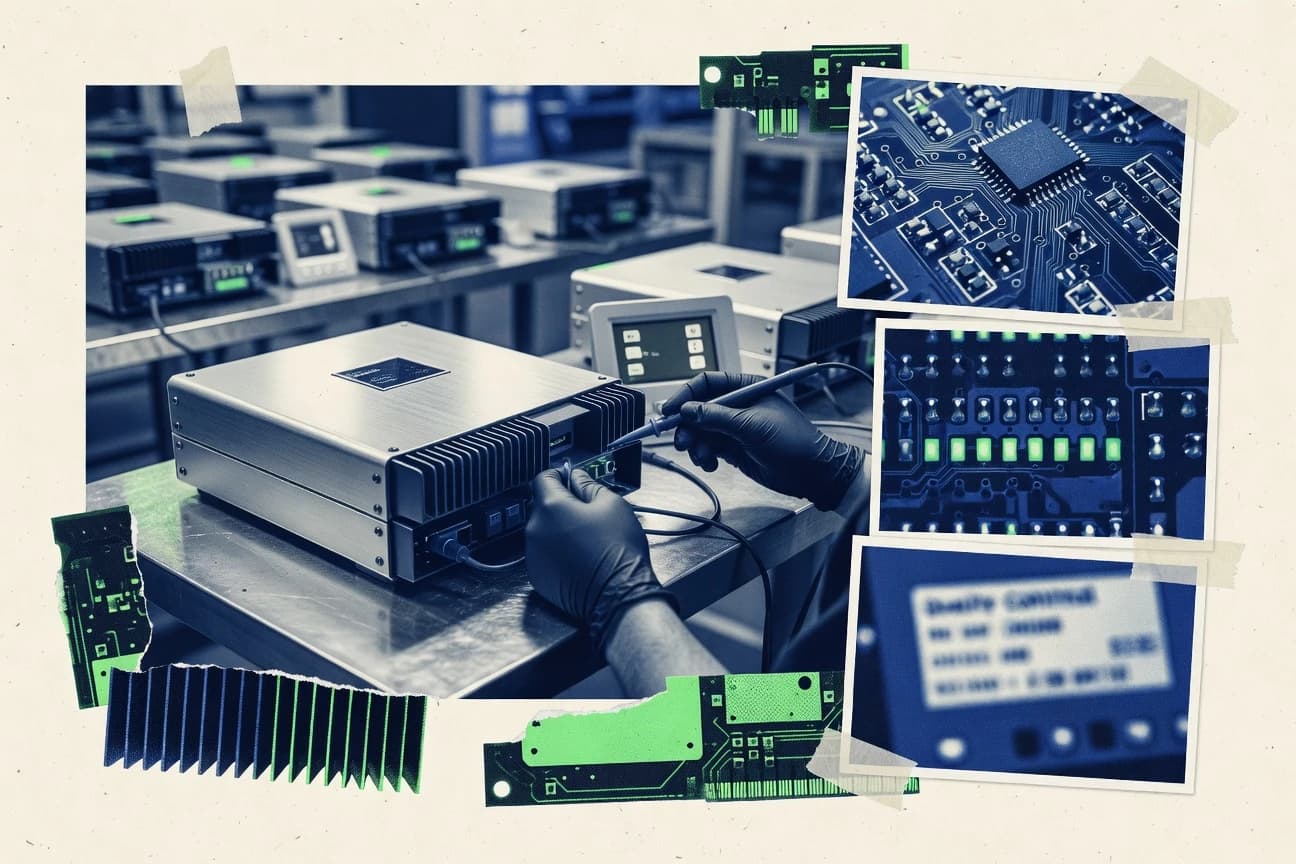
Inverter Industry Statistics
From $5.6B inverter and power converter shipments in 2022 that signal a solid domestic manufacturing base to U.S. wind generation alone avoiding 1.2 million metric tons of CO₂e in 2023 per Vestas, these figures connect inverter hardware to real grid outcomes. You will also see why regulators and utilities are pushing advanced controls fast, with EU and IEEE 1547 behavior requirements and grid forming demonstrations on the rise, while renewable buildouts and utility-scale PV keep pulling demand for higher efficiency, safer, and more grid capable inverters.

Professional Lighting Industry Statistics
Lighting is still responsible for about 40% of building electricity use, but the right efficiency and daylight controls can cut that demand dramatically while LED and smart lighting markets are accelerating fast with the global LED market rising from $72.2 billion in 2022 toward $143.8 billion by 2030. This page also connects the practical design outcomes to the standards and test methods that govern real performance and safety so you can see where energy savings, color quality, and grid decarbonization meet in measurable requirements.
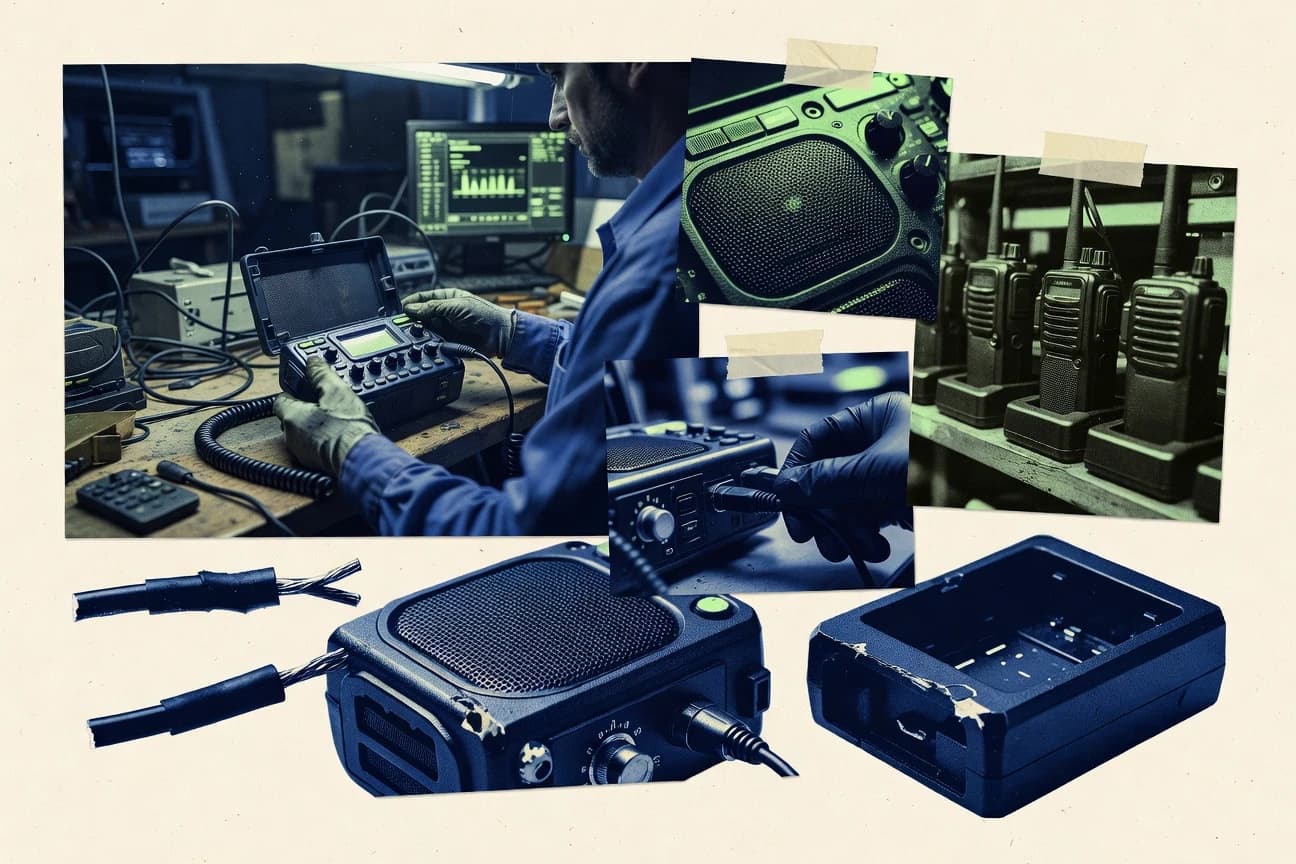
Two-Way Radio Industry Statistics
With 2023 global demand reaching USD 12.6 billion and a projected climb to USD 22.3 billion by 2030, this page pinpoints where two-way radios are winning and why, from public safety claiming 32% of demand to security and hazardous sites pushing encryption and intrinsically safe radios to near ubiquity. You will see how digital momentum is reshaping comms, including digital radios driving 58% of sales and encrypted models surging 30%, alongside market shares across top brands like Motorola Solutions at 29% and Hytera in digital with 18%.

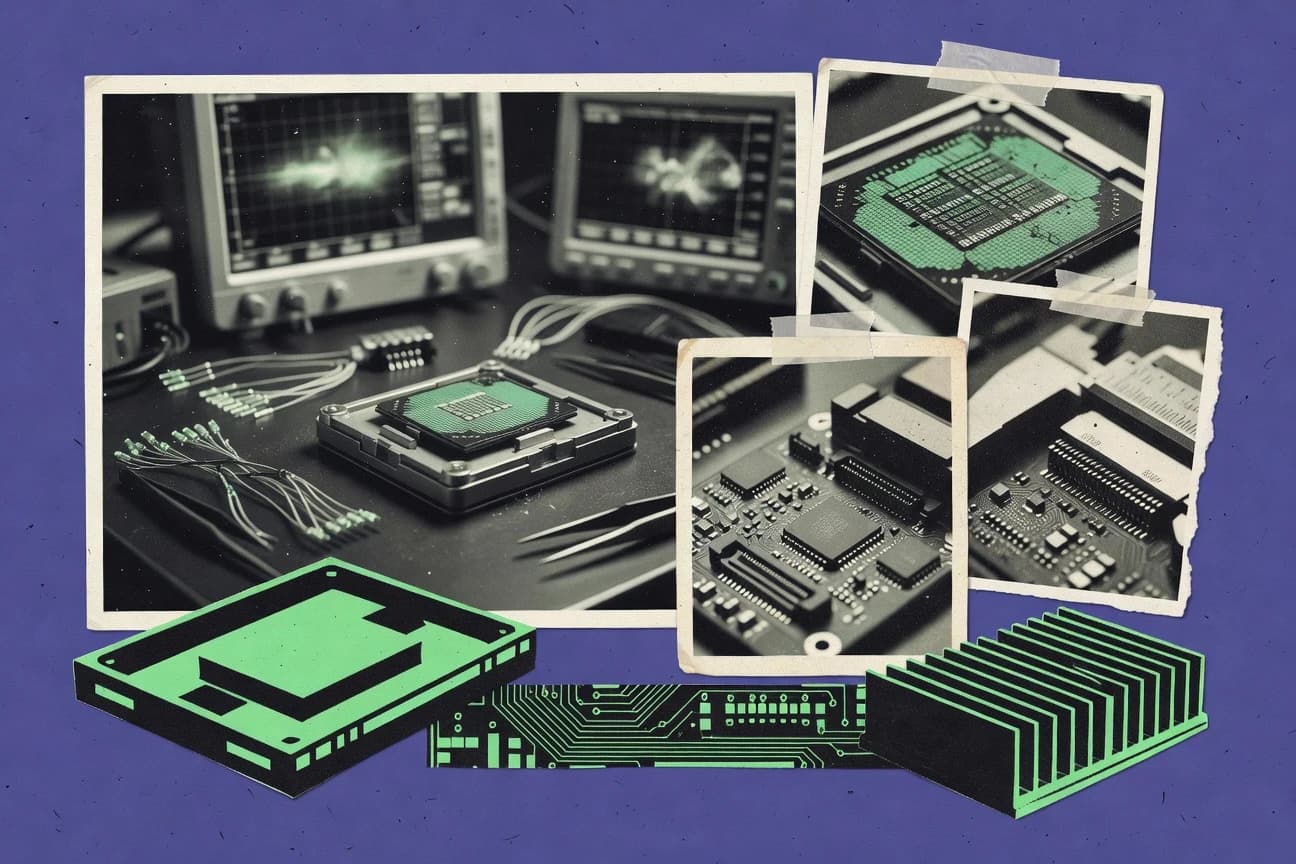
Microcontroller Industry Statistics
Microcontrollers are now riding a $38.7 billion market projection for 2030 while industrial demand climbs faster at a 7.4% CAGR, and the real bottleneck is shifting from silicon capacity to secure, efficient design choices. You will see how toolchain maturity, low-power sleep currents under 1 µA, and security practices collide with rising connectivity and embedded device risk, shaping what gets built next.

Capacitor Industry Statistics
With capacitor demand being pulled by data centers and EV fast charging while grid operators lean on capacitor banks for reactive power, this page connects market forecasts like a 5% polymer film CAGR and a mid single digit outlook for capacitors to the real cost and reliability pressures behind MLCC scaling and endurance testing. It also tracks how aluminum and silver price sensitivity, EU RoHS and REACH compliance, and the electronics buildout in Asia and the EU are reshaping what gets made and how long it must last.

Audiovisual Industry Statistics
Video is the traffic heavyweight, taking up 3.4% of all IP traffic in 2023 while streaming drives 82% of global consumer internet usage, yet AV budgets still get squeezed by labor that can be 40% to 60% of project cost. This page connects those demand signals to security, conferencing, and transport standards, from 52% VMS adoption plans to SMPTE ST 2110 and HEVC gains, so integrators can better forecast what will scale and what will fail in real network and installation constraints.

Audiophile Industry Statistics
With 2025 level pricing pressures and supply swings in focus, Audiophile Industry traces how 2.3 billion headphones shipped in 2022 and Spotify’s 239 million global MAUs shape what listeners buy and what they can actually hear. Then the page connects that stream of connected consumption to real quality and measurement signals, including lossless FLAC fundamentals, high resolution adoption at 26 percent of audiophiles, and the safety constraints behind all those earbuds and headphones.
Gan Sic Industry Statistics
See how 2026 timelines collide with trillion scale economics, from renewable energy investment worth US$1.2 trillion in 2023 to shipping emissions estimated at 1.1 to 1.2 billion tonnes of CO2, while policy pressure tightens through CSRD starting with fiscal year 2024 reporting, EU ETS Phase 4, and battery carbon footprint rules from 2024. The page also tracks the sustainability operations reality behind the mandates with figures like 78% of organizations using sustainability data platforms and 35% of manufacturing enterprises adopting digital twins for optimization.
Electronic Industry Statistics
Semiconductor and smartphone demand is shifting fast, with global semiconductor sales projected to rise 10.0% in 2024 to $602.1 billion even as smartphone shipments slipped 1.9% year over year to 289.4 million units in Q1 2024. You will also connect R&D intensity, data center power and cooling burdens, and breach costs into a single picture of where the electronics industry is headed next and what is driving it.

Office Printer Industry Statistics
Color is steadily eating into the office printer mix and pushing consumables higher, but the bigger shock is how policy and power management are reshaping total cost and performance, with managed print services projected to grow at an 8.9% CAGR from 2024 to 2030 and centralized fleet controls now used by 78% of organizations. If you manage printers, write print rules, or track spend and security, this page connects adoption and speed metrics to the real-world forces driving right sized, safer, lower energy printing in 2025 and beyond.
Infrared Camera Industry Statistics
Find out why infrared camera setups still see 10%–50% false positives in real surveillance conditions, even as properly calibrated uncooled systems can reach about 1.0 to 1.5 °C temperature uncertainty, and how pixel pitch benchmarks from 17 μm to 13.5 μm map to measurable performance shifts. Track what is driving adoption and tighter measurement, from NETD gains and emissivity sensitivity to 2024–2032 thermal imaging CAGR of 8.7% and evidence that thermography can cut electrical maintenance downtime by 5%–10%.
Electronics Repair Industry Statistics
US shoppers still choose local repair over manufacturers, with 65% preferring repair shops in 2023, while 72% of smartphone owners hold off on replacement when repairs cost under $100. This page connects the cost, sustainability, and workforce realities behind the global electronics repair market projected to reach $25.7 billion by 2030, where satisfaction runs high at 82% and the right-to-repair push is visibly reshaping demand.

Headphones Industry Statistics
With 45% of German consumers reaching for headphones or earphones at least daily and 54% of office workers using them for calls several times a week, everyday listening habits are the headline story for 2024. Then comes the counterpoint that can’t be ignored, ownership of noise cancelling is only 25% in 2023 while fit and tuning can swing real noise reduction by 10 dB or more, making this the stats page to understand what actually protects hearing and what just sounds better.

Dram Industry Statistics
DRAM demand is surging toward AI and data hungry compute, from HBM capacity that is still being earmarked for exascale to PC client DRAM shipments projected to grow 10% as Windows 11 upgrades tighten the supply picture. Meanwhile mobile and automotive are pushing density and capacity forward with 12GB class flagships and ADAS demanding 16 to 32GB per vehicle by 2025, while the market stays concentrated with the top three firms controlling 95% of DRAM.

Mobile Phone Industry Statistics
5G and AI are reshaping smartphone reality fast, with 5G smartphones projected to reach 71% of global shipments by 2028 and AI integrated models surging 200% year over year in 2023 while premium pricing climbs. From 300 operators running 5G standalone to NFC on 95% of new devices and mobile data traffic hitting 923 exabytes, this page tracks the tech shifts and market moves that are actually changing what gets bought, sold, and used.

Monitor Display Industry Statistics
The latest Monitor Display Industry figures reveal where buyers are quietly changing their minds, from USB-C becoming standard on 35% of business monitors to OLED shipments jumping 250% to 120,000 units in 2023. You will also see the pricing and panel shifts behind that demand, including the average PC monitor selling price falling to $185 in 2023 and LCD panels still holding 92% of the market.