GITNUX MARKETDATA
Browse Our Category
Electronics And Gadgets
Latest update:

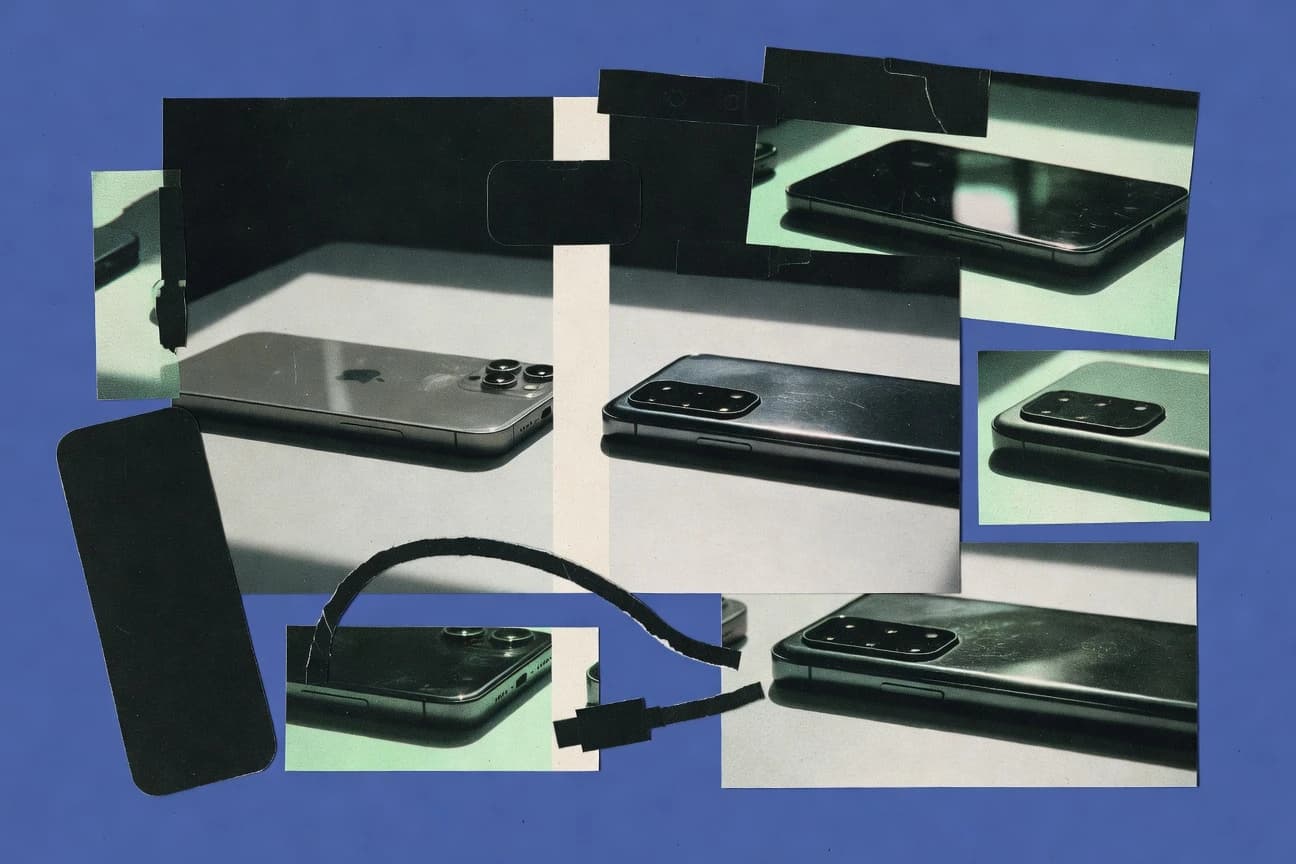
Iphone Vs Android Statistics
With iPhone and Android splitting the global market into 15.8% versus 84.2% in Q2 2024, this page pairs that dominance with tougher questions like premium spending and performance. From Apple earning half of smartphone industry revenue to sustained battery and benchmark gaps, it shows where each ecosystem still wins and where the momentum can flip fast.

Led Light Statistics
LED adoption is already mainstream, with 70% of EU streetlights converted by 2023 and 25% of global greenhouses using LED supplements, yet the real shift is performance and impact as LEDs cut energy use by up to 90% and even reduce CO2 emissions by 1.4 billion tons annually worldwide. The page puts proof next to claims across homes, cars, tunnels, data centers, and optics from 80 to 100 lumens per watt to near mercury free lighting, showing exactly why LED keeps winning.
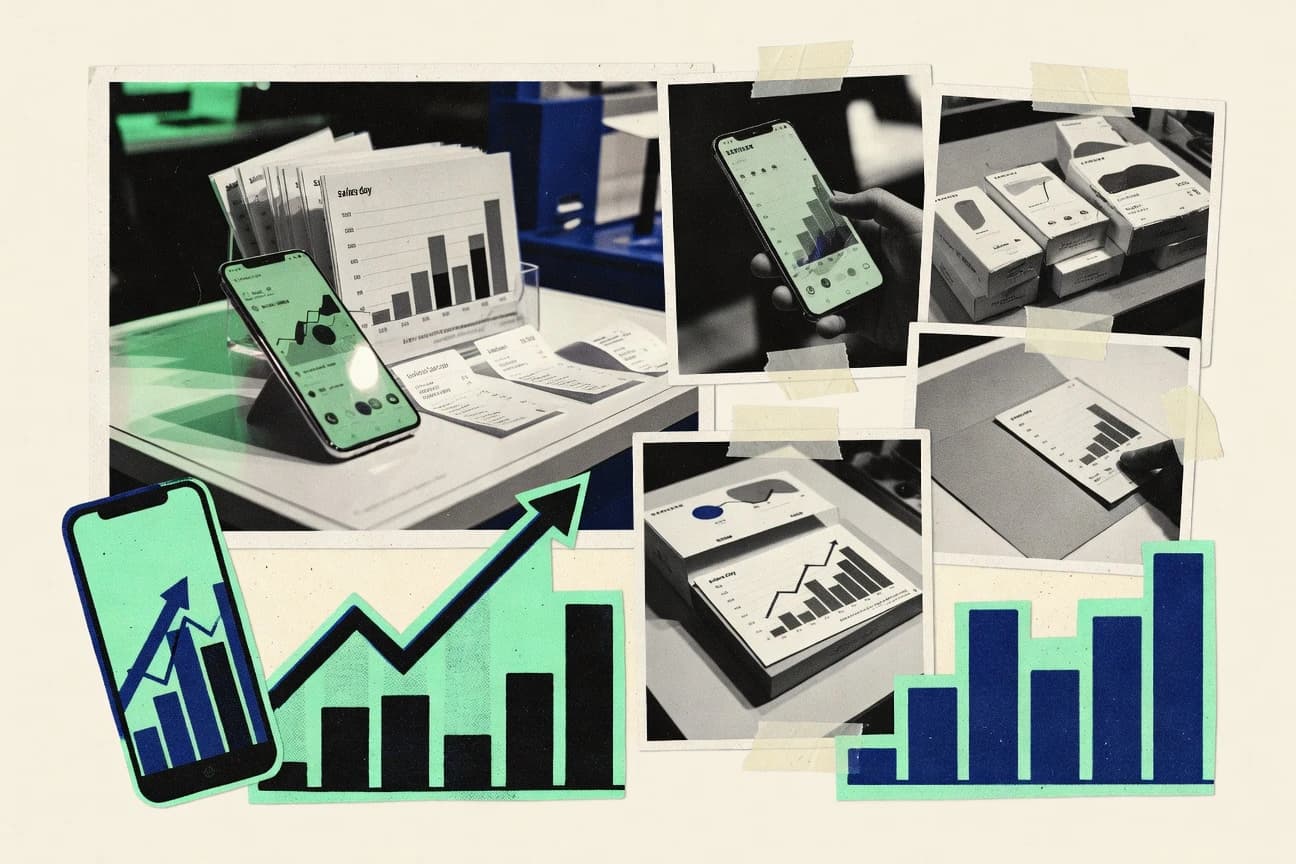
Samsung Smartphone Sales Statistics
Samsung still moved 226.6 million smartphones globally in 2023, but its full year smartphone shipments slipped 12 percent year over year while global market share settled at 19.4 percent. Follow the quarterly swings and category momentum that fed Samsung’s phone revenue growth in Q4 even as full year smartphone revenue fell 14 percent year over year.
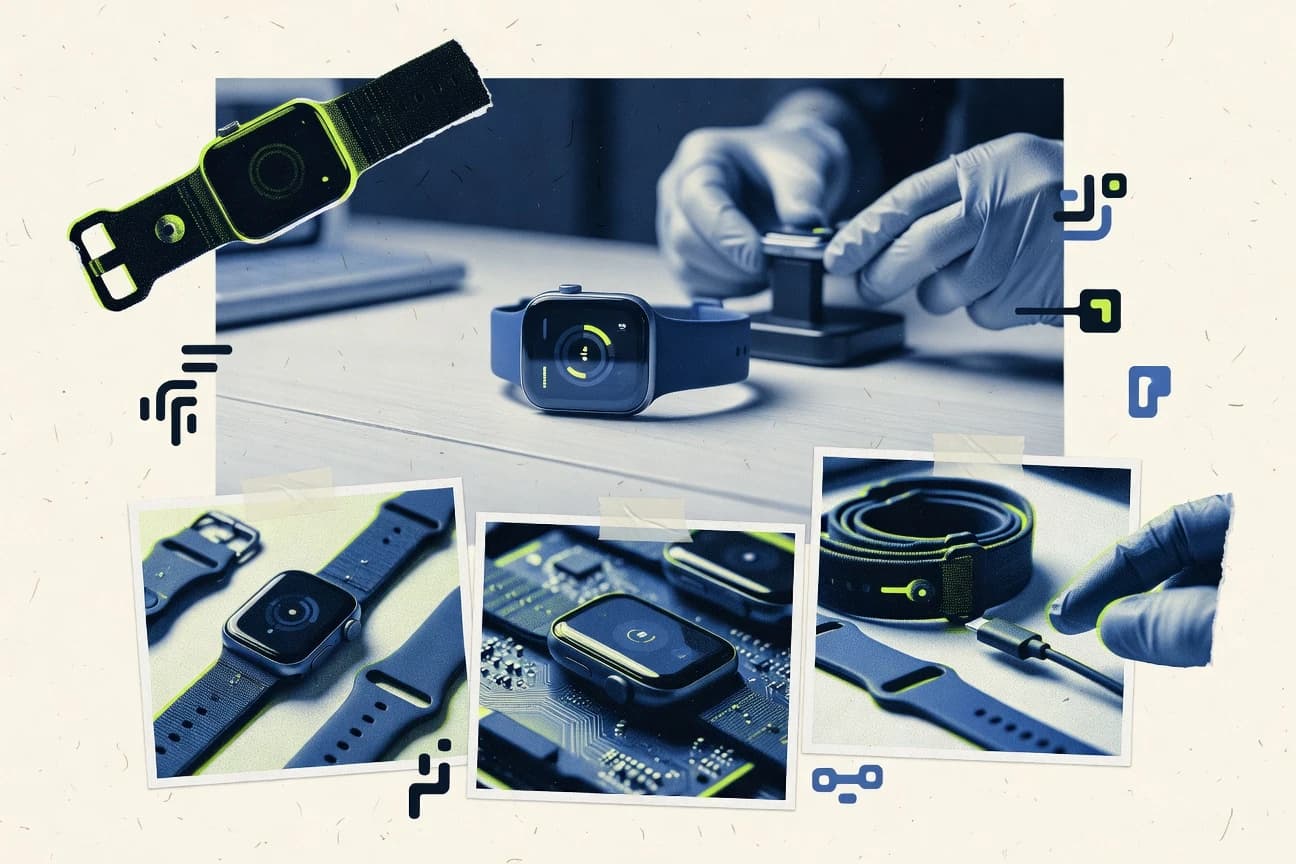
Wearable Technology Industry Statistics
Wearable tech is no longer a niche accessory with global users climbing to 1.1 billion in 2023 while shipments are set to reach 619 million units in 2024, and the market is already shifting toward everyday health monitoring and notifications on wrist devices. You will see why fitness engagement is sticking, how heart rate and stress insights are changing daily routines, and what the business looks like across smartwatches, hearables, wearables for kids, and enterprise wellness.
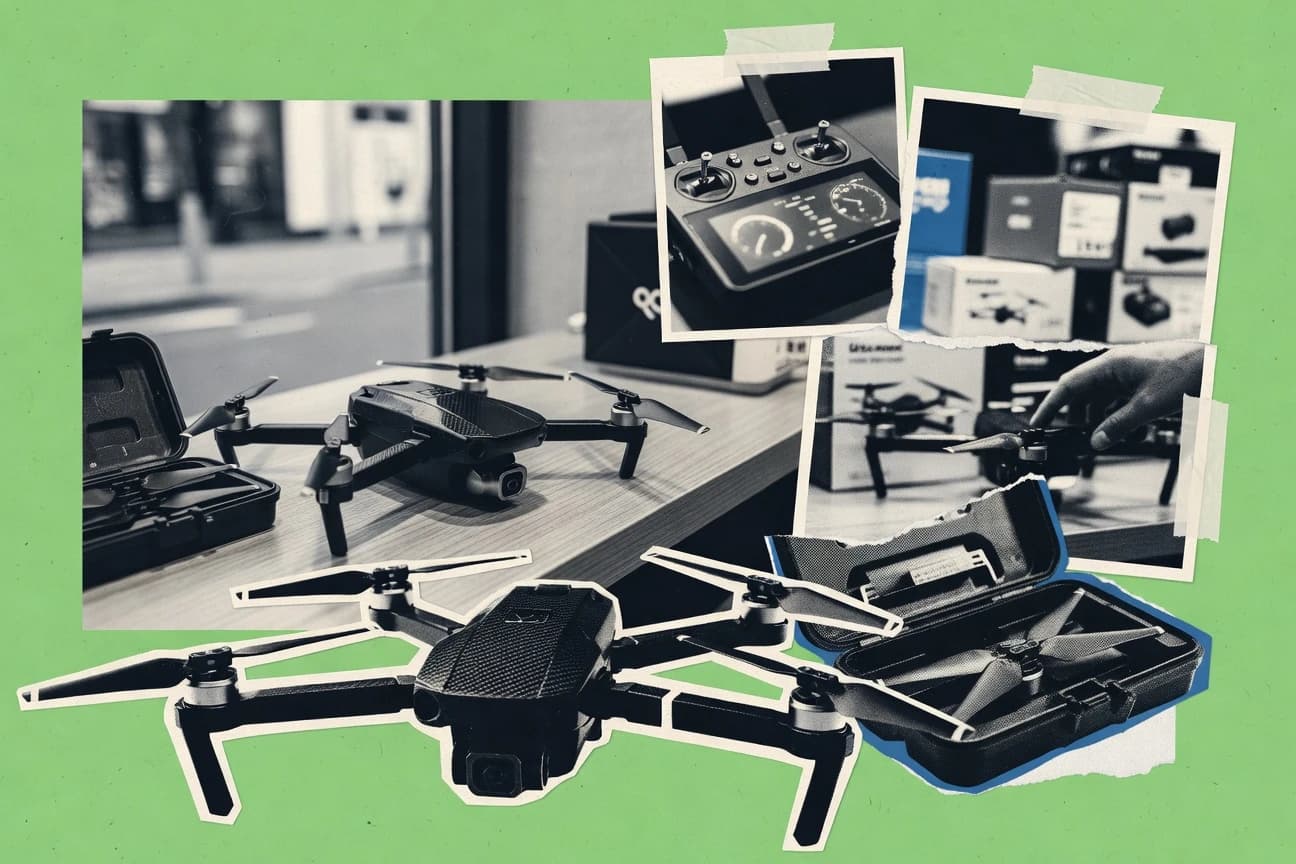
Drone Sales Statistics
From Zipline surpassing 500,000 medical deliveries to drone programs now cutting bridge inspection costs by an average of $2,000, these stats show how fast the industry is moving beyond demos and into measurable savings and lifesaving outcomes. You will also see the regulatory and adoption pressure points that matter in 2025 and beyond, like remote ID compliance on 99% of new US drones and insurance and claim processing gains, so you can understand what is driving sales as much as what is driving flight.
Personal Computer Statistics
PC hardware in 2023 keeps sprinting forward with an average 16 GB RAM in shipments, Wi Fi 6E in 48% of new PCs, and USB C charging on 88% of laptops, while software and usage signals stability at scale with 72% of all PCs running Windows and 6.2 hours of daily consumer use. You will see how choices like SSD exclusivity, RTX 40 series adoption in 18% of gaming notebook shipments, and enterprise spending of $78.4 billion shape what buyers actually get.

Korean Display Industry Statistics
Korean display exports in 2023 hit $45 billion in revenue and a $25 billion trade surplus, while foldable OLEDs surged to 50 million units and $8 billion value. Track how Samsung Display dominated OLED and Apple related shipments while LG Display expanded WOLED for Sony and Panasonic, reshaping market share as OLED ASP jumped about 50 percent over LCD.

Transformer Industry Statistics
Utility transformers still dominate demand with 52% of global units, yet renewables and data centers are pulling the market fast, with renewable applications driving 28% of sales in 2023 and data centers needing 15 GW of transformer capacity by 2030. Get the full breakdown of who is buying what including EV charging’s 500,000-transformer ramp, the surge in smart and dry type adoption, and where supply is coming from since China produced 65% of the world’s transformers in 2023.

High-End Audio Industry Statistics
Bowers & Wilkins takes 22% of the high end speaker market while Roon hits 500,000 subscribers by end 2023, showing how brands win and platforms compound momentum. Meanwhile, attention is split between luxury buyers and fast growing categories like active speakers and high resolution streaming, from Devialet’s 150,000 Phantom units worldwide to Dirac Live room correction in 25% of new high end systems.
Interconnect Industry Statistics
Familiar big names dominate interconnects, but the real surprise is how quickly the center of gravity shifts toward data centers and high-speed links. TE Connectivity led interconnects with 18% of the total in 2023, while fiber optic demand lifted the fiber optics interconnect segment toward a 7.2% CAGR and the data center interconnect market is set to climb from USD 12.3 billion in 2023 to USD 22.1 billion by 2030.

Led Industry Statistics
Commercial sites embraced LEDs at 92% of new installations worldwide in 2023 while LEDs cut global lighting energy use by 1,500 TWh annually by 2023, equal to 1.2B tons of CO2 saved. From EU cities replacing 45% of legacy HPS street lamps to data centers trimming cooling by 15% and OLED light replacing halogens in 90% of new commercial jets, the page traces where the switch already happened and what is driving the next wave.

Smart Ring Industry Statistics
Smart rings are moving from niche to mainstream fast, with the market forecast to reach USD 6.3 billion by 2030 and smart ring subscription models expected to drive 40% of revenues by 2026. This page tightens the spotlight on the brands shaping that shift, from Oura’s 1 million active users and 85% retention in 2023 to Samsung’s 500,000-plus pre-orders in a single week and battery life still ranking as 68% of buyers top priority in 2024.
Panasonic Industry Statistics
Panasonic’s latest snapshot shows operating profit at 238.8 billion yen, up 10.6 percent, while total assets rose to 5,787.9 billion yen and free cash flow landed at 289.2 billion yen. Behind the performance, people and progress stand out too with 92 percent of employees reached by diversity training, women holding 12.4 percent of managerial roles, and a safety incident rate of 0.18 per million work hours.
Uhf Rfid Industry Statistics
UHF RFID is surging beyond simple inventory counts with 99.5% retail accuracy at store entrances and Walmart deploying 100 million UHF tags across apparel for omnichannel fulfillment in 2023. The page also maps how chip and reader power is being reshuffled, from NXP’s 35% share of UHF RFID ICs to Impinj taking 45% of UHF reader chip share, while real world read performance keeps pushing toward longer range, denser deployments, and tighter compliance.
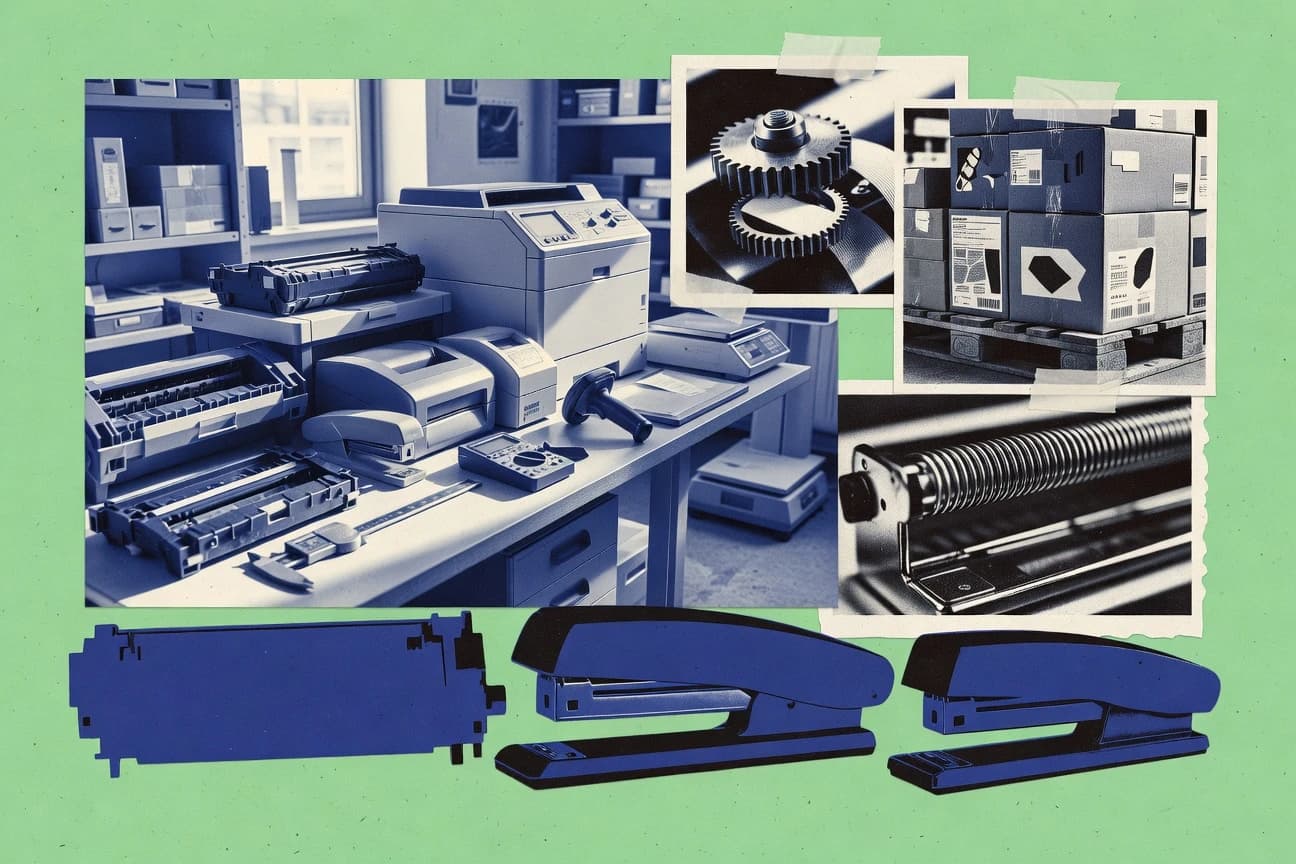
Office Equipment Industry Statistics
Wireless printers now sit in 67% of US offices even as printer usage fell 22% from 2020 to 2023, a shift that is reshaping spend, sustainability, and fleet size. If you want to understand what hybrid work and cloud printing are changing next, this page ties together the latest adoption numbers like 52% moving to cloud printing, 55% of Gen Z demanding sustainable gear, and 27% of mid size offices using AI document management.
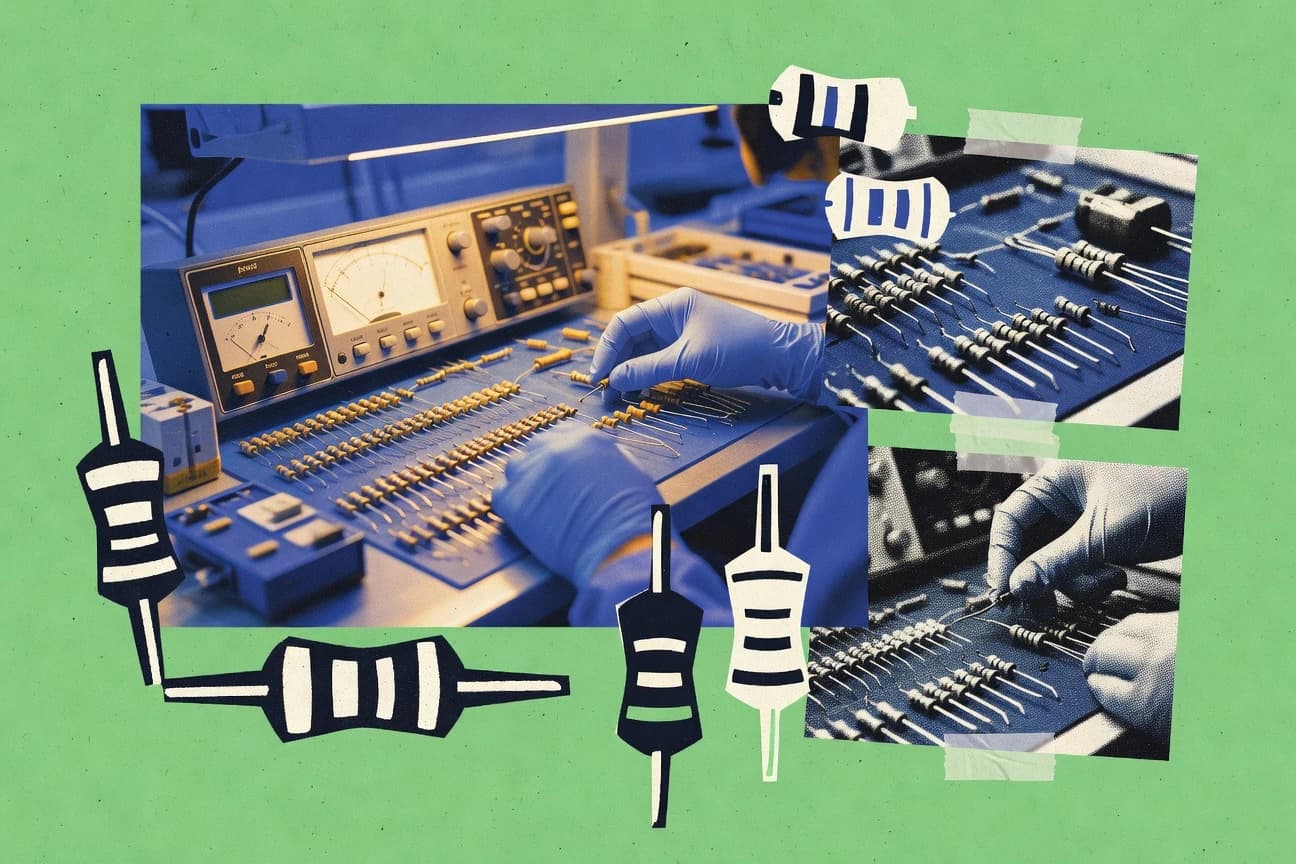
Passive Components Industry Statistics
Global passive components are forecast to reach USD 65.7 billion by 2030, growing at a 5.3% CAGR from 2024 to 2030, while MLCC demand is expected to climb 6.8% CAGR toward 3.5 trillion units annually driven by EVs and 5G. But the leadership story is equally telling, with Murata holding 22% of the MLCC market, and a reshuffle underway as Yageo’s KEMET deal lifts its passive revenue to USD 3.8 billion in 2023.

Smartwatch Industry Statistics
See why smartwatch demand keeps shifting toward everyday health and notification habits, even as revenue and shipments surge. This Smartwatch Industry page brings together the latest adoption, usage, and market share signals like a 45% global fitness tracking preference among buyers and a 15% global adult adoption rate for ages 18 to 64, alongside the biggest brands fighting for dominance.

Copier Industry Statistics
Monochrome output is now 68% of copier pages and security incidents drive 49% of service calls, even as cloud printing reaches 35% of print jobs and ECM integration hits 73%. Read the Copier Industry statistics page to see how digitalization shrank fleets 20%+ for 41% of businesses, why SMBs lean toward leasing 57%, and which brands are gaining share as the market moves from hardware to managed, low TCO systems.

Led Wall Industry Statistics
Retail, corporate, and entertainment are now driving display decisions fast, with 42% of Fortune 500 lobbies using LED walls and events adding 500,000 m² of rented installations in 2023. Expect even sharper performance benchmarks as outdoor brightness standards push beyond 10,000 nits for 65% of 2024 installs and micro LED wall tech targets 15% share by 2028, so this page helps you spot where the industry is really moving next.

Silicon Photonics Industry Statistics
With 1.2 million silicon photonics based 800G ports shipping in Q4 2023 and hyperscale pushing silicon photonics into 2024 upgrades, the page tracks why throughput is surging even as thermal crosstalk and insertion loss remain stubborn limits. You will also see where the tech is spreading beyond data centers, from 2 million AR VR headset displays in 2023 to 500 substations monitoring with photonic sensors, and what that shift means for the silicon photonics market projected to reach USD 6.85 billion by 2030.