Market data
Education & Learning
Explore education & learning statistics and market research reports with sourced data and trend analysis.
Latest update:
 Nikolas Papadopoulos


Statistics · 2026
Learning Disability Statistics
About 34% of US students identified under IDEA fall under Specific Learning Disabilities, yet many reading, attention, and mental health needs go unsupported, a tension mirrored by findings that only 16% to 17% receive instruction matched to their needs and that tutoring and small group instruction produce statistically significant gains. The page connects prevalence from across countries with what actually works in practice, including effects from structured literacy, phonological training, and assistive technology that can shift reading speed and comprehension.

Statistics · 2026
Bachelor Degree Statistics
In 2022, bachelor degree holders age 25 to 34 earned a median weekly income of $1,432 and faced a 2.2% unemployment rate, compared with 4.0% for high school only, alongside a $2.8 million lifetime earnings premium over the high school diploma. The page also connects who earns degrees and where they enroll, from 64% bachelor's attainment among Asian Americans to 29% 6-year graduation for private for profit 4-year students, plus the real costs of going, with average loan debt at $29,800 and total student debt topping $1.6 trillion in 2023.

Statistics · 2026
Classroom Management Statistics
A fresh look at classroom management research puts practical wins on the wall fast, from 42% fewer disruptions with positive reinforcement to 78% of middle schoolers focusing better when expectations are spelled out clearly. You will also find what consistently improves behavior and learning, like 35% fewer fighting-related office referrals after restorative circles and 51% fewer weekly interruptions after de escalation training.

Statistics · 2026
Mba Employment Statistics
Fresh 2023 outcomes reveal how quickly MBA recruiting closes the loop. Harvard’s median base hit $175,000 and 96 percent of HBS graduates had jobs within three months while the employer mix varies sharply by school and region, from McKinsey taking 8 percent of HBS placements to 42 percent of Stanford GSB offers landing on the West Coast.

Statistics · 2026
Achievement Gap Statistics
In 2022 NAEP reading for 4th graders, students with disabilities scored 186 compared with 227 for non-SWD, and California’s 8th grade math gap widened to 35 points after COVID. Scroll to see how inclusion rates, race and income gaps, and gender differences stack up across NAEP and state results, including a 72 point low income math shortfall in 2019 and a 26 point college readiness divide by grade 12.

Statistics · 2026
School Dress Code Statistics
In 2022, 47% of school dress codes failed Title IX gender equity compliance audits, even as students and families keep reporting cultural and identity conflicts. See how the evidence stacks up across discipline, hair and hijab rules, and gender expression from youth surveys to federal civil rights data, plus what strict uniform policies appear to change in real school outcomes.

Statistics · 2026
Homework Is Bad Statistics
Recent evidence keeps landing on the same inconvenient conclusion that more homework is not the boost schools promise. Across studies, going beyond about 90 to 120 minutes is tied to measurable harm such as sharp drops in performance and retention, more sleep deprivation, and higher anxiety and depressive symptoms.
Statistics · 2026
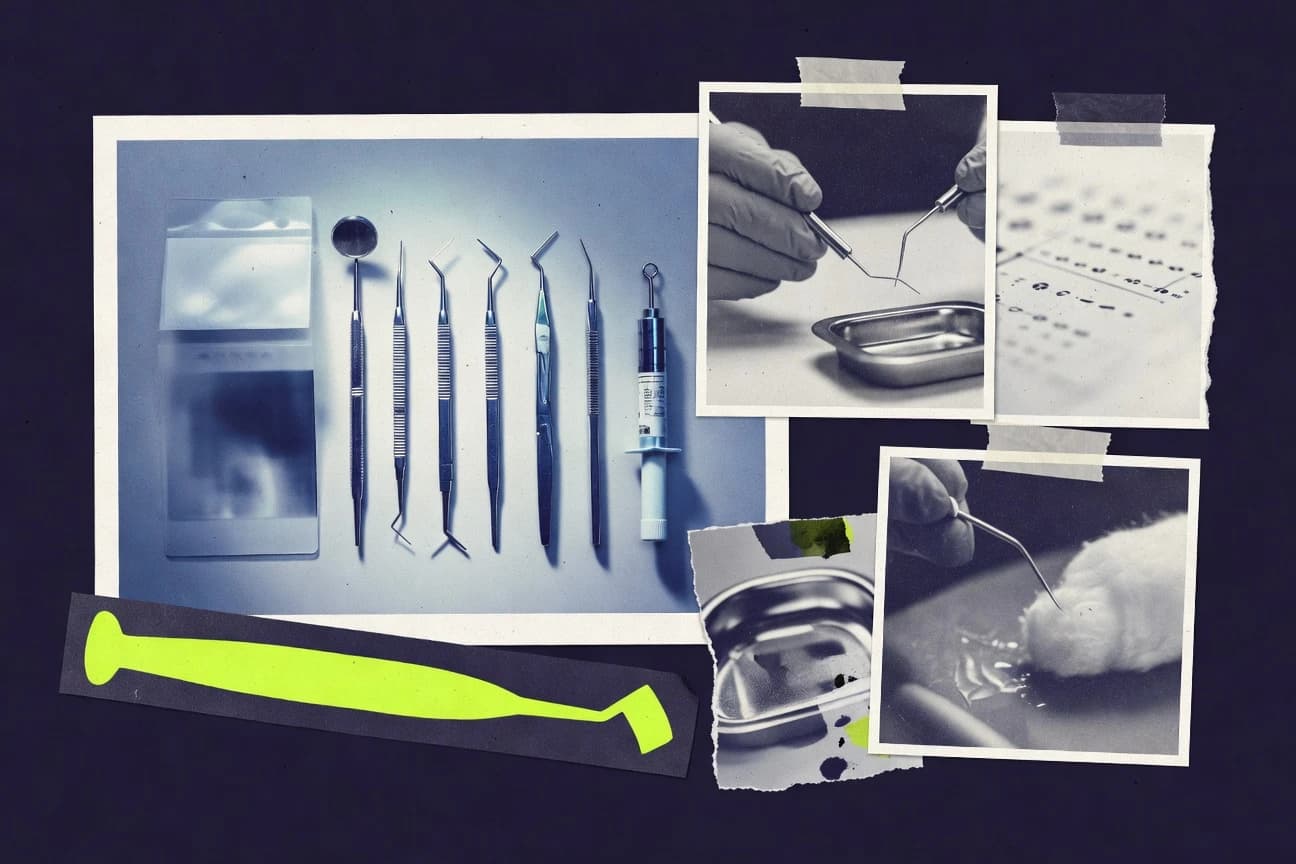
Dental School Statistics
Accepted applicants to U.S. dental schools averaged a 3.59 overall GPA and a 20.8 DAT Academic score in 2023, while 26,549 students enrolled nationwide and the NBDE Part I pass rate hit 96.2% on the first try. Tuition climbs from $40,910 in-state to $68,112 out-of-state at public schools, yet 92% of graduates moved into private practice with an average starting salary of $185,000 in 2023.

Statistics · 2026
Gap Years Statistics
With travel and training costs still climbing, the latest benchmarking shows US airfares up 8.1% year over year in 2024 and EU accommodation and package tour prices up 5.3% in 2024, yet gap year experiences still line up with measurable gains like a pooled employability effect size of 0.36 and a 0.62 jump in cultural intelligence. If you have ever wondered whether a break from school is just a lifestyle detour or a structured pathway to better self regulation, wellbeing, and skills, this statistics page sets the case with the numbers.

Statistics · 2026
Educational Statistics
Nearly every child worldwide now has basic mobile-cellular coverage, yet learning outcomes still lag, with global learning poverty estimated at 70% in low and middle-income countries. Track how education spending and EdTech markets are scaling, from the 2024 global digital learning market forecast to evidence on tutoring and adaptive software that can shift learning by fractions of a standard deviation.

Statistics · 2026
Admission Statistics
For the Class of 2027, Harvard admitted just 3.41% of 61,220 applicants and Stanford admitted 2,075 of 56,378 with a 3.68% acceptance rate, while MIT sat in the middle at 6.55% for 20,075 applications. From exploding application volumes to the SAT ranges and shifting demographics behind fall 2022 enrollments, this page puts admission math and context side by side so you can see where selectivity is tightening and why.

Statistics · 2026
Student Sleep Statistics
College and teen sleep is not just about feeling tired. With 55.4% of U.S. college students reporting insomnia symptoms and 31.4% getting 6 hours or less, the page connects tight sleep schedules to learning, mental health, and even reaction time while highlighting what actually works, from school start time policy shifts of 30 minutes or more to CBT I gains that cut insomnia severity by 9.2 points in a trial.

Statistics · 2026
High School Dropout Statistics
Even after you account for how many students fall off track, the stakes stay sharp, including 16.5% of U.S. youth ages 16 to 24 who were not enrolled and had not completed high school in 2022 and a 62.0% labor force participation rate among high school dropouts in 2023. This page connects the warning signs such as long term suspension, bullying, and homelessness to concrete consequences like about 28% lower lifetime earnings and a $1.2 trillion social cost, then highlights what has worked best, from Check and Connect to targeted mentoring and attendance supports.

Statistics · 2026
Academic Burnout Statistics
Nearly 71% of U.S. medical students surveyed in 2019 to 2020 reported at least one burnout symptom, yet pooled estimates across studies still cluster around one in three to two in five for core dimensions and related burnout-like experiences. This page connects the dots between burnout and real academic consequences like depression, disengagement, lower performance, and the interventions that actually move the needle, from mindfulness and organizational workload changes to advising and early-alert systems.

Statistics · 2026
High School Graduation Statistics
Chronic absenteeism can cut graduation odds by 20 percent and students with 30 or more absences graduate at only a 55 percent rate compared with 90 percent for regular attenders, even as the national adjusted cohort graduation rate reached 87 percent in 2021-22 and COVID pulled it down to 86 percent in 2020-21. This page connects attendance, poverty, and English learner outcomes to state results like California at 87.2 percent and Texas at 90 percent, showing how small attendance gaps can become life changing for graduation.

Statistics · 2026
Clep Exam Statistics
CLEP exams are still $93 per test as of January 2023, but the real story is the value shift that keeps showing up with 85% of employers recognizing CLEP credits and test takers saving an average $936 per exam on tuition and fees. From a 76% overall pass rate in 2022 to military taking 45% of all 456,000 exams, the stats also break down exactly how Biology, Calculus, and College Composition perform and what that means for your time and outcomes.

Statistics · 2026
Dat Statistics
See how 73% of organizations report data governance is an active initiative and 78% prioritize data integration in 2024 alongside the operational reality of faster delivery, including 60% less time spent on data debugging when manual validation is removed. Dat stitches these priorities to day to day execution, from cataloging at 67% adoption to quality checks and lineage work reaching 65% and 56% by 2024.

Statistics · 2026
Gap Year Benefits Statistics
With 2025 figures showing how gap years can translate into real outcomes, Gap Year Benefits breaks down the statistics that most students miss. See the surprising gap between intentions and results so you can decide if taking a year off is helping you move forward or just delaying the inevitable.

Statistics · 2026
Harvard Admissions Statistics
See how Harvard admissions statistics in 2026 reshape the picture of who gets in, with concrete signals that shift year to year rather than staying conveniently stable. If you are planning your application, these updated benchmarks help you interpret competitiveness with less guesswork and more clarity.

Statistics · 2026
Attendance Statistics
See how attendance is rebounding unevenly across schools worldwide, from Japan’s near universal compulsory enrollment of 99.8% to the US where 91.2% average daily attendance still sits 3.8% below pre COVID levels. We also flag what is driving the gaps, like the UK’s 23.2% of pupils missing 10% or more sessions and chronic absenteeism patterns that ripple into outcomes such as South Africa’s 85.6% matriculant attendance in Q4 2023.