
Market data
Cybersecurity Information Security
Explore verified cybersecurity information security statistics and market research reports with sourced data and trend analysis.
Latest update:
 Karl Becker
Online Identity Theft Statistics
Online Identity Theft is moving faster than most people expect, with 2025 loss totals and incident counts showing a sharp jump that makes “it won’t happen to me” feel dangerously outdated. These statistics break down exactly how fraudsters convert stolen identities into real financial damage, so you can spot the patterns before they become your problem.
Password Breach Statistics
Password Breach statistics are shifting fast, and the most recent figures show how stolen credentials keep outpacing simple password hygiene in 2025. The page breaks down what’s driving the jump and where organizations still misjudge risk, so you can spot the weak point before it becomes the headline.

Email Phishing Statistics
Even with Google blocking 99.99% of phishing attempts before they reach users, phishing still fuels billion dollar losses and breaches by way of social engineering, with 3.4 billion phishing emails hitting inboxes every day. This page pulls together the latest reported measures of employee click behavior, delivery and detection rates, and the controls that actually cut risk, so you can see exactly where defenses hold and where they quietly fail.
Computer Crime Statistics
See how Computer Crime trends shifted in 2025, from where victims are being targeted to how fast losses are stacking up. The page pairs those headline changes with incident level patterns so you can tell what is getting worse and what is quietly improving.

Social Engineering Statistics
Most people think social engineering runs on big, obvious cons, but the statistics show it often succeeds through small, believable pressure points that blend into everyday interactions. Read this page to see the 2026 figures and the sharp shift in how attackers gain trust, so you can spot the pattern before it turns into a real breach.

Data Theft Statistics
Data Theft cases increasingly hinge on stolen credentials rather than dramatic hacks, with 2025 figures showing this pattern is driving much of the damage. See how the numbers shift from what people think happens to what actually gets exploited.

Small Business Cyber Attack Statistics
Over 40% of cyber attacks hit small businesses, and once a breach starts the damage can turn into a months long scramble, with a median business disruption of 8 weeks after a breach and an average global breach cost of $4.45 million. This page pairs Verizon DBIR threat patterns with IBM cost drivers to show how stolen credentials, phishing, and malware so often lead the way toward financial gain, ransomware, and human error.
Cybersecurity Breach Statistics
More than 35% of organizations reported a breach in the last 12 months, yet 33% of breach costs still come from detection and escalation while malware and unauthorized database access drive 44% and 48% of incidents respectively. From cloud misconfiguration and phishing gaps to the 277 day average time to identify and contain, Cybersecurity Breach distills what is changing, what is costing the most, and what controls like MFA and SIEM are actually mitigating.

Webcam Hacking Statistics
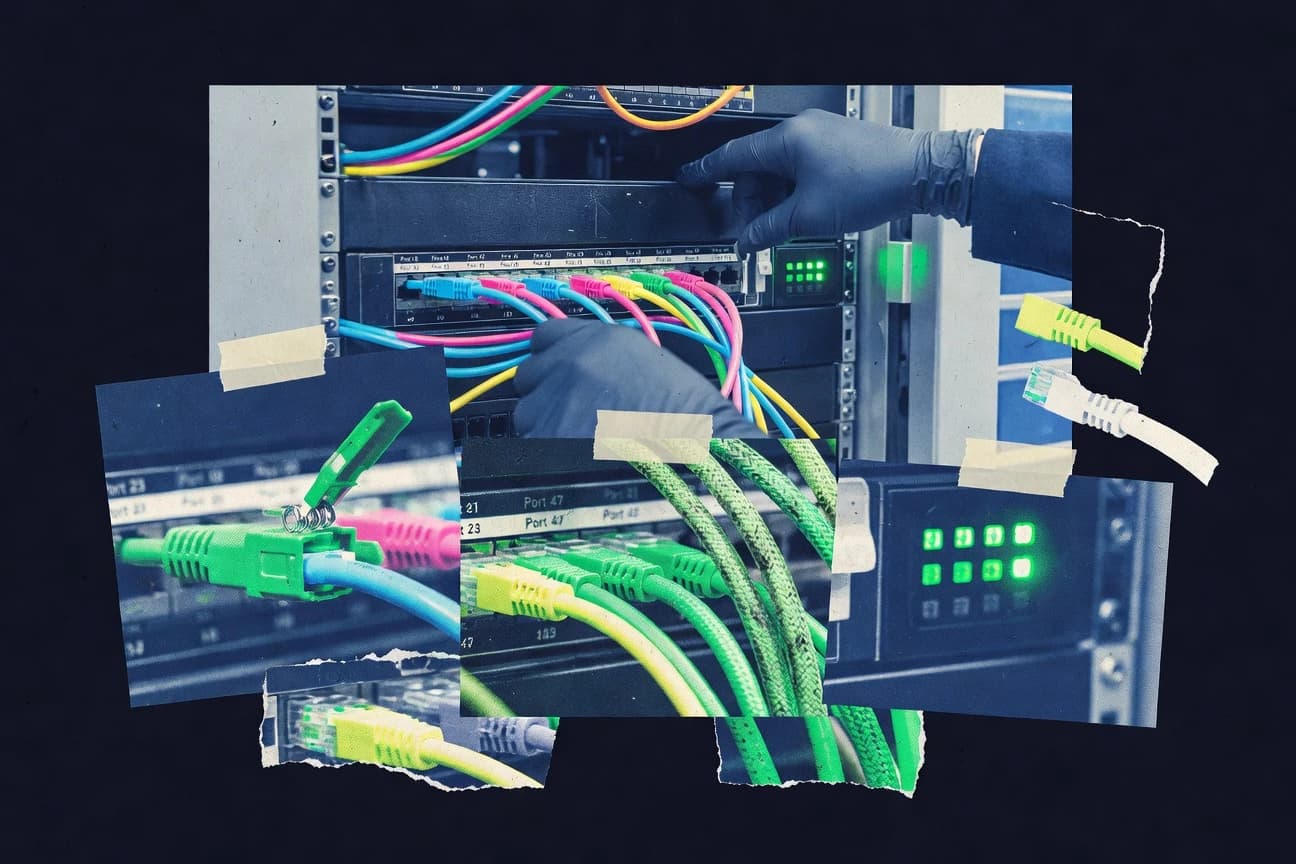
Even with 2FA stopping 85% of unauthorized access attempts and webcam covers reducing success by 92%, webcam attacks still escalated to over 1.2 million reported incidents worldwide and reached 450,000 victims in the US alone, driven by tactics like RATs at 65% and social engineering at 55%. This page breaks down the methods behind what actually gets webcams hijacked and what it costs victims, including an average $15,000 economic loss per incident and months of blackmail in 29% of cases.
Patch Management Statistics
Patch delays still turn into real break-ins, with unpatched systems blamed for an average data breach cost of $4.45 million in 2023 and recovery and downtime penalties that can run far beyond the patch window. See how incidents like Log4Shell lingering months after fixes and MOVEit driven compromise across 2,000 plus organizations sharpen the case for patch discipline, risk based prioritization, and verified deployment.

Insider Threats Statistics
An insider threat incident averages $16.2 million, with negligent cases still racking up $4.88 million and insider-driven downtime quietly costing millions when detection slips. This page pulls together the latest detection and risk gaps, including 2023 findings that 85% of organizations lack insider detection tools, so you can see exactly where expensive blind spots start and how to close them fast.
Virus And Malware Statistics
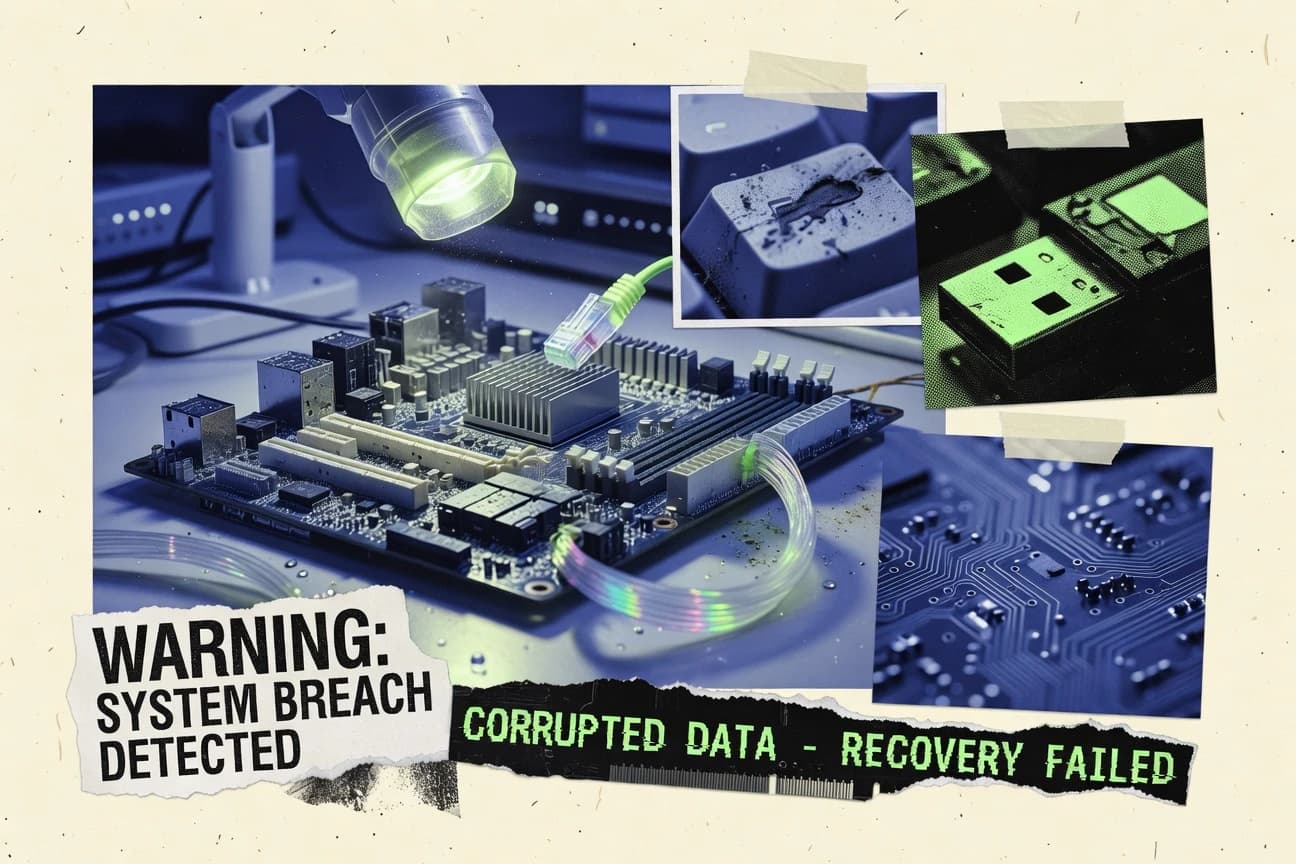
Threats are being blocked at extreme scale while human habits keep opening the door. See how 2025 projections point to a $10.5 trillion cybercrime economy and compare that with 99.9% zero day blocking, 8 minute MTTD in XDR, and 98% malicious email attachment prevention alongside the unsettling reality that 94% of malware arrives through phishing and 55% of users install pirated software bundled with malware.

Retail Data Breach Statistics
Retail data breaches are often driven by preventable points of failure, from 41% of incidents tied to web application attacks to 44% of entry points stemming from software vulnerabilities. The stakes are just as sharp on the human and operational side, where stolen credentials appear in 24% of breaches and the average retail breach takes 201 days to identify, so the patterns behind detection and downtime can cost far more than a headline suggests.

Cyber Security Industry Statistics
Cybercrime is scaling fast enough to feel industrial, with costs projected to climb to $10.5 trillion annually by 2025, while Verizon reports phishing as the top breach driver at 36% and ransomware victims are now counted in the thousands each week. Even staffing is lagging the threat pace, leaving a 3.4 million global workforce gap in 2023 as Verizon and Verizon scale up external actor risks and breach complexity, so this page is essential for anyone trying to understand what is changing fastest and what it means for 2025 readiness.

Security Awareness Training Statistics
Security awareness training isn’t just a checkbox, it can cut ransomware and breach costs fast. With phishing simulations now showing a 4.5% steady state click rate and breaches averaging $4.45M yet mitigated by 50% through SAT, this page connects regulatory pressure to measurable risk reduction, including a 62% audit pass boost and the ROI math behind programs that cost about $50 to $100 per employee per year.
Multifactor Authentication Statistics
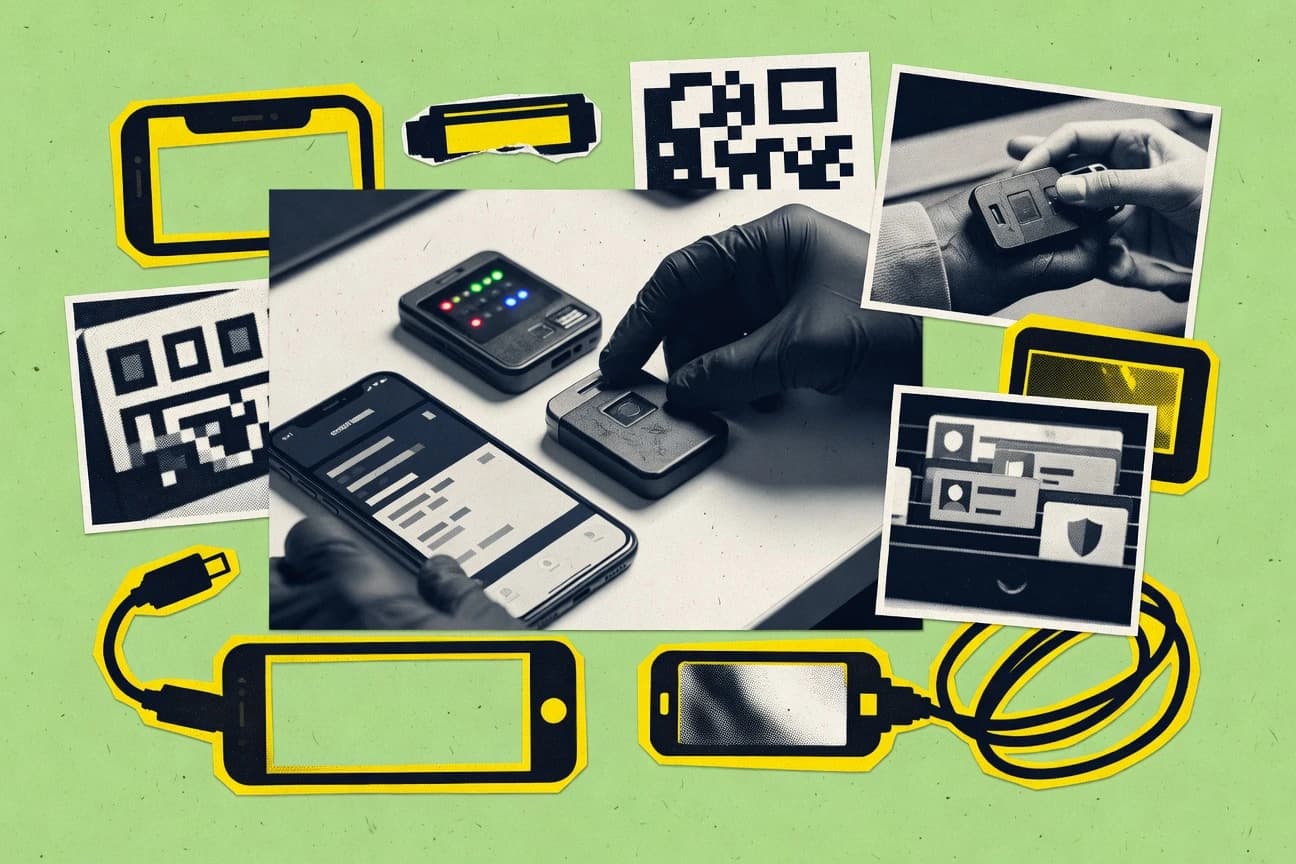
MFA is blocking attacks at an intensity organizations are starting to rely on, with 88% of phishing led breaches halted when MFA is used. At the same time, adoption gaps remain painful, from only 49% of global internet users securing personal accounts to 25% of users abandoning logins due to MFA friction, which makes this page essential for understanding both security gains and real world user impact.

Cybersecurity In The Casino Industry Statistics
With 55% of attacks using social engineering tactics in 2024 and 92% of US casinos using multi factor authentication by 2024, the gap between “protected” and “actually secure” is startling. This page connects real breach and disruption patterns from MGM style ransomware to credential stuffing and malware campaigns, so you can see exactly what criminals are targeting in iGaming and why resilience is getting harder, not easier.

Cloud Security Statistics
Cloud security is getting funded faster, but breaches are getting more expensive. With the average cloud data breach costing $4.45 million in 2023 and global cloud spend projected to reach a $103B security market by 2028 at a 14.7% CAGR, this page connects budgets, cloud misconfigurations, and the security controls that are struggling to keep up across public, multi cloud, and hybrid environments.

Retail Cybersecurity Statistics
Retail budgets climbed 9% on average in 2023 while 65% of retailers still fall short of PCI DSS 4.0, and ransomware and stolen credentials keep turning basic gaps into million dollar events. This page brings together the security and fraud pressures hitting stores right now, from 48% struggling with remote worker monitoring to 77% being hit by ransomware in 2022, so you can spot what is actually blocking safer checkout, safer cloud, and safer third party relationships.
Multi Factor Authentication Statistics
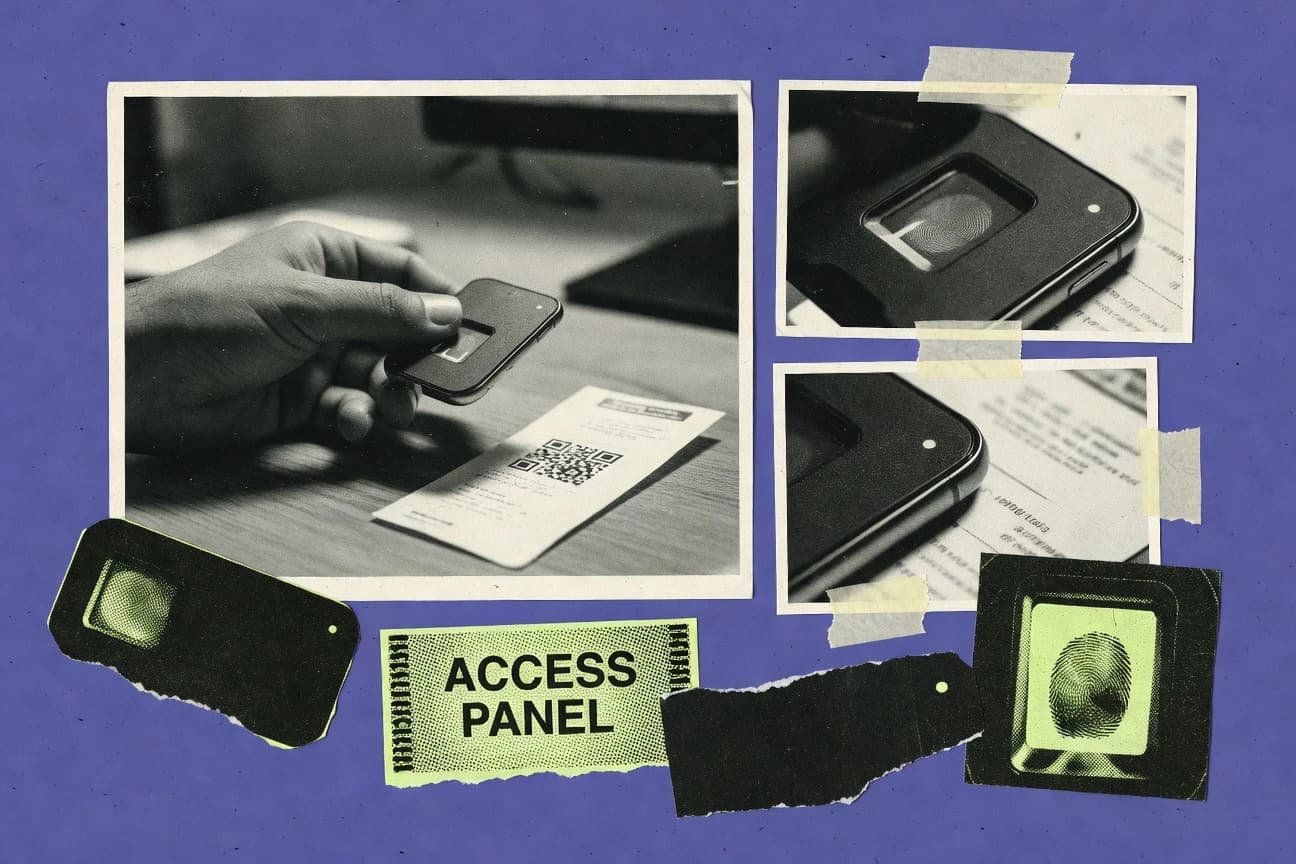
MFA adoption is still climbing, with 68% of enterprises using it in 2023 and MFA software holding 42% of the market, even as attackers increasingly try to slip past weak handoffs like stolen credentials and MFA bypass tactics. Read the statistics to see how protections are working in the real world, where MFA cut account takeover success by 99.9% in tested environments and helpdesk friction and MFA fatigue remain the tradeoff that organizations are racing to solve.