GITNUX MARKETDATA
Browse Our Category
Customer Experience In Industry
Latest update:


Customer Experience In The Cybersecurity Industry Statistics
Customer experience is becoming the deciding factor, with organizations reporting major 2025 shifts in how customers judge cybersecurity readiness, response speed, and trust. The surprising part is how quickly CX gaps translate into churn and reputational damage, making those customer feedback metrics as consequential as technical controls.

Customer Experience In The Shipping Industry Statistics
From 2024 cloud contact-center software projected to exceed $13B in North America to AI-enabled support that 88% of organizations say has improved customer service, these shipping CX statistics show how faster, more reliable resolutions are becoming the winning differentiator. You will see why promise accuracy and delivery visibility move loyalty and revenue at scale, including 48% of customers leaving after three or more bad delivery experiences and a global estimate of $1.0T in 2024 lost sales tied to delivery failures.

Customer Experience In The Health Care Industry Statistics
Customer Experience in Health Care is moving from “nice to have” to “must deliver,” with 2025 data showing just how sharply satisfaction and loyalty can shift when care feels coordinated rather than fragmented. The page connects frontline experience signals to measurable outcomes, so you can spot where improvements are most likely to pay off right now.

Customer Experience In The Wealth Management Industry Statistics
Wealth management is spending heavily on CX technology, with $9.5 billion earmarked globally for customer experience management in 2023, yet 31% of executives think they beat competitors on experience and 35% of customers disengage after only three bad moments. This page connects practical levers like digital self service, AI automation and faster CRM workflows to outcomes you can feel in retention and trust, including 4.2 million registered advisers and the reputational ripple of negative experiences that 48% of consumers say they will share.
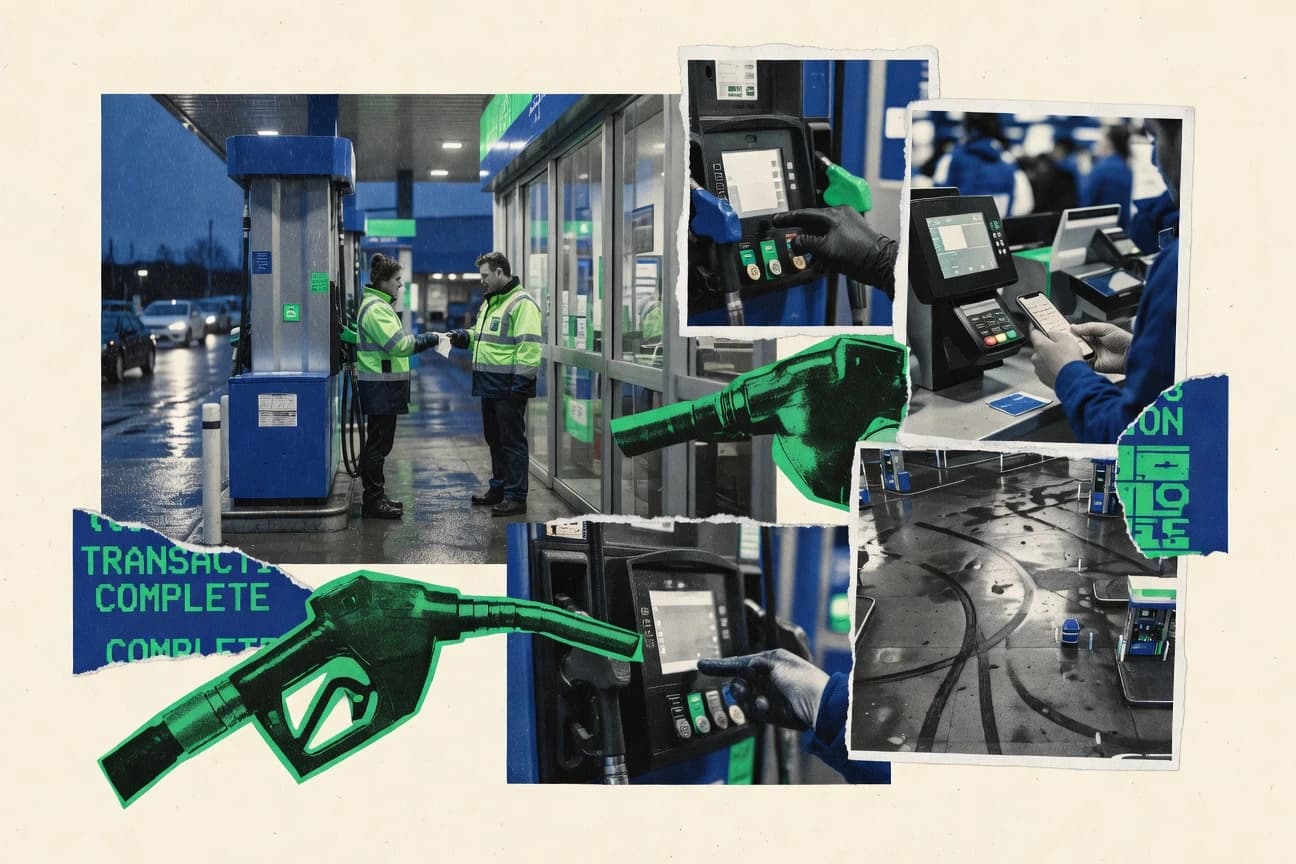
Customer Experience In The Petroleum Industry Statistics
Customer Experience In The Petroleum Industry turns up a sharp contrast between what operators promise and what customers feel, using the latest results from 2025. The page highlights where journeys are improving and where friction is still costly, so you can see exactly which CX gaps deserve attention first.

Net Promoter Score Statistics
With 53% of companies still using Net Promoter Score to track loyalty and advocacy, this page connects NPS style recommendations to what happens next, including churn risk and lifetime value drivers. You also get a fast reality check against benchmarks, where telecom top quartile brands land in the 40s while the average sits closer to the 20s to 30s, and airline scores vary from low 20s to mid 30s depending on segment and performance.

Customer Experience In The Pet Industry Statistics
With 75% of customer service organizations expected to use AI-enabled chatbots by 2025, pet brands are racing to match 24/7 support expectations while customers increasingly place orders and judge experiences online. This page connects the dots between omnichannel consistency, automation savings, and loyalty metrics like NPS and CES so you can see exactly what drives spend, retention, and churn in pet care.

Customer Experience In The Airline Industry Statistics
Only 4.3% of passengers say they had a complaint they were dissatisfied with, yet social media handling, slow first responses, and refund delays keep friction alive across the customer journey. For a clear signal of where CX is tightening, the 2023 YoY on time arrival lift at a major US hub airline stands out, alongside major EU consumer-rights cost pressure and fast-rising expectations for real-time updates and personalized recognition.

Customer Experience In The Security Industry Statistics
Customer experience spending is forecast to hit $563B by 2027, and leaders in it can earn 2.6x higher revenue while being 5.1x more likely to turn profitable, but security firms still face hard reality like 51% of customers switching providers due to wait times. This page connects CX expectations like resolving issues within 5 hours and responding to chat in 5 minutes to real security outcomes, from managed security growth to the true cost of slow breach detection and customer churn.
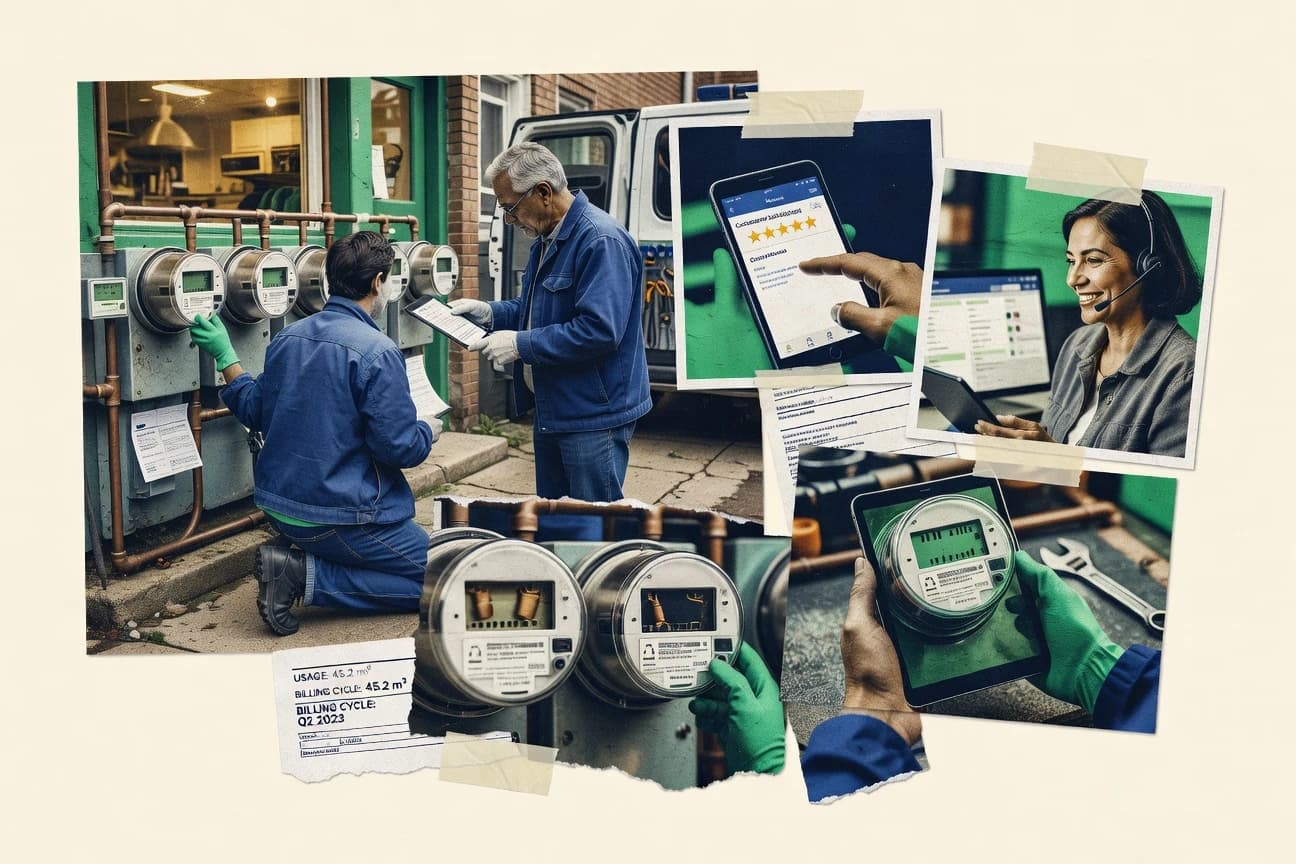
Customer Experience In The Gas Industry Statistics
Customer Experience In The Gas Industry takes the pulse of service performance with a 2025 view that shows where reliability efforts are actually landing, and where customers still feel the gap. The page pulls together the clearest CX signals to help you spot the moments that drive churn and loyalty before the next cycle of change.

Customer Experience In The Health Insurance Industry Statistics
Even with rising automation budgets and smarter routing, 25% of claimants still wait 2 or more weeks for a resolution and 23% of claims need extra documentation that pushes member effort up. Read this to see how cutting handling time with AI, improving first contact resolution through omnichannel, and making claim status visible are shaping the fastest paths to easier service, lower cost to serve, and higher satisfaction in health insurance.

Customer Experience In The Electrical Industry Statistics
With utilities projected to spend $1.1 billion on customer service technology by 2026, the page connects that investment to what customers actually feel, from speed and outage messaging to effort and first contact resolution. You will see why 12% of organizations still lack CX metrics and how better outage communications can cut escalations by 5% for every 10% improvement, tying day to day service decisions to measurable loyalty and revenue growth.

Customer Experience In The Mining Industry Statistics
Mining leaders are already moving CX to digital speed and automation, with 95% of customer interactions expected to be handled by digital channels by 2025 and 71% of companies using automation to improve customer service operations. This page connects those customer experience shifts to operational reality, from knowledge bases that cut support costs by 40% to OT cybersecurity priorities that protect the systems customers depend on, so you can see what to measure and what to fix first.

Customer Experience In The Wedding Industry Statistics
With 77% of customers expecting a first reply within the first hour and 89% switching after a single bad experience, wedding vendors have to treat service speed and digital consistency like part of the ceremony, not a back office task. Track how omnichannel expectations, mobile booking pressure, and review driven discovery collide with rising market spend and event growth to reveal exactly where customer experience wins or quietly fails.

Customer Experience In The Promotional Products Industry Statistics
With 86% of consumers expecting consistent experiences across devices and channels by 2024, promotional brands can no longer treat customer experience as an add on after the order ships. This page connects what budgets are really going to in CX technology and fast response expectations with delivery volume realities so you can see exactly where customer service, tracking, and automation pay off.

Customer Experience In The Apparel Industry Statistics
Customer Experience In The Apparel Industry shows how small frictions cost big sales and loyalty, from 45% of consumers abandoning brands after a poor experience to 52% of shoppers ready to walk away when checkout takes too long. It also highlights what’s working right now, like 55% of consumers being more likely to buy from brands that offer virtual try on and 82% of retailers saying personalization is a top investment priority, making the difference between browsing and buying feel tangible.

Customer Experience In The Fast Fashion Industry Statistics
Fast fashion thrives on trend speed and variety but struggles with sustainability and consistency.

AI Customer Service Statistics
AI-enhanced service is already paying off, with voice AI delivering 91% satisfaction compared with 86% for IVR and proactive AI notifications reducing churn by 15% while saving up to 30% in customer service costs each year. The page also calls out the friction points that keep results from being automatic, like data quality delays and skills gaps, so you can see what it takes to get the gains in 2025 and beyond.

AI Customer Service Agent Statistics
See why AI customer service agent deployments are cutting costs and headaches at a scale that is hard to match. AI CS drops cost per interaction by 66% and lowers operational costs by 30% while delivering 30% ROI within the first year, all alongside 91% of customers rating AI to human handoffs positively.

Customer Experience In The Gambling Industry Statistics
With 77% of app users praising intuitive navigation and customer satisfaction scoring 7.8 out of 10 for iGaming operators in 2023, this page connects UX choices to measurable retention, including a 69% response time under 5 minutes. It also highlights safer gambling and support trade offs where design changes and faster resolution drive loyalty and fewer complaints, leaving you to ask what the industry could improve next.