GITNUX MARKETDATA
Browse Our Category
Automotive Services
Latest update:

French Auto Industry Statistics
By 2026, French auto industry production and employment are balancing a surprising shift, with export momentum and workforce pressures moving in opposite directions. Don’t just look at the totals, track how demand, output, and jobs are changing at the same time and what that tension could mean next.
Automotive Statistics
From 2025 onward, traffic fatalities per 100,000 people moved sharply, and the split between passenger cars and SUVs is getting harder to ignore. This page traces what changed in the newest numbers and what it means for drivers who think safety is improving evenly.
Japanese Auto Industry Statistics
Track how Japan’s auto industry is changing with the latest 2025 figures, from production volume to export share and EV momentum, showing where growth is accelerating and where it’s slipping. The contrast between domestic demand and overseas orders makes the direction of 2025 feel less obvious than it looks at first glance.

Atv Utv Industry Statistics
ATV Utv Industry statistics track where the money and the headwinds are moving next, with the ATV market forecast to grow at a 4.8% CAGR from 2024 to 2030 and the UTV market set to outpace that at 6.1%. You also get the practical context behind buying and building, from US PPI motor vehicle parts rising 0.3% in May 2024 and fuel price volatility shaping demand, to recalls and emissions rules that force real design and inventory decisions.
Motor Oil Industry Statistics
Motor Oil Industry statistics reveal how the market is reshaping fast, with synthetic momentum and EV pressure pushing total demand down while key players still fight for share. Valvoline leads US retail at 22% in 2023 and the synthetic segment reaches 45% of global revenue in 2023, even as global motor oil use averages 36.8 million tons in 2023 and recycling reaches 2.1 million tons of used oil in 2022 under EU rules targeting 95% recyclability by 2025.

Car Sales Statistics
New-car sales in 2025 flipped the script, with stronger demand for newer models pushing transaction prices and loan terms in opposite directions. Read the Car Sales statistics page to see exactly how 2025’s shifts in financing, incentives, and inventory changed what buyers actually paid.

Car Color Statistics
Find out which car colors are gaining ground right now and where demand is slipping, based on the latest Car Color statistics. The most surprising shift is how quickly the popularity of certain shades is changing, so you can spot the next trend before it looks obvious.
Auto Industry Statistics
Auto Industry trends just flipped in a way most headlines missed, with 2026 figures pointing to a faster reshaping of production and demand than the prior cycle. Read the page to see how the newest benchmarks line up across sales momentum, pricing pressure, and inventory realities.

Off-Road 4X4 Industry Statistics
Off-Road 4X4 Industry trends are shifting fast with 2025 figures pointing to a market that is changing how buyers choose powertrains and how brands chase demand. Read the page for the sharpest 2025 snapshot of growth, supply pressure, and model momentum that separates what shoppers want now from what the industry assumed last year.
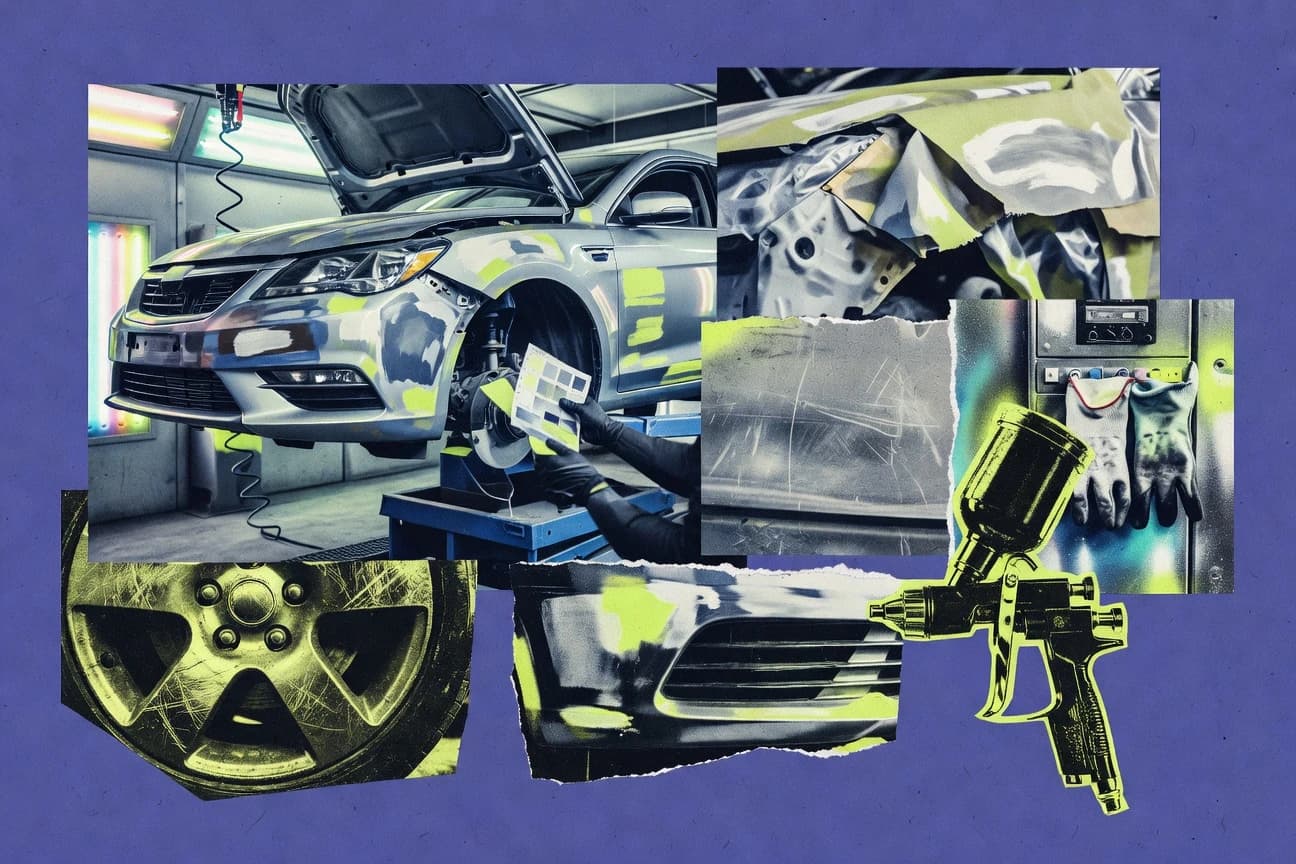
Collision Repair Industry Statistics
Collision repair demand is being reshaped by a sharp pricing and turnaround squeeze, with 2026 numbers highlighting how quickly labor and parts pressure is changing shop margins. If you want to understand what that means for estimating, production scheduling, and profitability, these Collision Repair Industry statistics put the tension front and center.

Dealer Industry Statistics
Dealer Industry statistics keep shifting faster than expected, and the latest figures show how quickly pricing, inventory pressure, and customer demand are moving in 2025 and beyond. If you run a store or advise one, these numbers help you separate short term noise from the signals that are actually reshaping performance.

Car Statistics
BEV momentum keeps surging with global battery electric vehicles taking a 26.9% share of new passenger car sales in 2023 as their growth outpaces 35% year over year in major markets, while safety tech and ownership costs reshape what buyers actually commit to, including 56% of US consumers saying they are likely to buy a battery electric vehicle. Track how electrification, charging buildout, lithium and battery pricing, and even insurance and aftermarket spending turn into real buying pressure across the US, UK, Germany, Japan, and beyond.
Truck Tire Industry Statistics
Heavy truck tire production is set to hit 2026 at about 51.27 million units, yet the market faces a sharper decision point as the average growth rate slips to roughly 3.5 percent by then. Get the tight, current stats behind where demand is going and why pricing and supply planning for commercial fleets can’t afford to assume steady wear trends.
Brazil Auto Industry Statistics
Brazil Auto Industry statistics in 2026 reveal a market shifting faster than many expected, with clearer signals on production, sales, exports, and model mix than a year ago. If you want to understand whether demand is broadening or narrowing, this is the page that puts the pressure points in sharp focus.
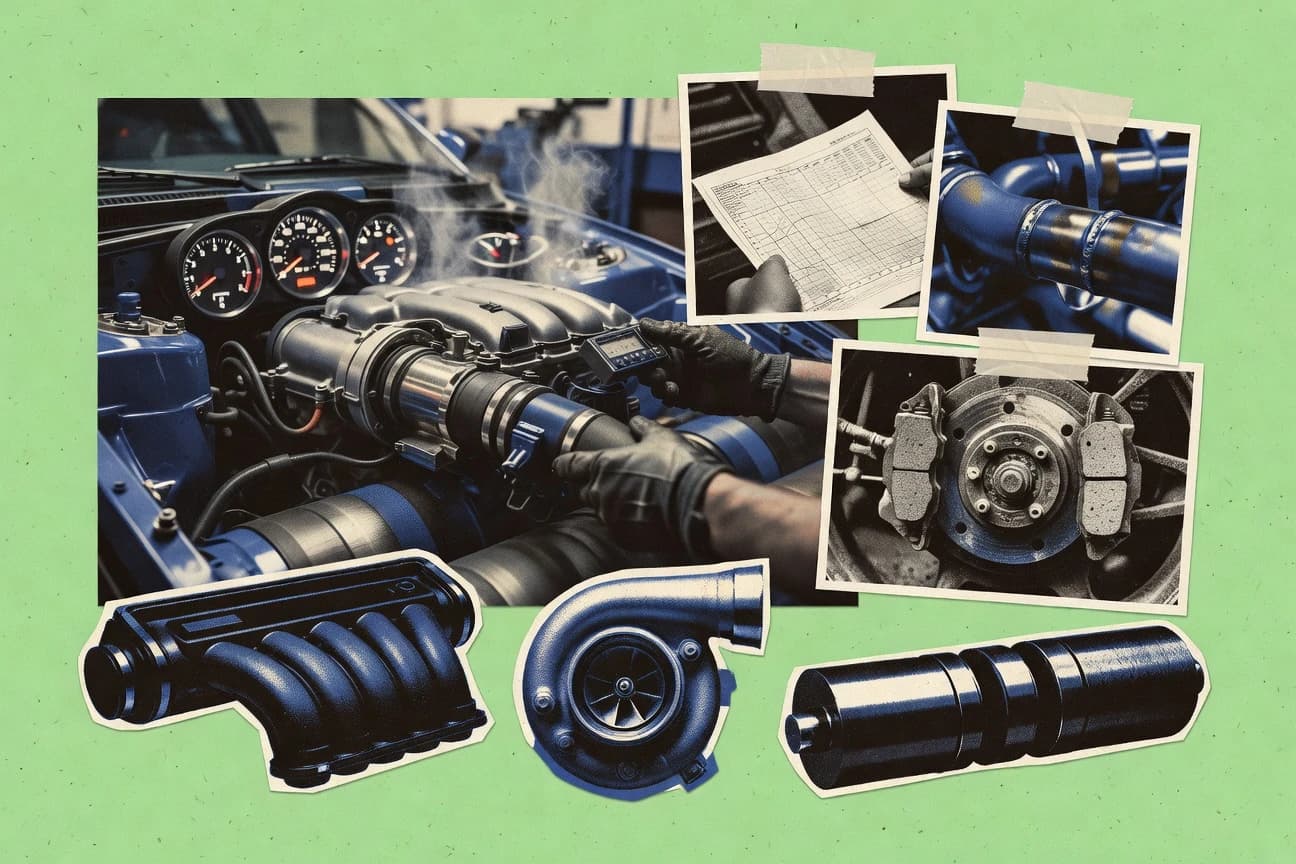
Aftermarket Performance Industry Statistics
Aftermarket Performance Industry statistics for 2025 reveal how fast performance demand is shifting from sheer horsepower to smarter upgrades, better support, and tighter sourcing. The page sets up the surprise contrast between what buyers want now and what the supply chain and shops prepared for, using the newest figures to show where margins and growth are actually forming.
Automotive Collision Repair Industry Statistics
From a projected $12.8 billion U.S. collision repair market by 2030 to 90% of repairs involving electronic-system interaction, this page explains why body shops are rebuilding more than metal. You will also see how higher used car prices lift total loss thresholds, while longer ADAS calibration and fast growing labor demand push average repair timelines to 18.7 days and reshape what customers and insurers expect.

Indonesia Ev Industry Statistics
Indonesia’s EV industry is moving fast with 2026 growth, and the latest figures show demand and charging progress tightening together instead of drifting apart. Read the page to see which metrics are accelerating most and where the gap still shows up.
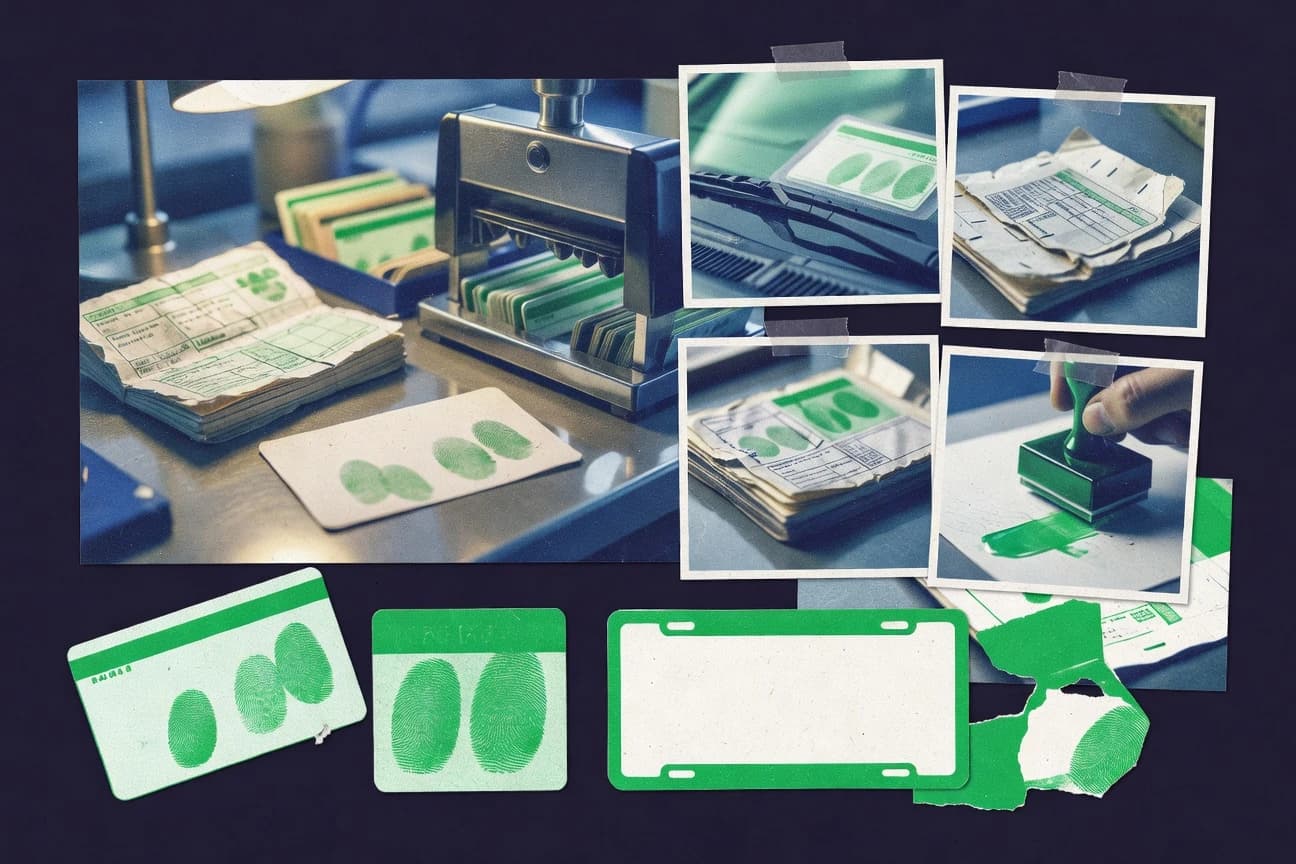
Vehicle Registration Statistics
Vehicle registration trends in 2026 reveal a notable shift in what drivers are adding to the road and what is falling behind, with fresh counts that make last year feel less stable than it looked. Read the page to see how plates, registrations, and renewals moved against each other, not just in volume but in the categories that are changing fastest.
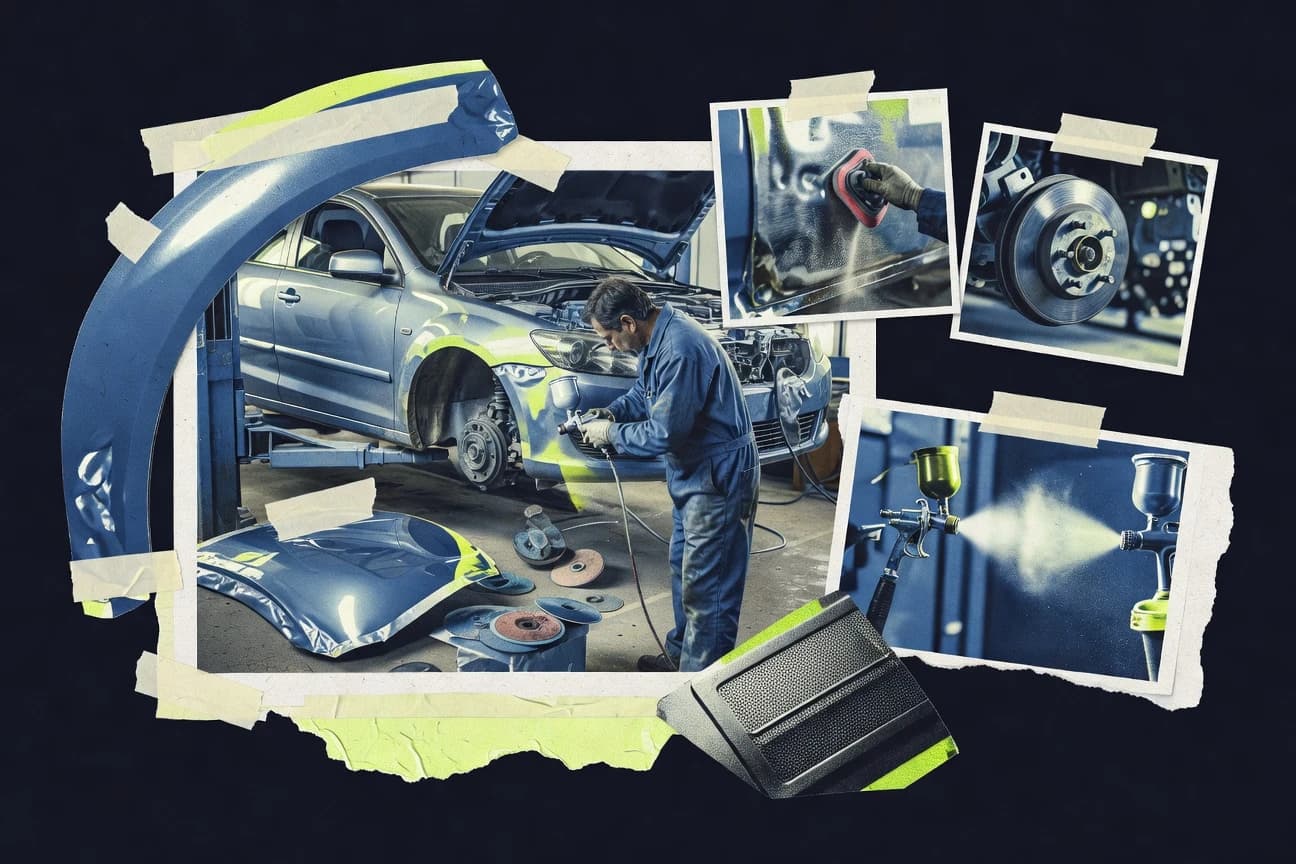
Auto Body Shop Industry Statistics
With the collision repair market projected to grow at a 7.4% CAGR from 2024 to 2030 and customer expectations rising, 68% of shops still say estimating cycle time is their key operational metric and nearly half of consumers say clear written scope reduces anxiety. You will also see where hidden costs and process drag pile up, like parts and materials at 18% of operating costs and a 12.5% average rework rate, plus what paint and labor inflation are doing to shop margins.
European Auto Industry Statistics
Battery electrics already reached 25.9% of new car sales across Europe in 2023, while Europe’s charging buildout passed 1.1 million DC fast chargers by end 2023, setting up a sharp test for whether infrastructure and policy targets can keep pace. You will also see what regulators are betting on for climate and safety at once, from €0.17 per kWh in the Netherlands and a 95% end of life recycling goal to ADAS impact figures like a 21% rear end crash reduction and eCall requirements.