GITNUX MARKETDATA
Browse Our Category
Automotive Services
Latest update:


New Car Sales Statistics
With global EV deliveries surging to 18 percent of new car sales in 2023 and US new car transaction prices averaging $48,759 in 2023, this page tracks how demand is reshaping the leaderboard. From Toyota’s 1,953,426 vehicles to Tesla’s 1.81 million deliveries and US bestsellers like the Silverado and RAV4, it turns year over year swings into a clear picture of what buyers moved toward and what they left behind.
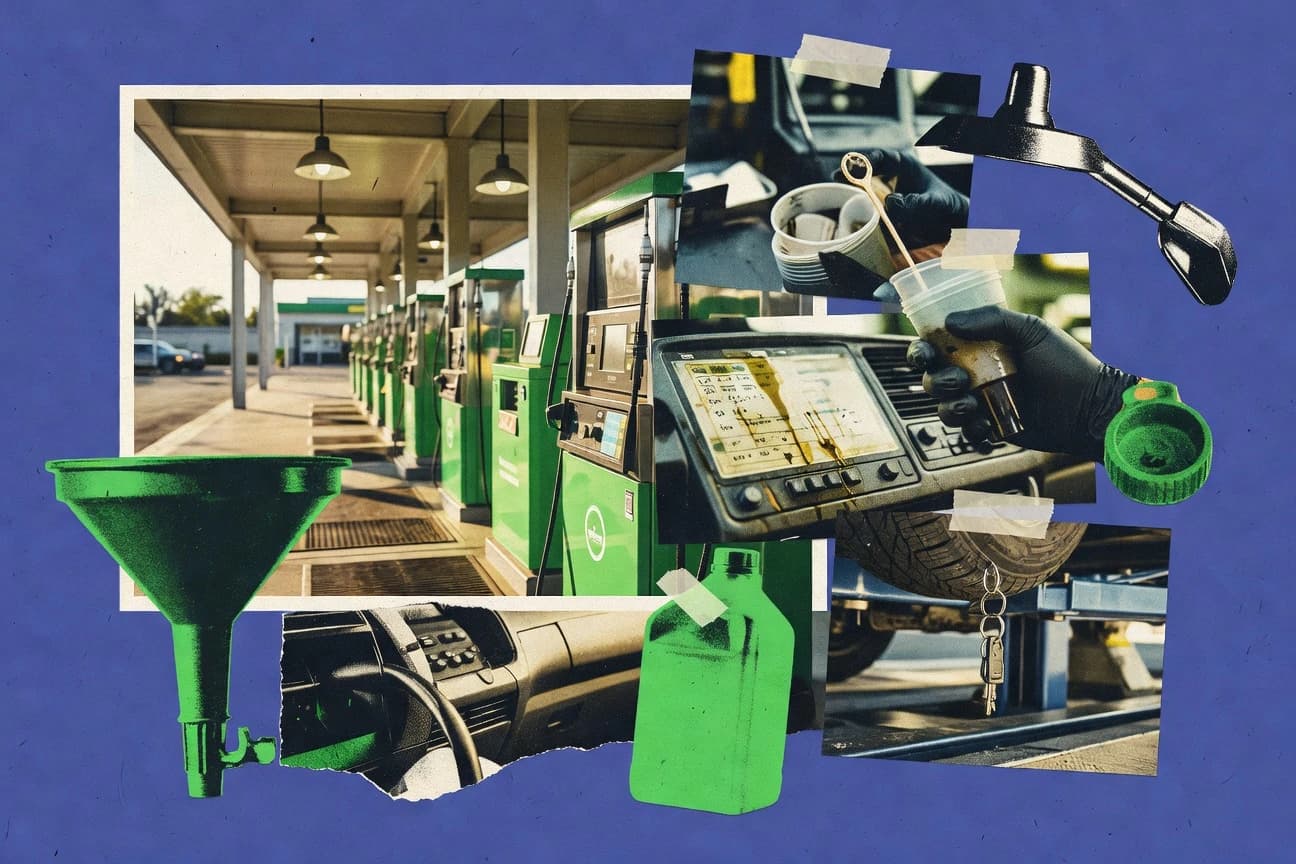
Quick Lube Industry Statistics
Quick Lube Industry statistics reveal how jobsite realities are shifting, with 2026 projections pointing to a faster lane toward change than most operators expect. Read to see which metrics are growing, which are slipping, and what that means for staffing, pricing, and throughput right now.
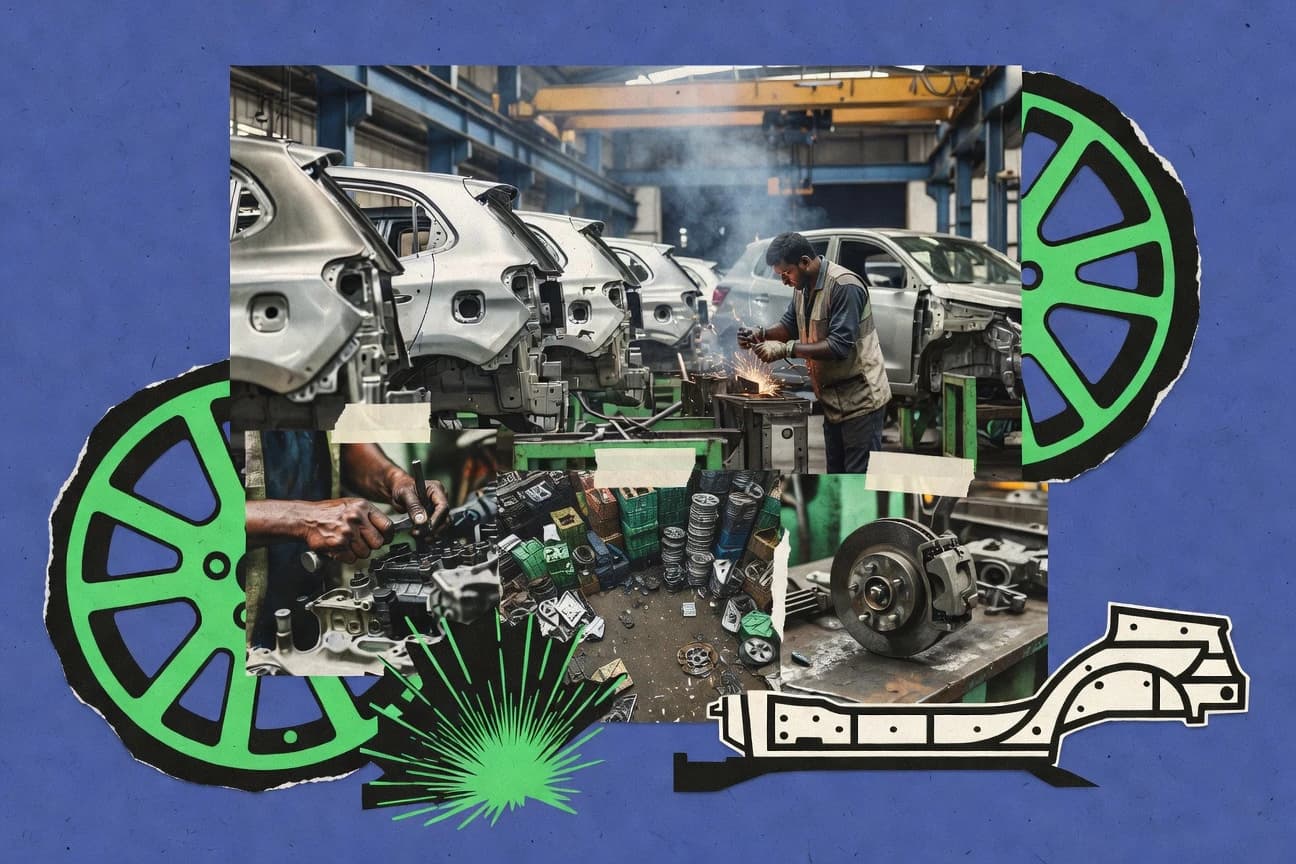
India Auto Industry Statistics
Track how India’s auto industry is shifting in 2026 with production, sales, and export trends that don’t move in lockstep. You will see where growth is accelerating and where it stalls, so you can spot the real pressure points behind the headlines.
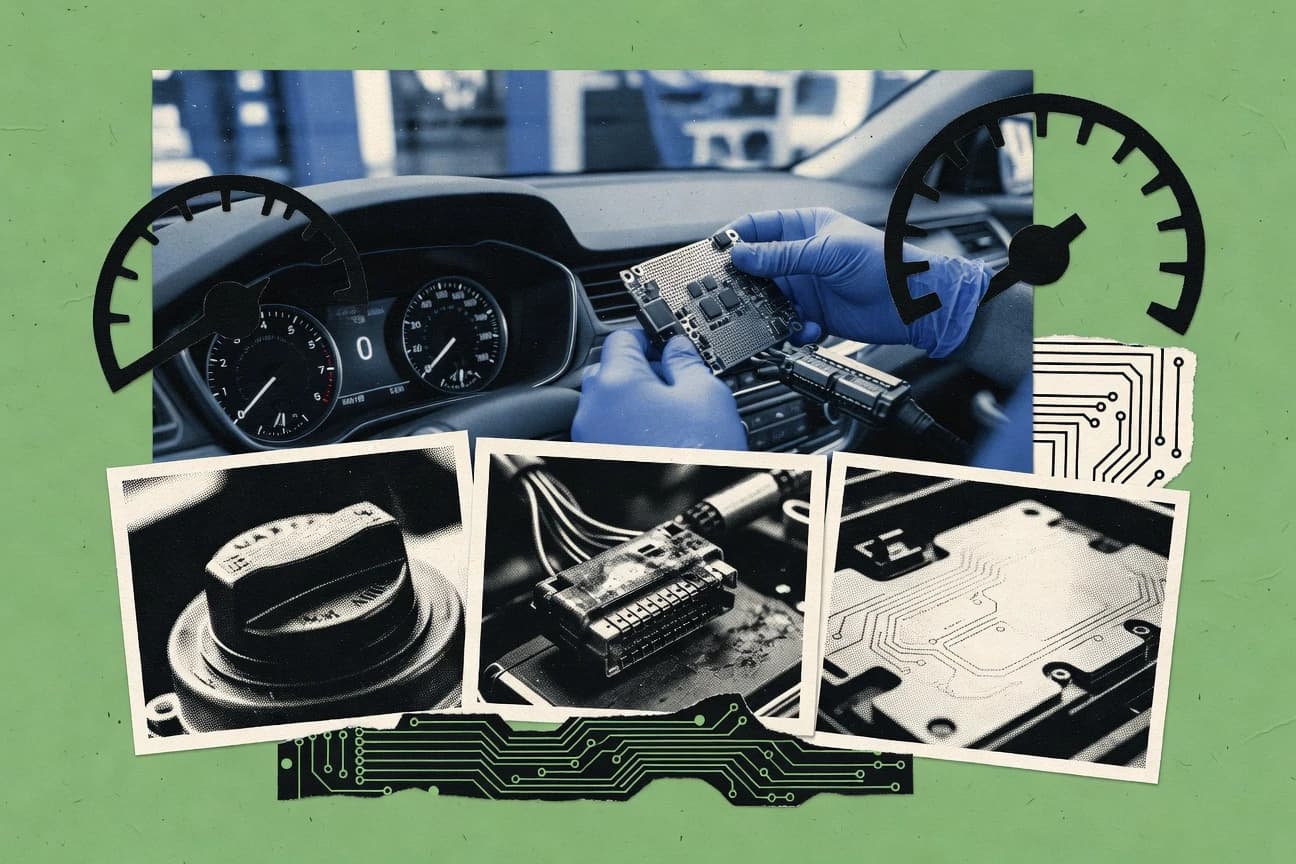
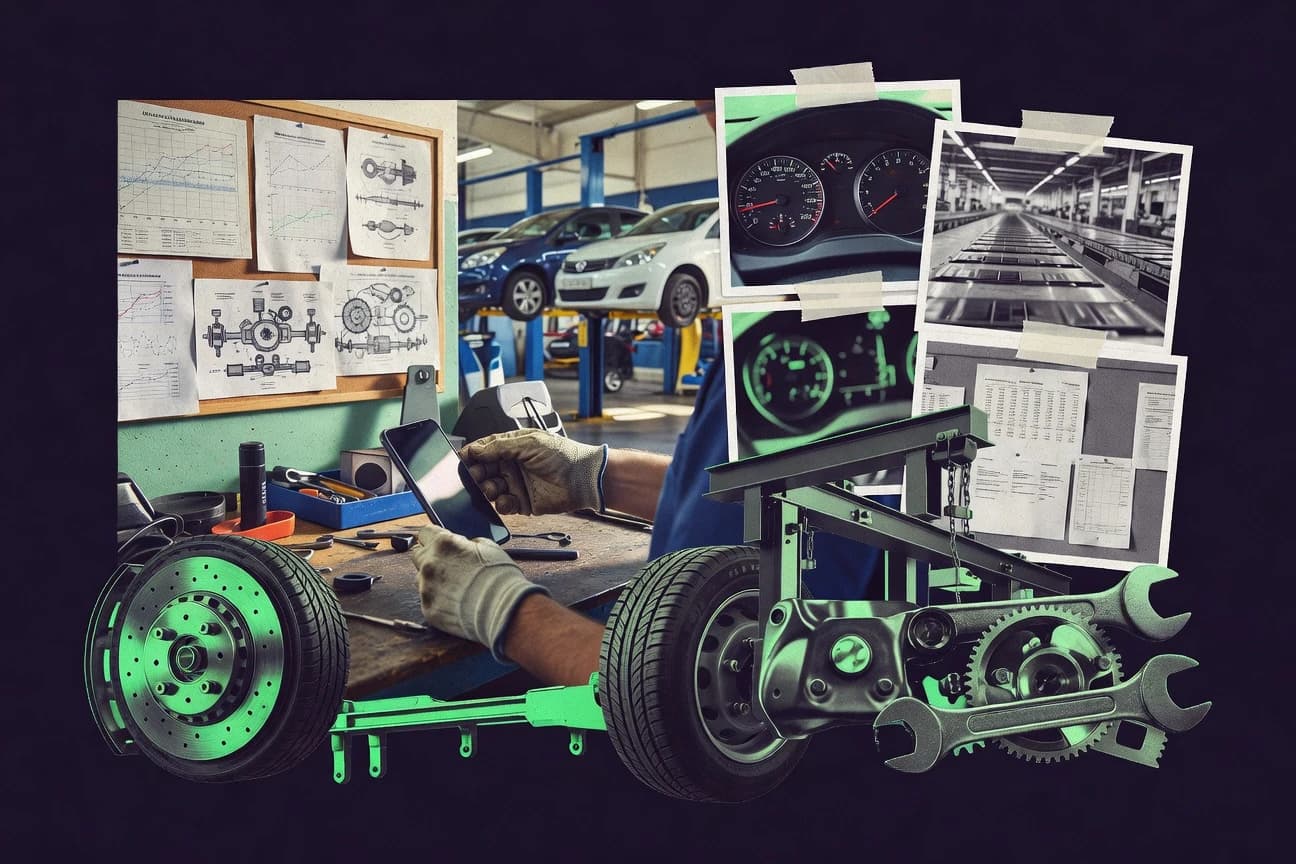
Automotive Technology Industry Statistics
The Automotive Technology Industry in 2025 is showing a clear shift from experimentation to execution, with adoption rising while costs tighten and efficiency improves. Get the key statistics behind that momentum and the pressure points shaping what automakers and suppliers decide next.
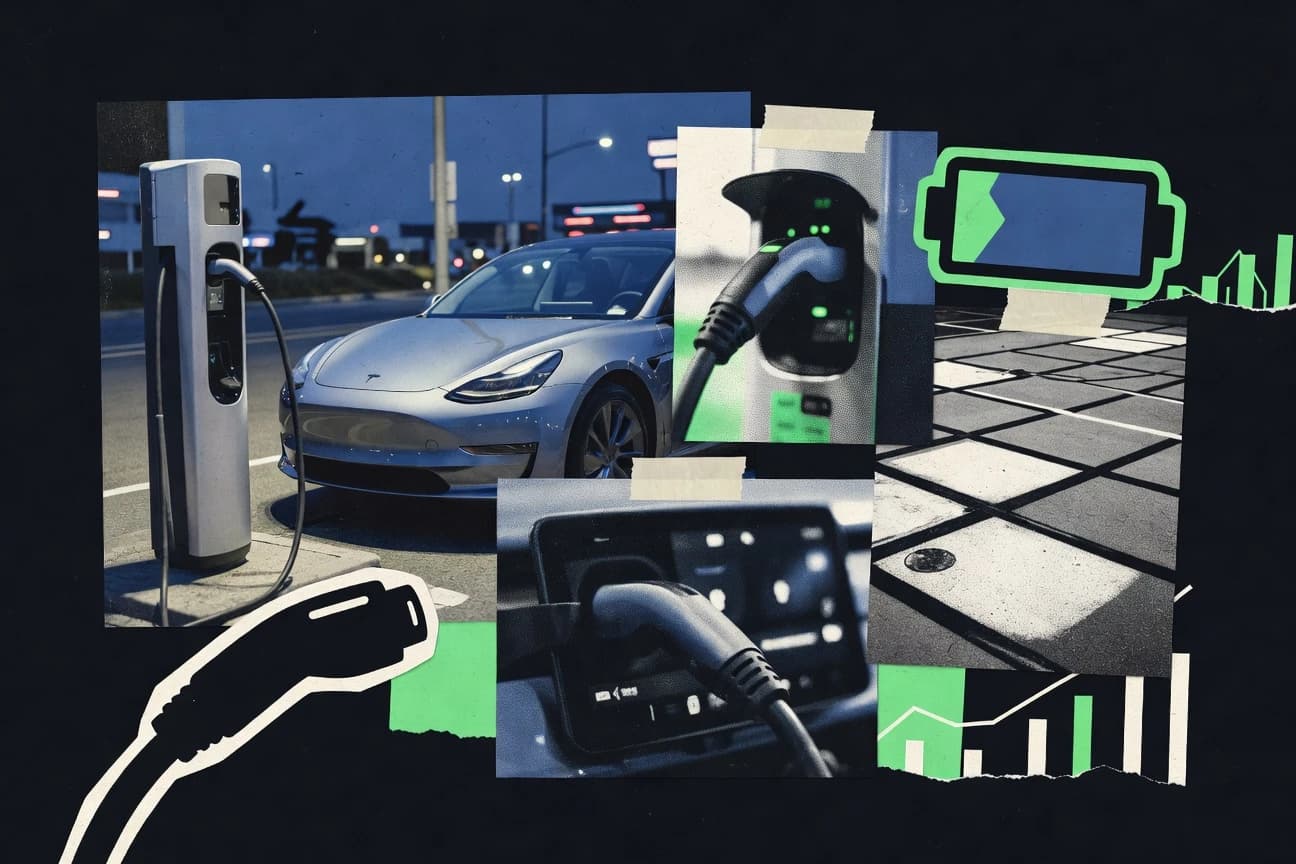
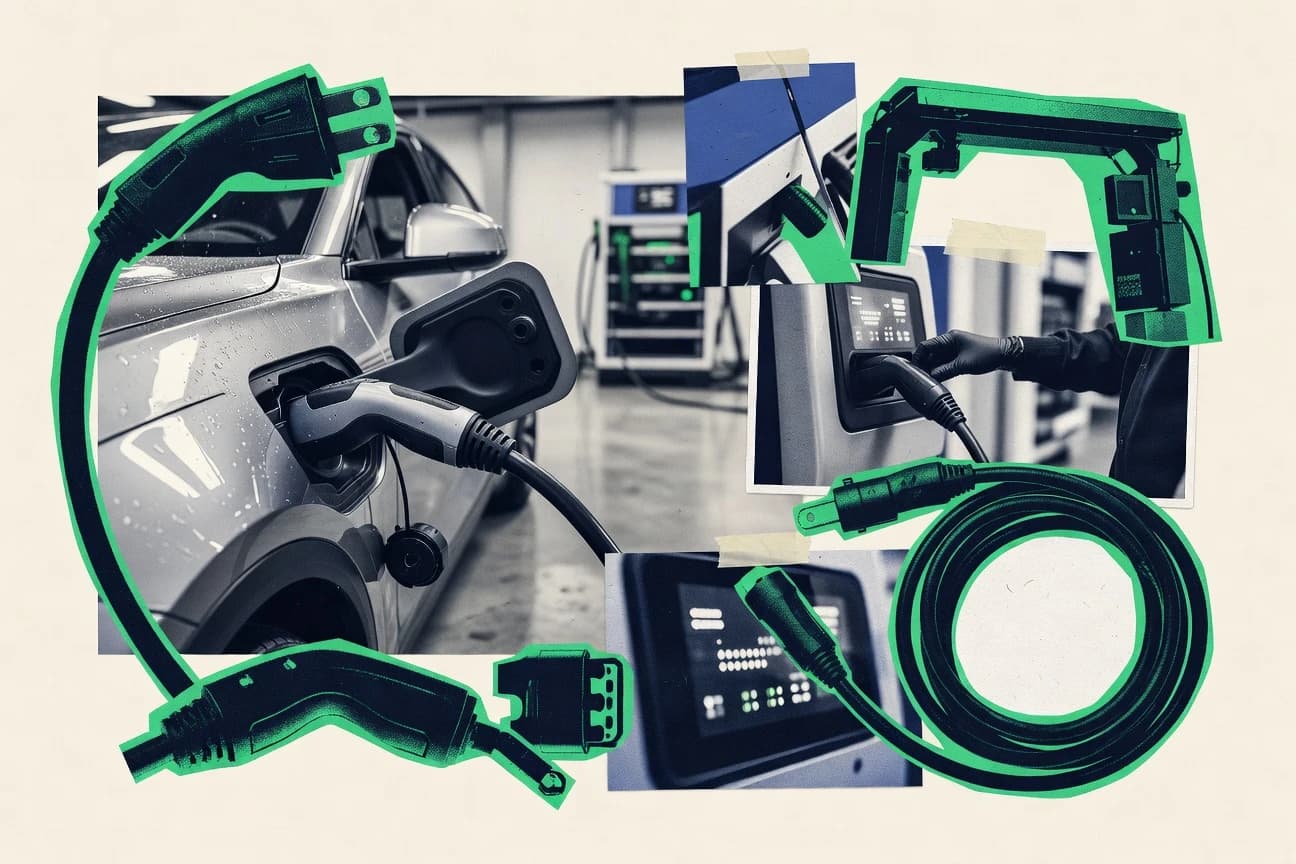
Electric Vehicle Statistics
EVs surged to about 14.0 million cars sold worldwide in 2023 and now account for a quarter of passenger car sales in key markets like Norway, while the charging network still struggles to keep up with roughly 200,000 public chargers in the US and about 2.3 million across Europe. This page maps the tradeoffs between range and grid performance, battery and charger costs, and the emissions and air quality wins that come from electrifying more than just tailpipes.
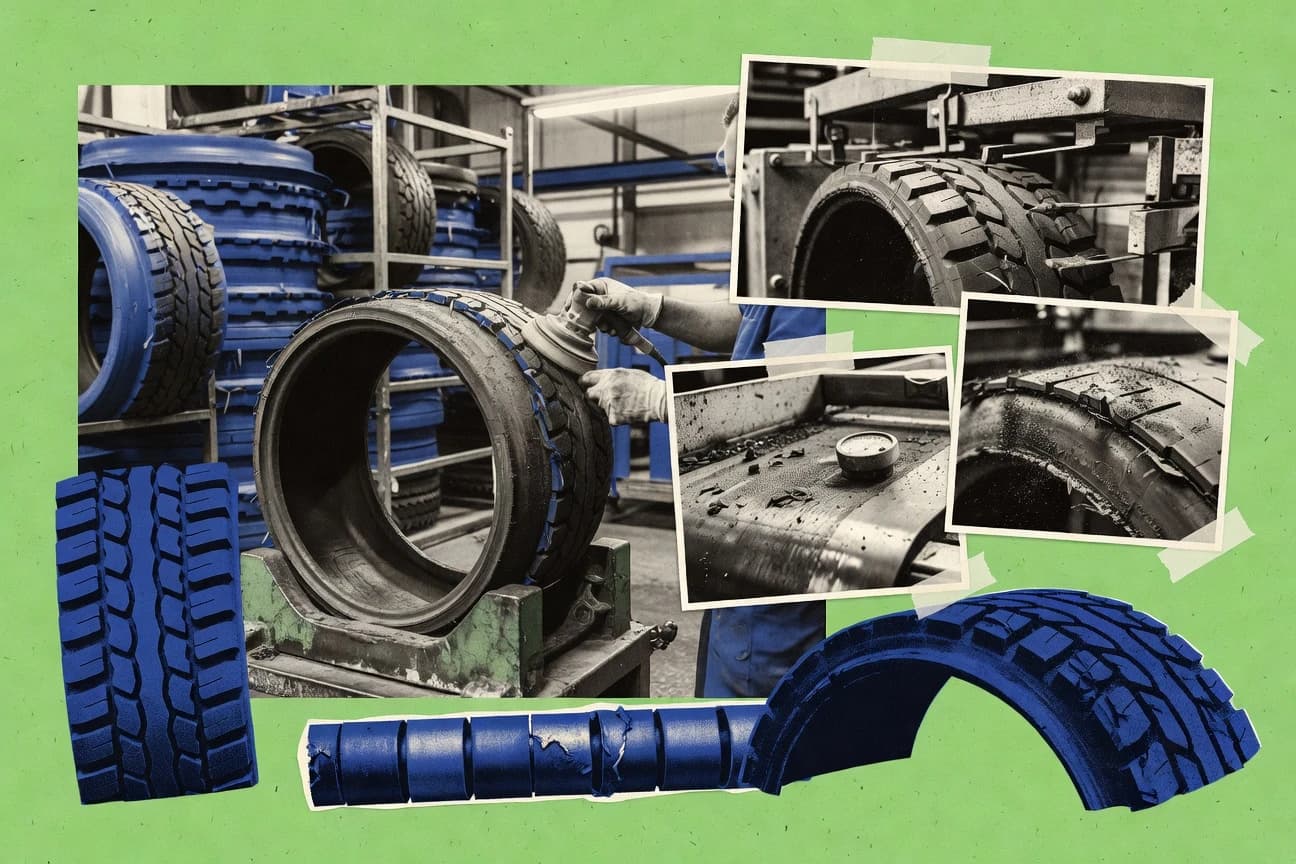
Retread Industry Statistics
Retreading is already a 8.7 billion dollar market and, when you factor the best matched casing and inspection controls, it can cut CO2e versus new tires by about 50% to 70% while delivering similar wear performance in controlled tests. The page connects EU traceability systems and waste circularity targets with US inspection realities and fleet economics so you can see why performance variability and compliance choices, not just rubber technology, decide whether retreads win or lose.

Electric Car Sales Statistics
Get the latest Electric Car Sales statistics that show how 2025 demand and pricing pressure are reshaping what people actually buy, not just what brands promise. See the sharp contrasts between sales momentum, inventory realities, and EV adoption that can turn a monthly trend into a buying decision.
Ev Automotive Industry Statistics
EV Automotive Industry numbers from 2025 show how fast the market is shifting, with production and sales moving at a pace that leaves last cycle’s assumptions behind. Get the clearest view of what that momentum is doing to costs, supply, and adoption so you can spot where the real momentum is heading next.
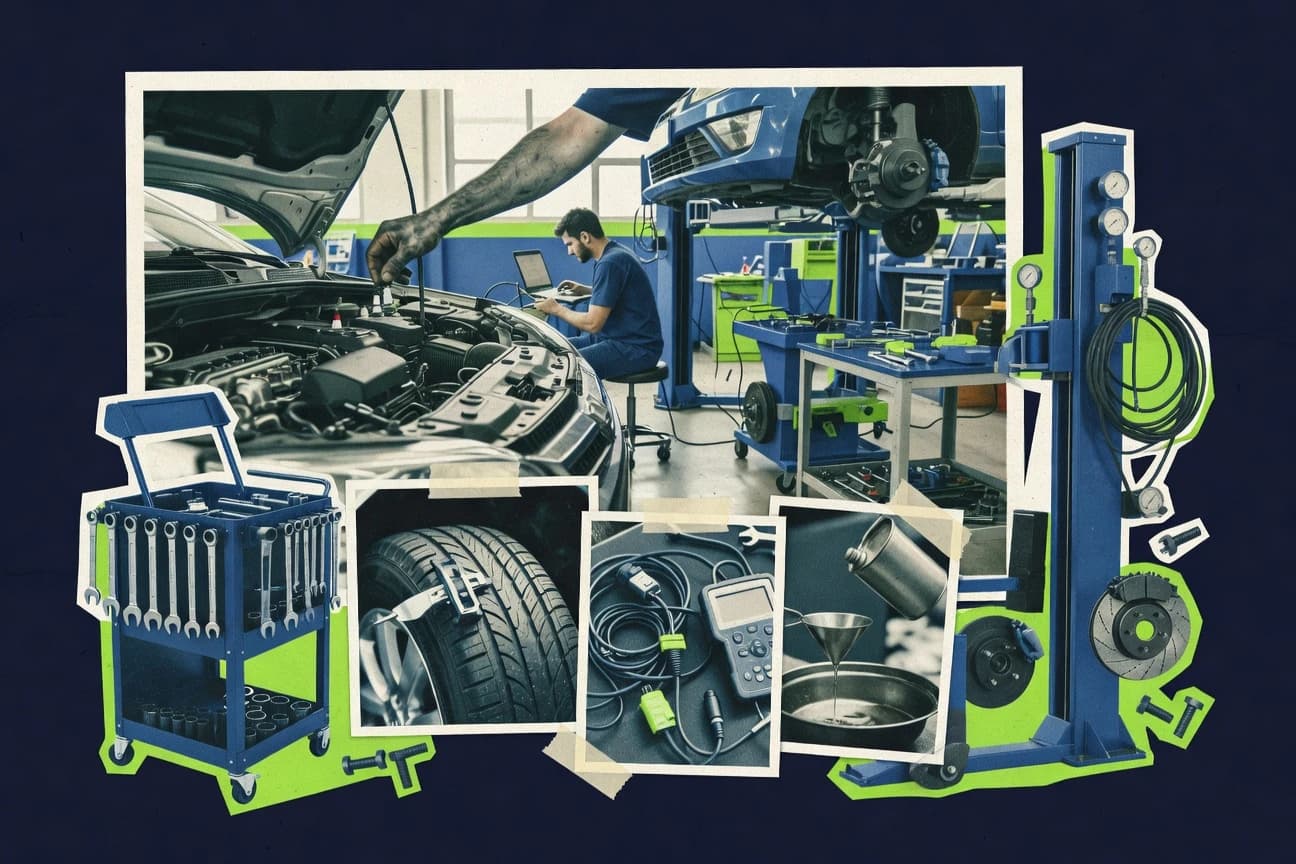
Integrated Automotive Services Industry Statistics
See how integrated automotive services are getting faster, smarter, and more measurable, from 63% of consumers using a smartphone for maintenance research or transactions to a 12% lower rework rate in collision repair driven by digital inspection and estimating. The page also connects the workforce and supply chain reality, including 5.0 million people employed in repair and maintenance and 30% fewer fleet downtime costs with telematics predictive scheduling, to the market shift that is accelerating through 2025 and beyond.

Brake Industry Statistics
Brake Industry statistics reveals how the latest 2026 figures reshuffle priorities for manufacturers and fleet operators, from performance and compliance to cost pressure across the supply chain. Don’t expect the same pattern as last year, the most current numbers show exactly where demand is tightening and where it is opening up.

Korea Ev Industry Statistics
Korea EV Industry statistics for 2026 put a sharper edge on what most people assume about the market, including a clear shift toward heavier battery supply and faster charging buildout. See the numbers side by side so you can separate momentum from hype and understand where demand and investment are actually heading next.
French Auto Industry Statistics
By 2026, French auto industry production and employment are balancing a surprising shift, with export momentum and workforce pressures moving in opposite directions. Don’t just look at the totals, track how demand, output, and jobs are changing at the same time and what that tension could mean next.
Automotive Statistics
From 2025 onward, traffic fatalities per 100,000 people moved sharply, and the split between passenger cars and SUVs is getting harder to ignore. This page traces what changed in the newest numbers and what it means for drivers who think safety is improving evenly.
Japanese Auto Industry Statistics
Track how Japan’s auto industry is changing with the latest 2025 figures, from production volume to export share and EV momentum, showing where growth is accelerating and where it’s slipping. The contrast between domestic demand and overseas orders makes the direction of 2025 feel less obvious than it looks at first glance.

Atv Utv Industry Statistics
ATV Utv Industry statistics track where the money and the headwinds are moving next, with the ATV market forecast to grow at a 4.8% CAGR from 2024 to 2030 and the UTV market set to outpace that at 6.1%. You also get the practical context behind buying and building, from US PPI motor vehicle parts rising 0.3% in May 2024 and fuel price volatility shaping demand, to recalls and emissions rules that force real design and inventory decisions.
Motor Oil Industry Statistics
Motor Oil Industry statistics reveal how the market is reshaping fast, with synthetic momentum and EV pressure pushing total demand down while key players still fight for share. Valvoline leads US retail at 22% in 2023 and the synthetic segment reaches 45% of global revenue in 2023, even as global motor oil use averages 36.8 million tons in 2023 and recycling reaches 2.1 million tons of used oil in 2022 under EU rules targeting 95% recyclability by 2025.

Car Sales Statistics
New-car sales in 2025 flipped the script, with stronger demand for newer models pushing transaction prices and loan terms in opposite directions. Read the Car Sales statistics page to see exactly how 2025’s shifts in financing, incentives, and inventory changed what buyers actually paid.

Car Color Statistics
Find out which car colors are gaining ground right now and where demand is slipping, based on the latest Car Color statistics. The most surprising shift is how quickly the popularity of certain shades is changing, so you can spot the next trend before it looks obvious.
Auto Industry Statistics
Auto Industry trends just flipped in a way most headlines missed, with 2026 figures pointing to a faster reshaping of production and demand than the prior cycle. Read the page to see how the newest benchmarks line up across sales momentum, pricing pressure, and inventory realities.

Off-Road 4X4 Industry Statistics
Off-Road 4X4 Industry trends are shifting fast with 2025 figures pointing to a market that is changing how buyers choose powertrains and how brands chase demand. Read the page for the sharpest 2025 snapshot of growth, supply pressure, and model momentum that separates what shoppers want now from what the industry assumed last year.