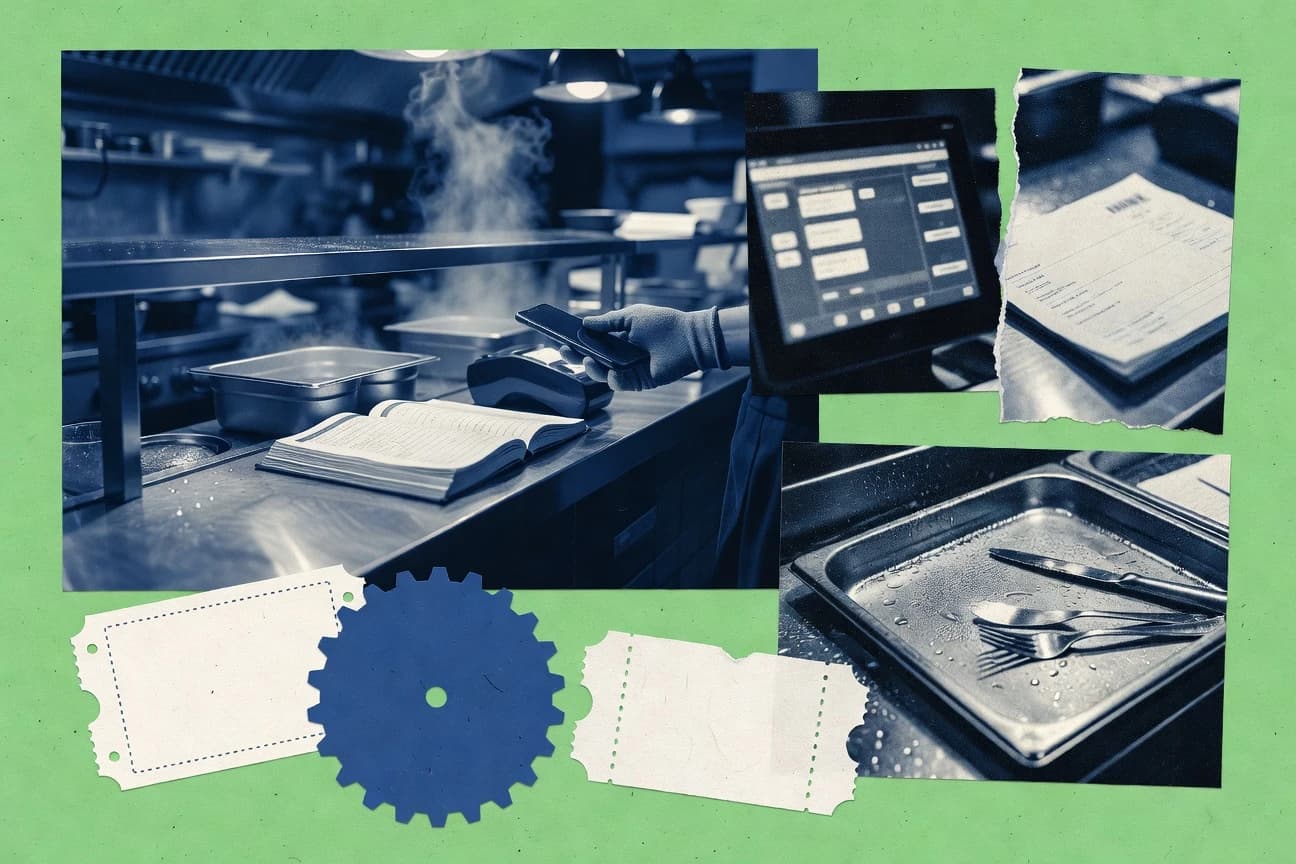

Restaurant management software is no longer just a back office upgrade. With global online food delivery reaching $27.3 billion in 2023 and cloud migration accelerating across enterprises, the pressure to streamline ordering, labor scheduling, and operations is showing up in markets worldwide. Meanwhile, security, integration complexity, and margin stress are shaping adoption decisions as restaurants try to keep service fast and efficient without losing control.
Key Takeaways
- Canada had about 97,000 restaurant establishments in 2023, supporting adoption demand for restaurant management software
- China had over 520,000 catering enterprises in 2022 (a proxy market size for restaurant management software adoption)
- $15.86 billion global restaurant POS market size in 2023, an adjacent category that typically bundles with restaurant management software
- In 2023, the US had 13.6% unemployment among people age 16–24, contributing to labor cost pressures that drive adoption of labor scheduling and management software
- The US restaurant and foodservice sector added 113,000 jobs in 2023 (affecting system rollouts and operational scaling needs)
- In 2023, the average hourly wage for food preparation and serving workers in the US was $15.20, increasing pressure to reduce labor inefficiencies
- 83% of consumers in 2023 used a smartphone in the past month for activities including ordering food, increasing demand for restaurant systems that support mobile ordering
- In 2023, 69% of restaurant operators said they use a scheduling tool to manage labor hours efficiently
- In 2024, 81% of restaurants used some kind of loyalty program (often software-backed), supporting adoption of CRM-like modules
- Restaurants that adopted integrated online ordering reduced order-to-seat times by 12% on average (reported by a vendor-supported industry study)
- Labor scheduling optimization yielded a 10–12% reduction in labor costs for a restaurant chain after implementing scheduling software (case study range)
- CRM-enabled loyalty programs increased repeat purchase rate by 14% (published case-study statistic)
- Restaurants face an average margin pressure where net profit is commonly in the low single digits (average net profit margin range is reported as approximately 3% in industry analysis for full-service and quick-service)
- 21% of restaurants reported experiencing a data breach or security incident in the past 12 months (share reporting a security incident)
- The average US identity-related incident cost was $17.1 million for organizations in a ransomware incident scenario (average cost figure reported for identity/ransomware event types)
With labor pressure, mobile ordering growth, and rising security risks, the restaurant software market surged to $17.5 billion in 2023.
Related reading
01 · Category
Market Size8 stats
01
Canada had about 97,000 restaurant establishments in 2023, supporting adoption demand for restaurant management software
02
China had over 520,000 catering enterprises in 2022 (a proxy market size for restaurant management software adoption)
03
$15.86 billion global restaurant POS market size in 2023, an adjacent category that typically bundles with restaurant management software
04
$27.3 billion global online food delivery market size in 2023, which increases software needs for order routing and operations management
05
$17.5 billion global restaurant management system market revenue in 2023 (as estimated by a market research publisher)
06
$9.8 billion global restaurant management software market projected by 2030 (indicating growth expectations for management software spend)
07
$24.5 billion global restaurant software market size in 2024 (management + adjacent categories)
08
Online food delivery: US consumers spent $67.0 billion on third-party delivery in 2022 (US dollars)
Interpretation
Market Size Interpretation
The market for restaurant management software is already substantial and still expanding, with a global restaurant management systems revenue of $17.5 billion in 2023 and projections of $9.8 billion for restaurant management software by 2030 alongside $27.3 billion in 2023 online food delivery, which signals rising adoption demand from modern, order-driven operations.
02 · Category
Industry Trends6 stats
01
In 2023, the US had 13.6% unemployment among people age 16–24, contributing to labor cost pressures that drive adoption of labor scheduling and management software
02
The US restaurant and foodservice sector added 113,000 jobs in 2023 (affecting system rollouts and operational scaling needs)
03
In 2023, the average hourly wage for food preparation and serving workers in the US was $15.20, increasing pressure to reduce labor inefficiencies
04
In 2024, 34% of restaurant operators cited integration complexity as a major barrier to adopting new restaurant technology (industry trend impacting software strategy)
05
In 2023, 29% of restaurant owners/GM said cybersecurity concerns affected technology purchases, boosting demand for security features in management software
06
41% of restaurants cited labor as their top business challenge in 2024 (share citing labor as top challenge)
Interpretation
Industry Trends Interpretation
With 41% of restaurants naming labor as their top challenge and rising wage and unemployment pressures in 2023, the Industry Trends signal that restaurant management software is increasingly being adopted for labor scheduling and efficiency improvements while operators also prioritize solutions that can integrate smoothly and add stronger security.
03 · Category
User Adoption4 stats
01
83% of consumers in 2023 used a smartphone in the past month for activities including ordering food, increasing demand for restaurant systems that support mobile ordering
02
In 2023, 69% of restaurant operators said they use a scheduling tool to manage labor hours efficiently
03
In 2024, 81% of restaurants used some kind of loyalty program (often software-backed), supporting adoption of CRM-like modules
04
In 2023, 46% of restaurant operators used automated customer communications (email/SMS), increasing reliance on integrated marketing automation
Interpretation
User Adoption Interpretation
User adoption is being driven by connected customer and staff workflows, with 83% of consumers using smartphones to order food and 69% of restaurant operators already relying on scheduling tools to manage labor, while loyalty programs remain widespread at 81% in 2024 and 46% use automated customer communications.
04 · Category
Performance Metrics7 stats
01
Restaurants that adopted integrated online ordering reduced order-to-seat times by 12% on average (reported by a vendor-supported industry study)
02
Labor scheduling optimization yielded a 10–12% reduction in labor costs for a restaurant chain after implementing scheduling software (case study range)
03
CRM-enabled loyalty programs increased repeat purchase rate by 14% (published case-study statistic)
04
Mobile order pickup accuracy improved to 98.5% after implementing barcode-based order verification (case study)
05
Real-time demand forecasting reduced inventory write-offs by 12% in a multi-site foodservice study (write-off reduction)
06
A peer-reviewed study found that accurate forecasting can reduce perishable food waste by up to 20% under realistic demand conditions (waste reduction bound)
07
Implementing automated scheduling reduced employee no-shows by 19% in a study of shift-based service staffing (no-show reduction)
Interpretation
Performance Metrics Interpretation
Across performance metrics, Restaurant Management Software is consistently driving measurable operational gains, from a 12% faster order-to-seat time and 10–12% lower labor costs to up to a 20% reduction in perishable waste.
05 · Category
Cost Analysis3 stats
01
Restaurants face an average margin pressure where net profit is commonly in the low single digits (average net profit margin range is reported as approximately 3% in industry analysis for full-service and quick-service)
02
21% of restaurants reported experiencing a data breach or security incident in the past 12 months (share reporting a security incident)
03
The average US identity-related incident cost was $17.1 million for organizations in a ransomware incident scenario (average cost figure reported for identity/ransomware event types)
Interpretation
Cost Analysis Interpretation
With average net profit margins around 3% and 21% of restaurants reporting a security incident, cost analysis shows that a single ransomware or identity event can carry a high $17.1 million price tag, making operational and risk costs especially critical for this software category.
More related reading
06 · Category
Workforce Demand2 stats
01
The US had 1,208,000 employees in food services and drinking places (NAICS 722) in May 2024 (employment count), supporting demand for staffing and operations tooling
02
4.3% of US workers were in the leisure and hospitality sector in 2023 (share of total employment), showing ongoing staffing intensity in restaurant-relevant industries
Interpretation
Workforce Demand Interpretation
With 1,208,000 employees in US food services and drinking places in May 2024 and 4.3% of all US workers employed in leisure and hospitality in 2023, workforce demand remains strong, signaling a continued need for restaurant management software that helps staffing-intensive operations run smoothly.
07 · Category
Security & Compliance1 stats
01
$4.46 million average cost of a data breach in 2024 globally (IBM Cost of a Data Breach Report), pressuring restaurants to adopt security features and controls
Interpretation
Security & Compliance Interpretation
With IBM estimating the global average cost of a data breach at $4.46 million in 2024, restaurants are being pushed to invest in stronger Security and Compliance features and controls to reduce the financial fallout of cyber incidents.
08 · Category
Customer Digital Channels3 stats
01
44% of US adults used online ordering in the past month in 2023 (American Time Use / consumer behavior proxy), driving software features for digital ordering and order management
02
56% of consumers expect delivery to arrive within 30 minutes for quick delivery services (logistics expectation metric), increasing operational urgency and routing optimization needs
03
78% of consumers said they would be loyal to a brand that offers personalized recommendations (personalization expectation metric), supporting CRM and personalization modules
Interpretation
Customer Digital Channels Interpretation
With 44% of US adults using online ordering and 78% expecting personalized recommendations, customer digital channels are clearly becoming the core battleground where Restaurant Management Software must power fast digital ordering, targeted CRM personalization, and tighter execution.
09 · Category
Market Economics4 stats
01
The global restaurant industry is expected to reach $4.2 trillion in revenue in 2024 (industry revenue forecast), indicating a growing spend base for restaurant software
02
Cloud infrastructure spending in the US reached $274 billion in 2023 (public cloud services spend), enabling migration of restaurant management workloads
03
Worldwide enterprise software spending was projected to reach $849 billion in 2024 (Gartner forecast), supporting budgets for restaurant management systems
04
Order-to-cash cycle time fell by 12% after implementing integrated back-office systems in service industries (cycle time improvement metric from enterprise systems study), benefiting restaurant accounting and operations
Interpretation
Market Economics Interpretation
With the global restaurant market projected to hit $4.2 trillion in 2024 and broader enterprise software spending expected to reach $849 billion, the Market Economics trend is that restaurants have a rapidly expanding spend base and strong budget backing for cloud-enabled management systems, while a 12% faster order to cash cycle from integrated back office tools makes these investments measurably worthwhile.
10 · Category
Operational Efficiency4 stats
01
Restaurant management system deployments increasingly use cloud: 62% of surveyed organizations in 2024 migrated at least one application to cloud in the last 12 months (cloud migration adoption share), relevant to restaurant management software rollouts
02
Restaurants that adopt electronic invoicing reduce invoice processing costs by 50% (cost reduction metric from e-invoicing report), relevant for back-office modules in management systems
03
Inventory stockout rates decreased by 18% after implementing automated inventory tracking in foodservice pilot programs (pilot KPI improvement), indicating value for inventory modules
04
In hospitality, using real-time dashboards improved on-time order fulfillment to 94% (operational KPI metric from applied analytics case study), supporting performance monitoring features
Interpretation
Operational Efficiency Interpretation
Operational efficiency is being driven by technology adoption in the back office and day to day workflows, with 62% of organizations moving at least one application to the cloud in the past 12 months and gains like a 50% cut in invoice processing costs and an 18% drop in stockouts after automated inventory tracking.
Reference
Cite This Report
This report is designed to be cited. We maintain stable URLs and versioned verification dates. Copy the format appropriate for your publication below.
APA
Ryan Townsend. (2026, February 13). Restaurant Management Software Industry Statistics. Gitnux. https://gitnux.org/restaurant-management-software-industry-statistics
MLA
Ryan Townsend. "Restaurant Management Software Industry Statistics." Gitnux, 13 Feb 2026, https://gitnux.org/restaurant-management-software-industry-statistics.
Chicago
Ryan Townsend. 2026. "Restaurant Management Software Industry Statistics." Gitnux. https://gitnux.org/restaurant-management-software-industry-statistics.
Sources & references
42 datasets cited across this report · attribution is report-level
www150.statcan.gc.cadata.stats.gov.cn marketsandmarkets.com
 businessofapps.com
 fortunebusinessinsights.com
 grandviewresearch.com
 imarcgroup.com
 bls.gov
 pewresearch.org
 g2.com
 loyalty360.org
 foodserviceequipmentjournal.com
 restaurantdive.com
 us-cert.gov
 adaptiveinsights.com
 revelsystems.com
 yotpo.com
 lavu.com
 pos.toasttab.com
 nerdwallet.com
 verizon.com
 cisa.gov
 statista.com
 sciencedirect.com
 journals.sagepub.com
 fred.stlouisfed.org
 ibm.com
 afterpay.com
 salesforce.com
 gartner.com
 rightscale.com
 oecd.org
 tandfonline.com
 ieeexplore.ieee.org
+8 additional datasets cited (not shown individually)