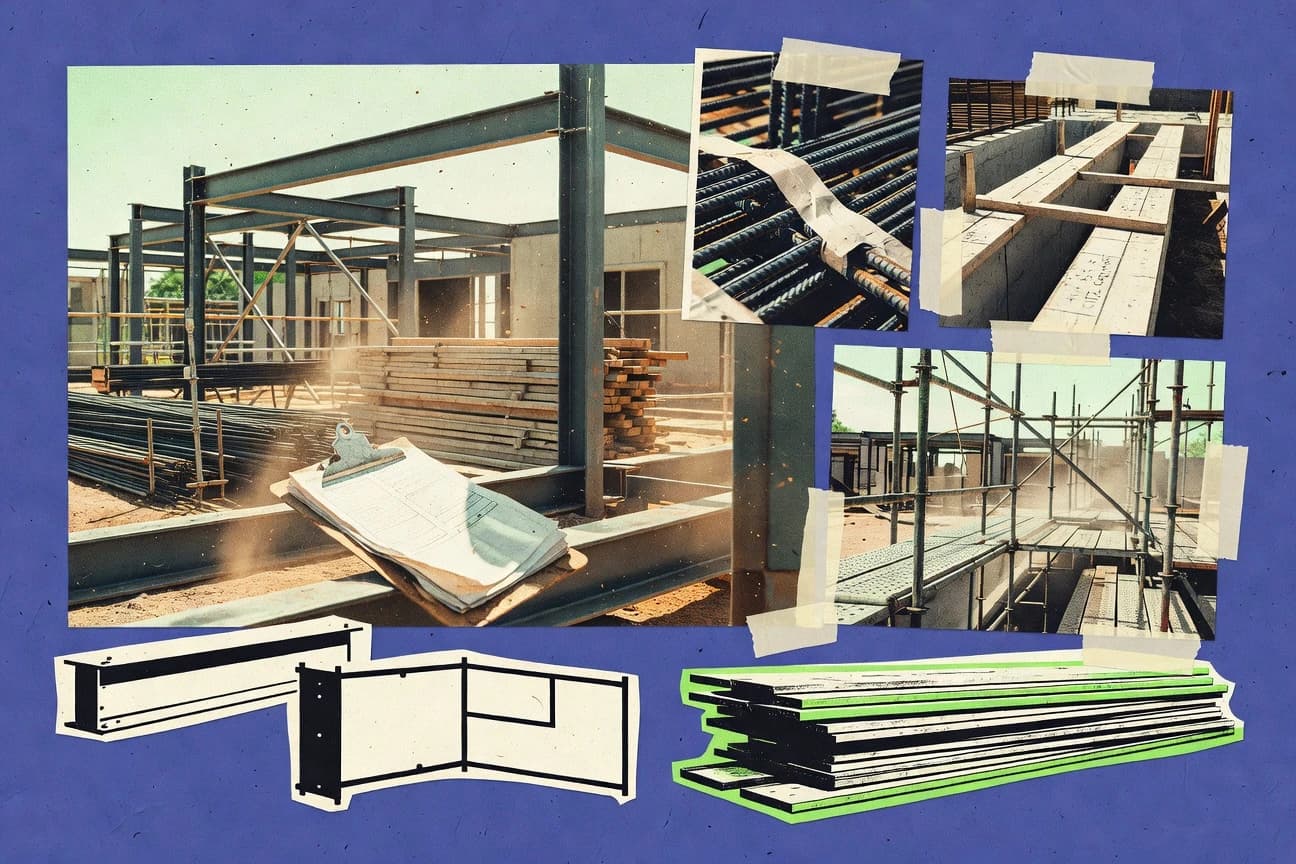

Global construction spending is projected to reach $2.4 trillion worldwide by 2025, even as delivery risks persist. In the U.S., 6.7% of construction firms reported being prevented from meeting demand due to worker shortages in 2023. Buildings also account for 37% of global CO2 emissions, pushing owners to measure and reduce environmental impact while projects get built.
Key Takeaways
- $1.8 trillion value added by the construction industry worldwide in 2022 (construction contributed $1.8T to global value added, reflecting the sector’s major role in GDP).
- $2.4 trillion global construction spending expected in 2025 (forecast level of construction spending worldwide).
- $1.8 trillion global construction chemicals market size in 2023 (construction chemicals market value).
- 6.7% of U.S. construction firms reported being prevented from meeting demand due to worker shortages in 2023 (share of firms citing labor shortages as a constraint).
- The U.S. construction industry added 479,000 jobs from Jan 2023 to Jan 2024 (construction employment change).
- Construction labor productivity in the U.S. improved 1.2% in 2023 (output per hour measure for construction).
- 6.6% year-over-year Japan construction orders growth in 2024 (order growth rate).
- In 2023, 1 in 5 construction projects faced cost overruns exceeding 10% (share of projects with >10% overruns; survey).
- U.S. building permits declined 3.0% year-over-year in May 2024 (permits indicator).
- Buildings are responsible for 37% of global CO2 emissions (sector emissions share).
- Steel production accounts for about 7–9% of global CO2 emissions (global emissions share from steel, widely cited range).
- LEED-certified projects reached over 102,000 registered projects worldwide in 2024 (volume of LEED registered projects).
- BIM reduces project cost overruns by up to 33% in implemented cases (study result).
- Using laser scanning can reduce rework in construction documentation by 20% to 50% (industry study ranges).
- Adopting prefabrication can reduce construction waste by 15% to 90% depending on method (research range).
Construction is growing rapidly in value and tech adoption, yet labor shortages and cost overruns remain major constraints.
Related reading
01 · Category
Market Size4 stats
01
$1.8 trillion value added by the construction industry worldwide in 2022 (construction contributed $1.8T to global value added, reflecting the sector’s major role in GDP).
02
$2.4 trillion global construction spending expected in 2025 (forecast level of construction spending worldwide).
03
$1.8 trillion global construction chemicals market size in 2023 (construction chemicals market value).
04
$33.2 billion global building automation systems market size in 2023 (market value for building automation systems).
Interpretation
Market Size Interpretation
The construction and building industry’s market size is expanding fast, with global construction contributing about $1.8 trillion to value added in 2022 and projected to reach $2.4 trillion in spending by 2025, underscoring sustained growth across major related segments like a $1.8 trillion construction chemicals market in 2023.
02 · Category
Workforce & Productivity5 stats
01
6.7% of U.S. construction firms reported being prevented from meeting demand due to worker shortages in 2023 (share of firms citing labor shortages as a constraint).
02
The U.S. construction industry added 479,000 jobs from Jan 2023 to Jan 2024 (construction employment change).
03
Construction labor productivity in the U.S. improved 1.2% in 2023 (output per hour measure for construction).
04
33% of construction companies in the UK reported difficulty recruiting skilled trades in 2023 (share reporting recruitment difficulty).
05
Construction employment in Canada reached 1.1 million in 2023 (number of employed persons in construction).
Interpretation
Workforce & Productivity Interpretation
Across these markets, the workforce strain is clear while productivity keeps edging up, with U.S. construction firms still unable to meet demand due to labor shortages in 2023 at 6.7% and U.S. construction labor productivity improving 1.2% in 2023 despite job gains of 479,000 from Jan 2023 to Jan 2024.
03 · Category
Industry Trends4 stats
01
6.6% year-over-year Japan construction orders growth in 2024 (order growth rate).
02
In 2023, 1 in 5 construction projects faced cost overruns exceeding 10% (share of projects with >10% overruns; survey).
03
U.S. building permits declined 3.0% year-over-year in May 2024 (permits indicator).
04
The share of construction projects using BIM reached 71% in 2024 in the U.K. (BIM usage adoption share).
Interpretation
Industry Trends Interpretation
Across key markets, the construction industry trend is a cautious shift toward modernization and tighter project control, with Japan’s 6.6% 2024 construction order growth contrasting against U.S. building permits falling 3.0% year over year and 1 in 5 projects in 2023 seeing cost overruns above 10%, while the U.K. pushes BIM adoption to 71% in 2024.
More related reading
04 · Category
Environmental Impact4 stats
01
Buildings are responsible for 37% of global CO2 emissions (sector emissions share).
02
Steel production accounts for about 7–9% of global CO2 emissions (global emissions share from steel, widely cited range).
03
LEED-certified projects reached over 102,000 registered projects worldwide in 2024 (volume of LEED registered projects).
04
In 2024, 87% of U.S. organizations in the construction sector reported tracking sustainability metrics (survey measure).
Interpretation
Environmental Impact Interpretation
With buildings responsible for 37% of global CO2 emissions and steel adding another 7 to 9%, the environmental impact case for cleaner construction is urgent, even as LEED momentum grows to over 102,000 registered projects and 87% of U.S. construction organizations track sustainability metrics.
05 · Category
Technology & Digitalization9 stats
01
BIM reduces project cost overruns by up to 33% in implemented cases (study result).
02
Using laser scanning can reduce rework in construction documentation by 20% to 50% (industry study ranges).
03
Adopting prefabrication can reduce construction waste by 15% to 90% depending on method (research range).
04
Construction robotics market expected CAGR of 20% from 2024 to 2030 (forecast).
05
IoT in construction market expected to exceed $10 billion by 2030 (forecast).
06
Smart construction market forecast to reach $19.3 billion by 2028 (forecast).
07
3.1x higher likelihood of meeting cost targets when using integrated project delivery (research result).
08
Lean construction practices improved schedule performance by 10% on average in controlled studies (research synthesis).
09
$700 million annual U.S. savings from waste reduction through digital takeoff and prefabrication (estimated economic benefit).
Interpretation
Technology & Digitalization Interpretation
Technology and digitalization tools are rapidly proving their value in construction, with BIM cutting project cost overruns by up to 33% and forecasts showing the robotics and IoT markets growing to more than $10 billion by 2030 alongside a smart construction market projected to reach $19.3 billion by 2028.
06 · Category
Cost Analysis & Risk9 stats
01
U.S. producer price index for inputs to construction increased 2.0% in 2024 (PPI measure for construction inputs).
02
Global construction project risk costs estimated at 10% of contract value on average (risk cost share).
03
In a peer-reviewed analysis, construction cost overruns average 12.8% (meta-analysis estimate).
04
In the EU, construction cost index rose 5.2% year-over-year in 2024 (Eurostat construction cost index).
05
Material cost volatility index for construction was 1.35 in Q4 2023 (volatility metric).
06
Interest rate sensitivity: a 100 bps increase in rates reduces U.S. nonresidential construction spending by about 0.8% (econometric estimate from research).
07
WHOLESALE: 1.1% of U.S. construction spending was lost to safety-related costs (safety cost fraction estimate).
08
In 2023, 15% of projects were delayed by more than 12 months (project delay distribution).
09
In 2022, 10.2% of U.S. construction establishments faced material shortages (share from surveys).
Interpretation
Cost Analysis & Risk Interpretation
Cost pressures and financial risk are rising together, with construction input prices up 2.0% in 2024, EU construction costs gaining 5.2% year over year, and cost overruns averaging 12.8%, while even a 100 bps rate hike trims US nonresidential construction spending by about 0.8%, underscoring why cost analysis and risk management must account for both price and interest rate swings.
report visual · Breakdown
Construction Scale & Spending Outlook (Worldwide)
Construction’s economic footprint is massive, and spending is expected to remain elevated—highlighting continued global investment momentum.
87%
In 2024, 87% of U.S. organizations in the construction sector reported tracking sustainability metrics (survey measure).
12.8%
In a peer-reviewed analysis, construction cost overruns average 12.8% (meta-analysis estimate).
source-verifiedconstructiondive.com · sciencedirect.com2024
Reference
Cite This Report
This report is designed to be cited. We maintain stable URLs and versioned verification dates. Copy the format appropriate for your publication below.
APA
Daniel Varga. (2026, February 13). Construction And Building Industry Statistics. Gitnux. https://gitnux.org/construction-and-building-industry-statistics
MLA
Daniel Varga. "Construction And Building Industry Statistics." Gitnux, 13 Feb 2026, https://gitnux.org/construction-and-building-industry-statistics.
Chicago
Daniel Varga. 2026. "Construction And Building Industry Statistics." Gitnux. https://gitnux.org/construction-and-building-industry-statistics.
Sources & references
35 datasets cited across this report · attribution is report-level
+7 additional datasets cited (not shown individually)