GITNUX MARKETDATA
Browse Our Category
Supply Chain In Industry
Latest update:


Supply Chain In The Lumber Industry Statistics
From a 45 day mill to retailer lead time and rail moving 65% of US lumber to rail and sea flows that swing by country and sanctions, the lumber supply chain is less predictable than most people assume. Track the latest 2023 scale of global lumber wholesale at $450 billion alongside buyer bottlenecks and logistics emissions so you can see where demand, processing capacity, and transport constraints actually meet.
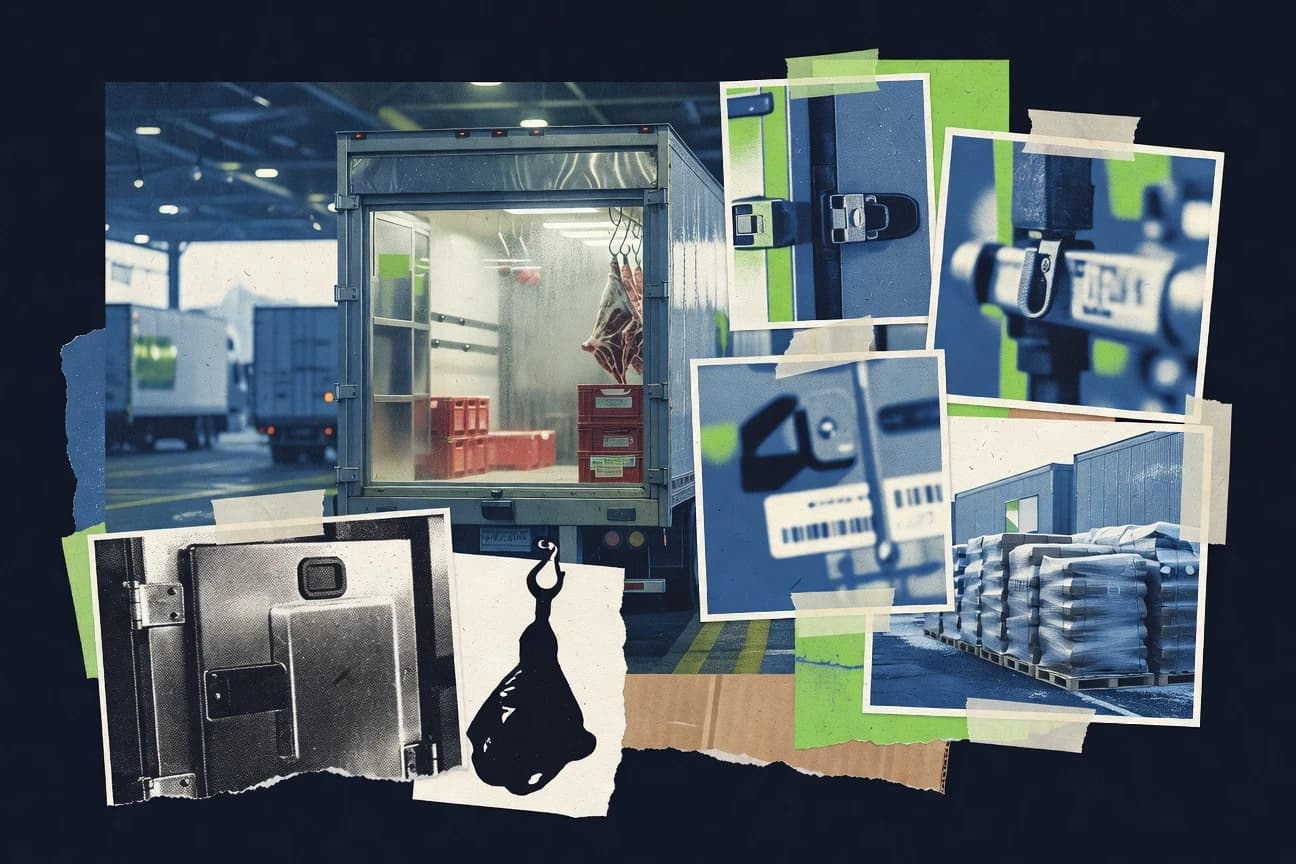
Supply Chain In The Beef Industry Statistics
Even with beef demand rising, supply chain pressure is showing up in the ledger, from global production totaling 61.3 million metric tons in 2023 to retail prices reaching $7.25 per pound in the US in 2022. Learn how shifting cattle inventories, tighter processing capacity, and fast growing import flows, including China’s 2.1 million tons of beef in 2022, are reshaping where beef gets made, shipped, and priced.
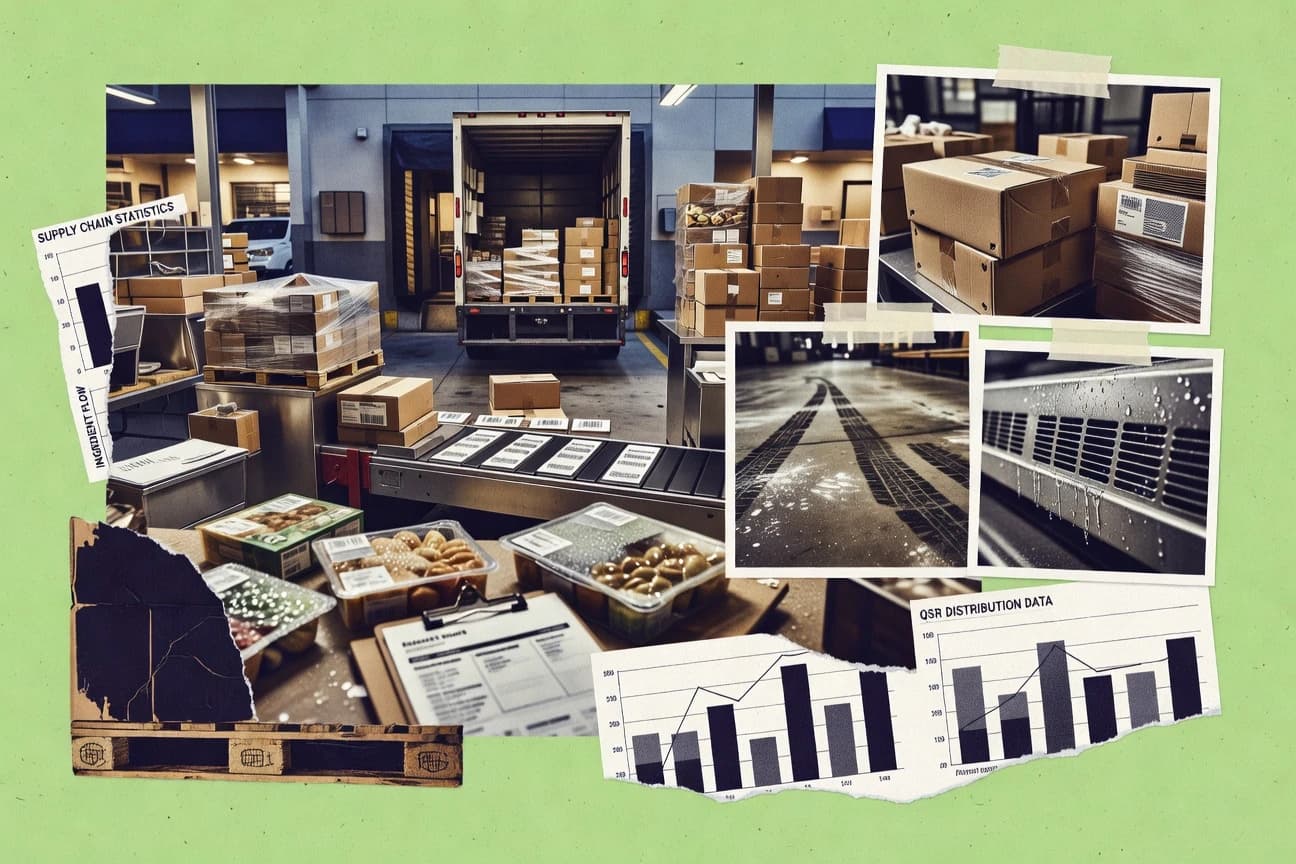
Supply Chain In The Qsr Industry Statistics
Even with 2025 level demand pressures, QSR supply chain costs are still consuming 29% of total COGS, and the spending that matters is shifting fast. From cold storage energy costs jumping 25% to warehouse automation cutting picking costs by 22%, this page ties the biggest 2025 and recent cost drivers to practical levers like AI forecasting, route optimization, and traceability that reduce spoilage, stockouts, and waste.

Supply Chain Resilience Statistics
By 2025, 75% of firms plan to use AI for resilience while disruptions keep widening, with cybersecurity hitting 60% of surveyed supply chains in 2023 and average major-incident disruption costs for large firms at $184 million. Track how climate events, port congestion, labor shortages, and single source dependencies are colliding, and what recovery benchmarks like 2 weeks average with technology are really signaling about who gets ahead.

Nearshoring Statistics
With 2025 survey data already flagging labor shortages as the top nearshoring blocker at 58 percent and inflation in key destinations running 8 percent above the global average, the page turns risk into something you can measure. You will also see how approvals were slowed by regulatory hurdles at 28 percent and how cross border wins like a 15 to 20 percent logistics cost advantage vs China in 2023 are being weighed against land disputes, energy unreliability, and rising cyber incidents.

Supply Chain In The Barber Industry Statistics
From 2.5 million TEUs of sea freight in 2023 to inventory turnover hitting 8.5 times a year, the barber supply chain reveals how timing, transport choices, and warehousing pressure reshape every restock. Air and port disruptions are driving costs up while greener logistics are starting to win, from drone route trials in the US to 95% cold chain integrity for aftershave oils.

Supply Chain In The Entertainment Industry Statistics
Streaming reliability and content scale are rising while logistics costs strain behind the scenes, from Apple TV+ delivering 4K HDR streams with 99.9% uptime globally to global film distribution logistics costs jumping 22% due to fuel prices. This page connects the hidden supply chain mechanics behind 2.5 million entertainment workers worldwide to the systems that keep uploads, subtitles, updates, and physical media moving.

Supply Chain In The Printing Industry Statistics
Commercial print supply chains are being pulled in two directions at once with freight and material shocks alongside a fast migration to digital and greener inputs, including energy costs cited as the biggest threat by 70% of printers and paper supply disruptions hitting 64% of providers’ revenue in 2023. The page connects these pressures to growth signals you can act on, from Asia’s 6.2% regional CAGR and packaging’s 45% share to web-to-print momentum and AI and automation trends that are reshaping everything from ink setup time to lead times for equipment.

Supply Chain In The Furniture Industry Statistics
See how furniture logistics is being reshaped by hard cost and service pressure, from last mile delivery taking 53% of shipping cost and damage rates landing at 5% to 8% to white glove delivery lifting satisfaction to a 90% customer rating. Get the current signals behind planning decisions, including freight behavior that swung from 2021’s $20,000 peak ocean cost to today’s persistent reality that logistics often exceed 15% of retail price.

Supply Chain In The Software Industry Statistics
With 78% of organizations expecting to adopt Software Bill of Materials by 2025 and federal SBOM pressure rising 300% under EO 14028, the software supply chain is being forced into transparency faster than many teams can mature. Yet only 17% have a mature SBOM management process and 40% of software projects fail security audits due to undocumented third party code, creating a high stakes gap between compliance momentum and real operational readiness.

Supply Chain In The Floral Industry Statistics
See why floral supply chains are being squeezed from every side, where labor can consume 35% to 45% of a retail florist’s operating expenses and one cold chain slip cuts rose life by 15 to 20%. From 85% of U.S.-bound flowers moving by temperature-controlled air to supermarket growth of 7.2% in 2021 and supply chain disruptions that drove a 20% jump in carnation wholesale prices, this page connects the people, logistics, and margins shaping what arrives on doorsteps.

Supply Chain In The Cloud Computing Industry Statistics
Cloud supply chains are getting smarter and more resilient fast, with 70% of enterprises shifting to resilient cloud models and 90% of cloud firms relying on APIs for interoperability. Yet security and integrity lag behind, as ransomware attacks on cloud supply chains rose 75% in 2023 and 60% of breaches traced back to third party vendors, making this the place to understand how these conflicting trends are reshaping real supply chain operations.

Supply Chain In The Life Sciences Industry Statistics
See how life sciences leaders are turning cost and risk into performance, with freight cost per unit down 15% and AI forecasting lifting fill rates to 98.5%. The page also tracks the tech pivot behind reliability and resilience, from edge computing delivering 99.9% uptime in cold chains to predictive maintenance saving $1.2B in downtime.

Supply Chain In The Dance Industry Statistics
Logistics costs for dance equipment climbed 25% in 2023, yet cold chain handling for perishable costume dyes still preserved 98% integrity, showing how precision and profit collide. From customs delays adding 3 days to EU imports and multi modal shipping powering 50% of international prop deliveries to drone trials cutting rural studio delivery times by 40%, these supply chain stats explain exactly where tours, studios, and brands lose time and where they can win it back.

Supply Chain In The Pet Food Industry Statistics
With online sales already driving 22% of pet food distribution by 2023 and refrigerated trucking moving 40% of wet shipments globally, the page connects channel shifts to the operational reality of modern logistics. You will see how shrinkage drops 30% with RFID and how standardized 48x40 pallets plus cross docking can cut handling time by 40%, all while supply constraints and sustainability goals pressure every link from ingredient sourcing to distribution centers.

Supply Chain In The Financial Service Industry Statistics
Finance leaders are tightening third party control as vendor sourced cyber risk now drives 77% of finance cyber incidents and banks still average 4.5M per third party breach. At the same time, the upside is tangible with 60% of neobanks reaching 10% cost savings plus automation and supply chain finance cutting costs and tail spend, so the page shows why procurement and security can no longer be managed separately.
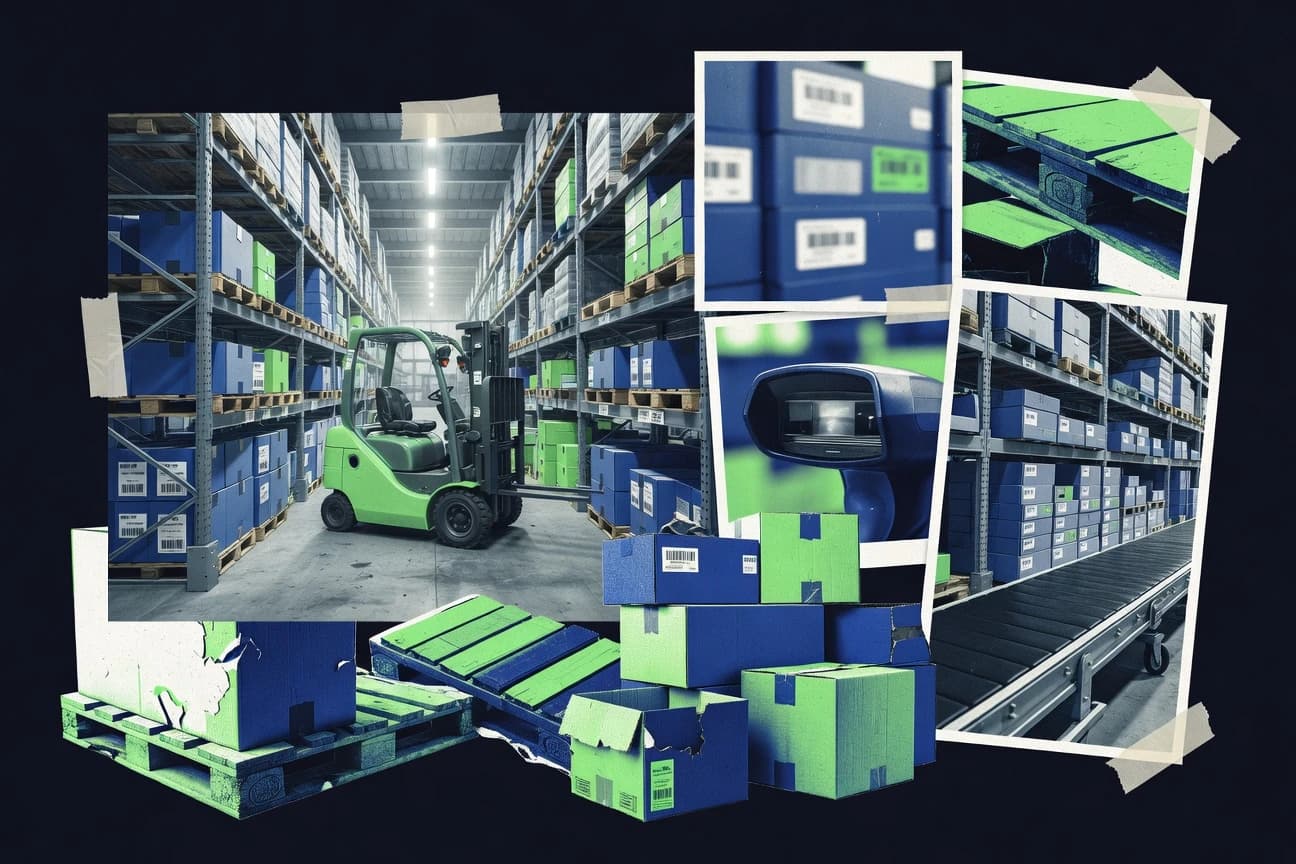
Supply Chain In The Warehouse Industry Statistics
Warehouse teams are paying 20 to 30% of inventory value just to hold it, yet leaders are turning that pressure into performance by aiming for 99.5% cycle-count accuracy with RFID and pushing fill rates to 98% while using AI demand sensing to cut forecast error by up to 10% MAPE. You will see how excess stock averages 15% and the bullwhip effect can multiply demand 2 to 5 times upstream, then contrast it with automation and slotting gains like 25% less handling through velocity-based layouts and 35% throughput lift from lean principles.

Supply Chain In The Airline Industry Statistics
With airlines investing about $5 billion in aviation supply chain digitization and digital tools cutting procurement costs by an average 15 percent, the efficiency case is finally getting hard data to match the hype. Still, spare parts inventory tops $80 billion and delayed flights due to parts shortages can cost $150,000 each, showing why modern procurement and visibility are now make or break.

Supply Chain In The Creative Industry Statistics
Blockchain tracking is now baked into 68% of creative firms in 2023, while cloud VFX runs at 85% and AI is already cutting fashion inventory management by 40%. If you want to understand why creative supply chains are racing toward digital and traceable logistics, this page lays out the contrasts that explain both the efficiency gains and the new bottlenecks.
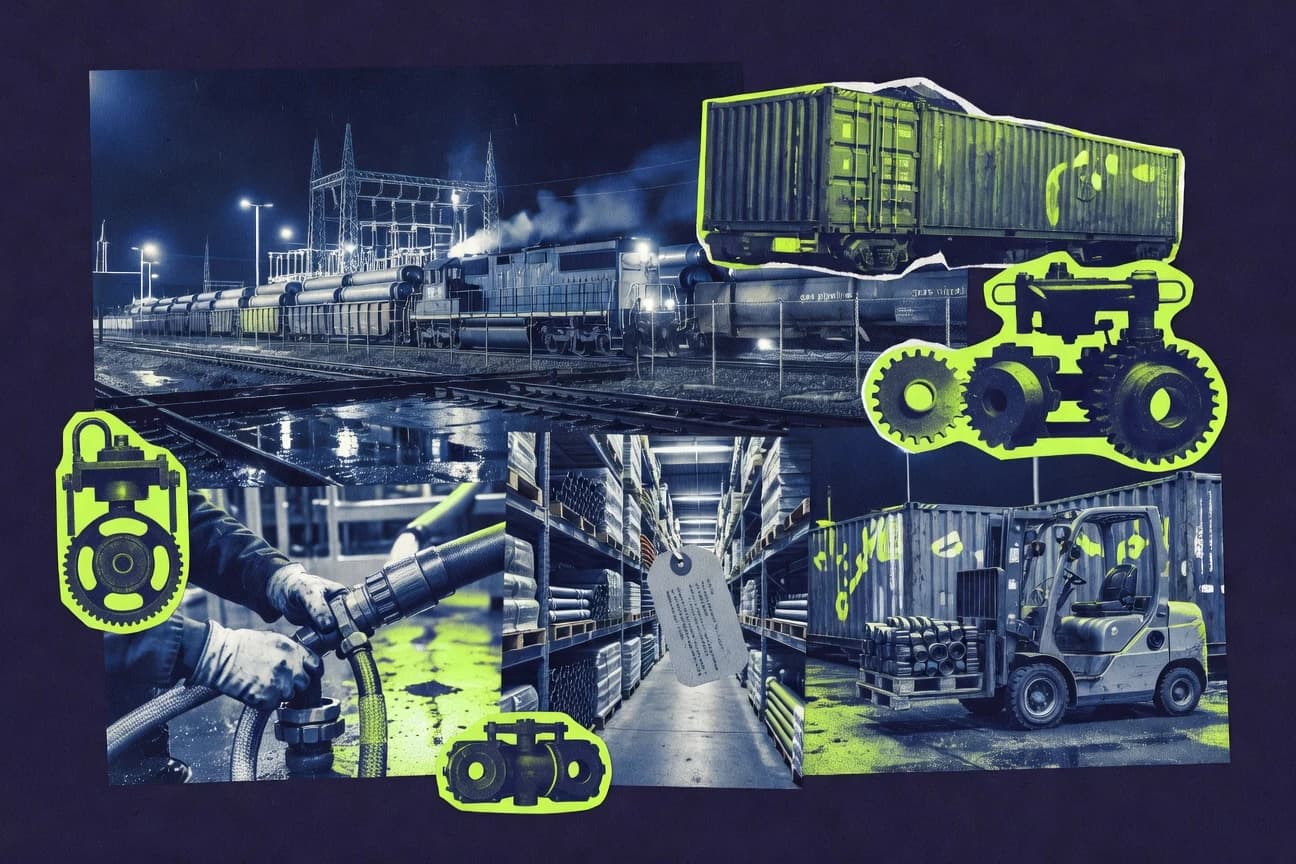
Supply Chain In The Energy Industry Statistics
Powering 2026 decisions means confronting a supply chain where China controls 95% of terbium magnets and 99% of dysprosium for wind turbines, while Europe still reports lead times rising after geopolitical tensions and energy firms face disruptions that hit 78% worldwide. You will see how material chokepoints, LNG and grid capacity pressures, and 2024 level visibility tech are colliding, and why battery storage capacity tripled from 2020 to 2023 as costs and bottlenecks keep shifting.