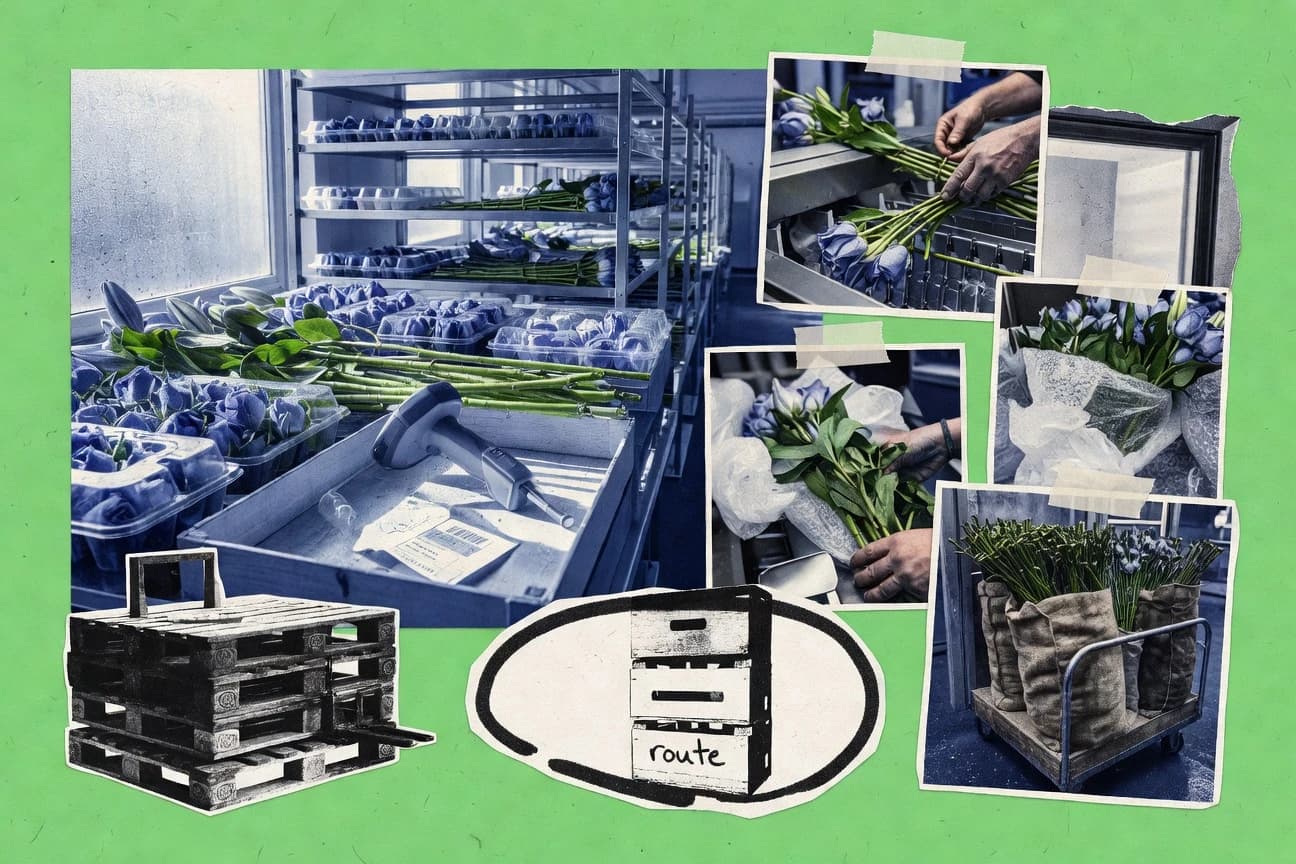

Supply chain choices in floriculture shape workers, retailers, and consumers across major producing regions such as Colombia, Ethiopia, Kenya, and the Netherlands, and across import markets like the United States and the UK. Labor costs can make up 35%–45% of a retail florist’s operating expenses, while cold-chain temperature control helps preserve bloom life—one day of delay can cut vase life by 15–20%.
Key Takeaways
- Labor costs account for 35% to 45% of total operating expenses for a retail florist
- The flower industry in Colombia provides direct and indirect jobs to over 200,000 people
- 60% of all workers in the global floriculture industry are women
- Maintaining a cold chain temperature of 1-3 degrees Celsius can double the vase life of a rose
- One day of delay in the cold chain reduces flower vase life by 15-20%
- 95% of flowers imported into the U.S. travel via air freight in temperature-controlled holds
- Approximately 80% of flowers sold in the United States are imported from international markets
- The global floriculture market was valued at $49.8 billion in 2022 and is projected to reach $83.4 billion by 2030
- Colombia provides 65% of all cut flower imports to the United States market
- Producing 12,000 roses in Kenya emits approximately 13,000 kg of CO2
- Importing flowers to the UK from Kenya creates 1/6th the carbon footprint of Dutch flowers grown in heated greenhouses
- Cut flower production uses more pesticides per hectare than any other agricultural crop
- 64% of consumers purchased flowers online in the last year, up from 48% in 2019
- Subscription-based floral services have seen a 300% growth in revenue since 2018
- The use of AI for flower grading (quality assessment) has increased sorting speed by 400%
Cold chain reliability and smarter logistics shape costs, jobs, and quality across the fast growing floral supply chain.
Related reading
01 · Category
Labor, Economics, And Retail30 stats
01
Labor costs account for 35% to 45% of total operating expenses for a retail florist
02
The flower industry in Colombia provides direct and indirect jobs to over 200,000 people
03
60% of all workers in the global floriculture industry are women
04
Ethiopia's floriculture sector has created jobs for 150,000 citizens in the last 15 years
05
The average hourly wage for a floral designer in the U.S. is approximately $16.50
06
Independent flower shops in the USA have declined by 10% in number over the last decade due to supermarket competition
07
Supermarket floral sales grew by 7.2% in 2021 as consumers shifted to one-stop shopping
08
Approximately 27,000 metric tons of flowers are produced annually in the United States
09
Valentine's Day spending on flowers in the U.S. reached $2.3 billion in 2023
10
The average mark-up on a floral arrangement in a retail shop is 300% of the flower wholesale cost
11
Rental costs for retail flower shops in urban areas increased by 15% from 2021 to 2023
12
In the Netherlands, 150,000 people are employed across the floral value chain
13
Wedding floral budgets average $2,500per event in North America
14
The average age of a professional florist in the U.S. is 48 years old
15
25% of florist employees are part-time or seasonal, peaking during February and May
16
Global supply chain disruptions in 2022 led to a 20% increase in the wholesale price of carnations
17
Profit margins for flower growers in Africa range between 10% and 15% annually
18
85% of retail florists are small businesses with fewer than 10 employees
19
Training a lead floral designer takes an average of 3 to 5 years of apprenticeship
20
10% of floral revenue in Europe is generated by "street corner" kiosks
21
Corporate floral accounts (offices, hotels) represent 20% of steady recurring revenue for urban florists
22
Health insurance costs for floral business owners rose by 8% in 2023
23
Flower consumption per capita in Switzerland is the highest in the world at over $100per year
24
Import duties on flowers range from 0% (trade agreements) to 15% in certain Asian markets
25
Holiday-related floral purchases account for 60% of annual revenue for most European florists
26
5% of floral workers globally are involved in research and development of new plant varieties
27
Average insurance premiums for physical floral shops rose 12% due to increased theft and property risk
28
Flower sales at funeral services have declined by 15% due to the "in lieu of flowers" donation trend
29
Direct floral labor turnover rates are 25% annually in high-intensity packing houses
30
Sales of "locally grown" flowers in the U.S. surged by 30% from 2020 to 2022
Interpretation
Labor, Economics, And Retail Interpretation
Labor is the backbone of floral retail economics, with wages and employment shaping costs and capacity, from labor making up 35% to 45% of a retail florist’s operating expenses to women representing 60% of global floriculture workers and the decline of independent U.S. shops by 10% over the last decade under supermarket pressure.
02 · Category
Logistics And Cold Chain30 stats
01
Maintaining a cold chain temperature of 1-3 degrees Celsius can double the vase life of a rose
02
One day of delay in the cold chain reduces flower vase life by 15-20%
03
95% of flowers imported into the U.S. travel via air freight in temperature-controlled holds
04
Every 10 degree increase above optimal temperature reduces flower life by 50%
05
A Boeing 747 freighter can carry up to 100 tons of cut flowers in a single flight from Bogota to Miami
06
45% of florists report shipping and delivery costs as their highest operating expense after labor
07
30% of total flower production is lost to spoilage and waste during transport
08
Sea freight for flowers has grown by 15% annually as a cheaper alternative to air transport
09
It takes approximately 48 to 72 hours for a flower to travel from a farm in Ecuador to a retail shop in London
10
Ethylene gas exposure causes 20% of premature flower wilting during transit
11
Smart labels with RFID and temperature sensors reduced floral waste by 12% in pilot programs
12
Fuel surcharges on air cargo for flowers increased by 25% on average between 2021 and 2023
13
Re-hydrating flowers immediately after transport restores 90% of cellular turgidity within 4 hours
14
Trucking account for 70% of the movement of flowers within the domestic U.S. market
15
Vacuum cooling can drop flower temperature from 25°C to 2°C in less than 30 minutes
16
60% of floral shipments require specialized packaging to prevent physical crushing
17
The use of modified atmosphere packaging (MAP) can extend tulip life to 21 days
18
Last-mile delivery accounts for 40% of the total logistics cost in the D2C floral market
19
In 2022, port delays in Europe caused a 5% increase in floral decay rates for sea cargoes
20
Cold chain infrastructure specifically for flowers in East Africa has tripled since 2010
21
Peak capacity demand on airlines during Valentine’s increases 5-fold compared to average weeks
22
80% of flower farms in Colombia use automated sorting and packing lines for speed
23
Dedicated floral couriers have a 98% successful delivery rate compared to 92% for general couriers
24
Pre-shipment treatment with silver thiosulfate (STS) protects flowers from ethylene for up to 5 days
25
40% of floral waste occurs at the wholesale-to-retail transition point due to improper unpacking
26
Refrigerated truck rates for flowers from California to NY spiked 35% during the 2022 diesel peak
27
A single rose requires 7-10 liters of water during its growth and transport cycle
28
Carbon dioxide enrichment in flower transport containers can reduce respiration and extend life by 3 days
29
12% of international flower shipments undergo secondary inspections for pests, adding 4 hours to delivery time
30
The average lifespan of a refrigerated floral shipping container is 15 years before efficiency drops perishing risk
Interpretation
Logistics And Cold Chain Interpretation
For floral logistics and cold chain management, keeping temperature strictly within the 1 to 3 degrees Celsius range is crucial because just one day of cold chain delay cuts vase life by 15 to 20 percent and every 10 degree rise can reduce it by 50 percent.
03 · Category
Market Size And Global Trade30 stats
01
Approximately 80% of flowers sold in the United States are imported from international markets
02
The global floriculture market was valued at $49.8 billion in 2022 and is projected to reach $83.4 billion by 2030
03
Colombia provides 65% of all cut flower imports to the United States market
04
The Netherlands accounts for approximately 52% of the world's total flower exports by value
05
Ecuador is the third largest exporter of flowers globally representing approximately 9% of global trade value
06
Kenya accounts for 38% of all cut flower imports into the European Union
07
Ethiopia's horticulture exports generated over $500 million in revenue in the 2021/22 fiscal year
08
Roses account for nearly 30% of the total global trade volume of cut flowers
09
The Royal FloraHolland auction house in the Netherlands handles over 12 billion flower and plant items annually
10
Total U.S. consumer spending on floral products reached $46.6 billion in 2021
11
Over 4 billion stems of flowers are imported into the U.S. annually through Miami International Airport
12
The Asia-Pacific floriculture market is expected to grow at a CAGR of 7.2% through 2027
13
India ranks second in the world in total area under flower cultivation with over 300,000 hectares
14
The demand for cut flowers in China increased by 25% year-over-year in 2023
15
Valentine's Day accounts for 22% of total annual floral sales volume in the U.S.
16
Mother’s Day represents 26% of all holiday floral transactions for American retailers
17
The global dried flower market is expected to grow by 4.5% annually due to home decor trends
18
Vietnam exports approximately $35 million worth of flowers to Japan annually
19
Around 15% of the total flower production in South Africa is destined for the international export market
20
The average American household spends 1.5% of their entertainment budget on floral products
21
Miami handles 87% of all imported cut flowers entering the United States
22
Japan is the largest market for tropical flowers with imports valued at $120 million annually
23
The global market for orchid cut flowers is valued at $2.2 billion per annum
24
Israeli flower exports have declined by 40% over the last decade due to competition from Africa
25
Canada imports over $420 million worth of cut flowers annually, mostly from Colombia
26
90% of the world's tulip bulb exports originate from the Netherlands
27
The UK floral market is worth £2.2 billion, with supermarkets holding 60% of share
28
Australian cut flower production is valued at approximately $290 million per year
29
Italy is the leading producer of ornamentals in Europe with a production area of 30,000 hectares
30
The global tulip market is expected to hit $1.2 billion in sales by 2028
Interpretation
Market Size And Global Trade Interpretation
With the U.S. importing about 80% of its flowers and the global floriculture market growing from $49.8 billion in 2022 to $83.4 billion by 2030, international trade is clearly driving both scale and momentum in the floral supply chain, led by key players such as the Netherlands, Colombia, and Kenya.
More related reading
04 · Category
Sustainability And Environment30 stats
01
Producing 12,000 roses in Kenya emits approximately 13,000 kg of CO2
02
Importing flowers to the UK from Kenya creates 1/6th the carbon footprint of Dutch flowers grown in heated greenhouses
03
Cut flower production uses more pesticides per hectare than any other agricultural crop
04
60,000 hectares of land in the Global South are dedicated to flower production for Northern export
05
Over 35% of floral consumers prefer to buy flowers with eco-labels like Fairtrade or Rainforest Alliance
06
The floral industry generates 100,000 tons of plastic waste annually through single-use packaging and floral foam
07
Recyclable paper-based floral sleeves have seen a 50% increase in market adoption since 2020
08
75% of floral consumers under age 35 are willing to pay a 10% premium for sustainable flowers
09
Standard floral foam (phenolic resin) can take several hundred years to break down in landfills
10
40% of water used in Kenyan flower farms is recycled using closed-loop irrigation systems
11
Average pesticide residue on roses can include up to 12 different chemical substances
12
The "Slow Flowers" movement has grown to over 800 member farms in North America
13
Transitioning from air to sea freight can reduce transport-related CO2 emissions by up to 90%
14
20% of commercial cut flowers in the U.S. are now Veriflora certified for sustainability
15
Greenhouse heating accounts for 75% of the total energy footprint of flowers grown in temperate climates
16
Rainwater harvesting provides 60% of the water needs for flower farms in the Savanna region of Colombia
17
15% of the flowers sold at Dutch auctions now carry the FSI (Floriculture Sustainability Initiative) label
18
Improper disposal of floral waste in lagoons can deplete oxygen levels by 50%, harming local aquatic life
19
Biodegradable floral foams composed of basalt wool are growing at a 12% annual rate
20
90% of Fairtrade flower farm workers in Ethiopia are women
21
Regenerative agriculture practices in flower farming can sequester 2 tons of carbon per acre annually
22
Solar panel installations on flower greenhouses in Israel have reduced electricity costs by 30%
23
The use of predatory insects for pest control reduces chemical pesticide use by 40% in rose cultivation
24
Floral industry air cargo contributes approximately 2.5 million metric tons of CO2 globally per year
25
50% of the emissions from a Dutch tulip come from the natural gas used to heat the greenhouse
26
Bees are 30% more likely to be found on organic flower farms than conventional ones
27
Zero-waste floral design workshops have increased by 200% in urban centers like NYC and London
28
55% of North American florists have implemented localized composting for green waste as of 2024
29
Sustainable packaging solutions for bouquets cost on average $0.15more per unit than plastic
30
Peat moss use in flower soil mixes is being reduced by 5% annually due to bog conservation efforts
Interpretation
Sustainability And Environment Interpretation
For sustainability and the environment, the data shows a clear mismatch between consumer support and impact, with 100,000 tons of annual plastic waste and cut-flower production using the most pesticides per hectare, even as more than 35% of consumers prefer eco-labeled flowers.
05 · Category
Technology And E Commerce30 stats
01
64% of consumers purchased flowers online in the last year, up from 48% in 2019
02
Subscription-based floral services have seen a 300% growth in revenue since 2018
03
The use of AI for flower grading (quality assessment) has increased sorting speed by 400%
04
55% of florists use Instagram as their primary marketing channel for customer acquisition
05
Blockchain technology is being used by 5% of global exporters to track flower provenance and ethics
06
Mobile commerce accounts for 52% of all floral e-commerce transactions
07
Floral ERP software market is projected to grow by 10% annually through 2026
08
The average conversion rate for floral websites is 3.5%, higher than the general retail average of 2.1%
09
25% of large-scale commercial flower farms use drones for crop monitoring and pest detection
10
Dynamic pricing algorithms in flower auctions can change prices 10 times per second during peak hours
11
Personalization options (custom messages, add-ons) increase average order value in floral e-commerce by 18%
12
Automated hydroponic systems for flower growth increase yield per square meter by 25%
13
40% of floral wholesalers now offer real-time inventory APIs to their retail partners
14
AR (Augmented Reality) apps for previewing bouquets in a home environment increased sales by 11% for early adopters
15
Data-driven demand forecasting reduced inventory overstock for florists by 22% during peak holidays
16
Direct-to-consumer (D2C) brands like Bloom & Wild account for 15% of the UK online floral market
17
70% of flowers sold online are delivered via third-party logistics (3PL) providers
18
Machine learning models for predicting flower shelf life have an 85% accuracy rate
19
1-800-Flowers reported a 6% revenue increase attributed solely to their AI chatbot integration
20
Digital flower photography for catalogs is being replaced by 3D rendering in 5% of wholesale markets
21
SMS marketing for floral shops has an open rate of 98%, far exceeding email at 20%
22
Smart greenhouses using IoT sensors can reduce labor costs by 15% through precision irrigation
23
30% of floral bouquet designs are now assisted by "trending color" algorithms
24
Virtual reality farm tours for wholesale buyers increased engagement by 50% during pandemic travel restrictions
25
Same-day delivery services are offered by 85% of local florists in the United States
26
Cloud-based POS systems have been adopted by 65% of independent flower shops globally
27
Real-time GPS tracking is requested by 40% of customers ordering high-value floral arrangements
28
Floral subscription churn rates average 10% per month, but decrease with customization options
29
20% of online floral sellers now accept cryptocurrency as a payment method
30
Automated floral vending machines in airports generate average monthly sales of $15,000
Interpretation
Technology And E Commerce Interpretation
Technology and e commerce are rapidly reshaping the floral supply chain, with 64% of consumers buying online and mobile commerce driving 52% of transactions while AI-powered grading boosts sorting speed by 400% and subscription services grow revenue 300% since 2018.
Reference
Cite This Report
This report is designed to be cited. We maintain stable URLs and versioned verification dates. Copy the format appropriate for your publication below.
APA
Helena Kowalczyk. (2026, February 13). Supply Chain In The Floral Industry Statistics. Gitnux. https://gitnux.org/supply-chain-in-the-floral-industry-statistics
MLA
Helena Kowalczyk. "Supply Chain In The Floral Industry Statistics." Gitnux, 13 Feb 2026, https://gitnux.org/supply-chain-in-the-floral-industry-statistics.
Chicago
Helena Kowalczyk. 2026. "Supply Chain In The Floral Industry Statistics." Gitnux. https://gitnux.org/supply-chain-in-the-floral-industry-statistics.
Sources & references
100 datasets cited across this report · attribution is report-level