GITNUX MARKETDATA
Browse Our Category
Supply Chain In Industry
Latest update:


Supply Chain In The Electric Vehicle Industry Statistics
EVs are scaling at industrial speed while the supply chain is getting pulled in opposite directions, from permanent magnet motors and 30% inverter growth to battery gigafactories still strained by chip shortages and logistics delays. See how 700 GWh of global battery demand meets a 5 major producer grip and where bottlenecks shift next as recycling sits at only 5% worldwide and battery pack costs keep falling.

Supply Chain In The Healthcare Industry Statistics
With cyberattacks hitting 30% of healthcare supply chains in 2023 and supply chain leaders flagging 60% visibility gaps, the page shows why hospitals keep paying for disruption even when inventory and logistics look fine. It also connects rising costs, multi tier supplier risk, and cold chain reliability to the operational fixes cutting stockouts and fraud, so you can see exactly what to prioritize next.
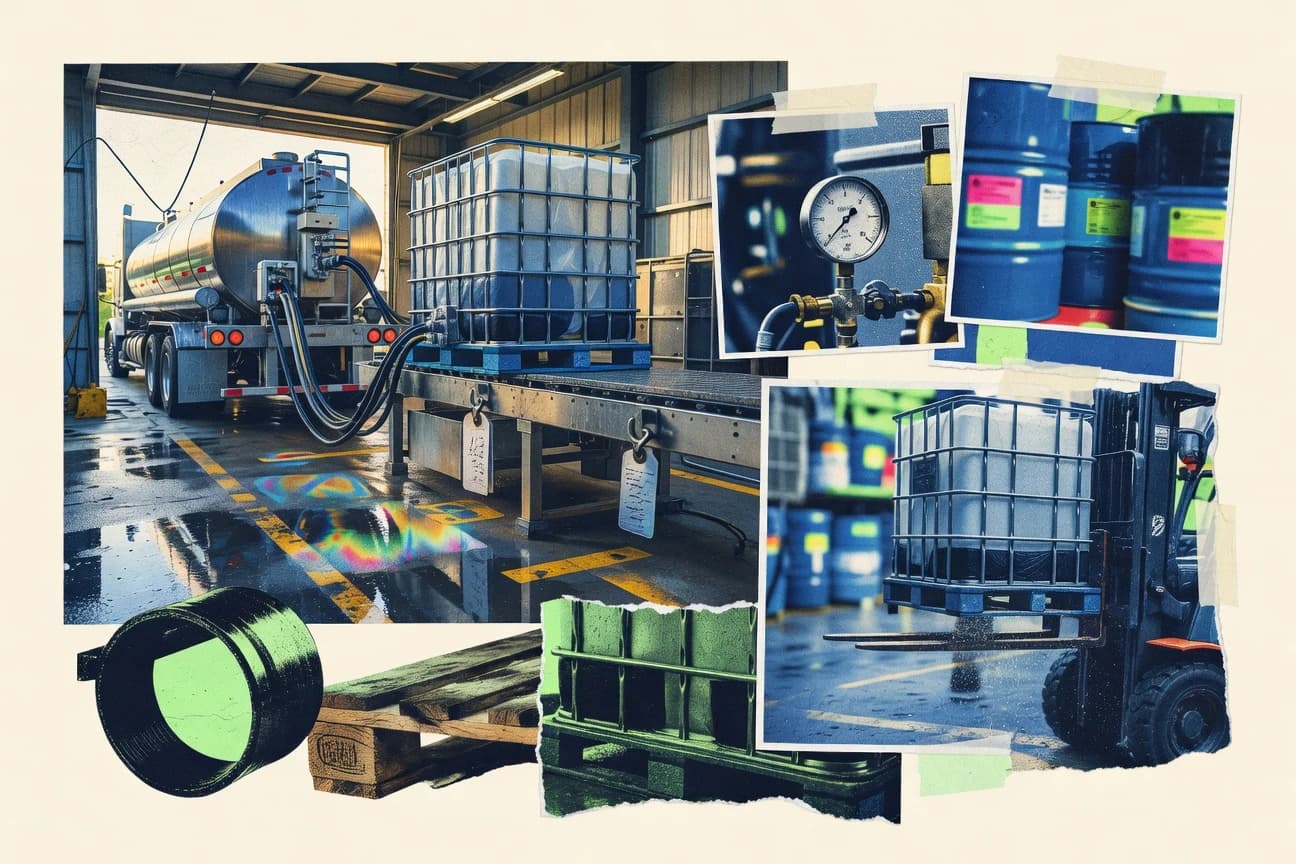
Supply Chain In The Chemicals Industry Statistics
Global chemical margins have tightened sharply, sliding from an 8 to 10 percent norm pre 2022 down to 5 percent, while logistics still consume 60 percent of supply chain costs and inventory holding runs 20 to 25 percent of working capital. This page puts 2025 relevant pressures in one place, including carbon tax adding €20 per ton in the EU and energy price shocks continuing to ripple through operations, so you can see exactly where supply chain decisions can protect margin.
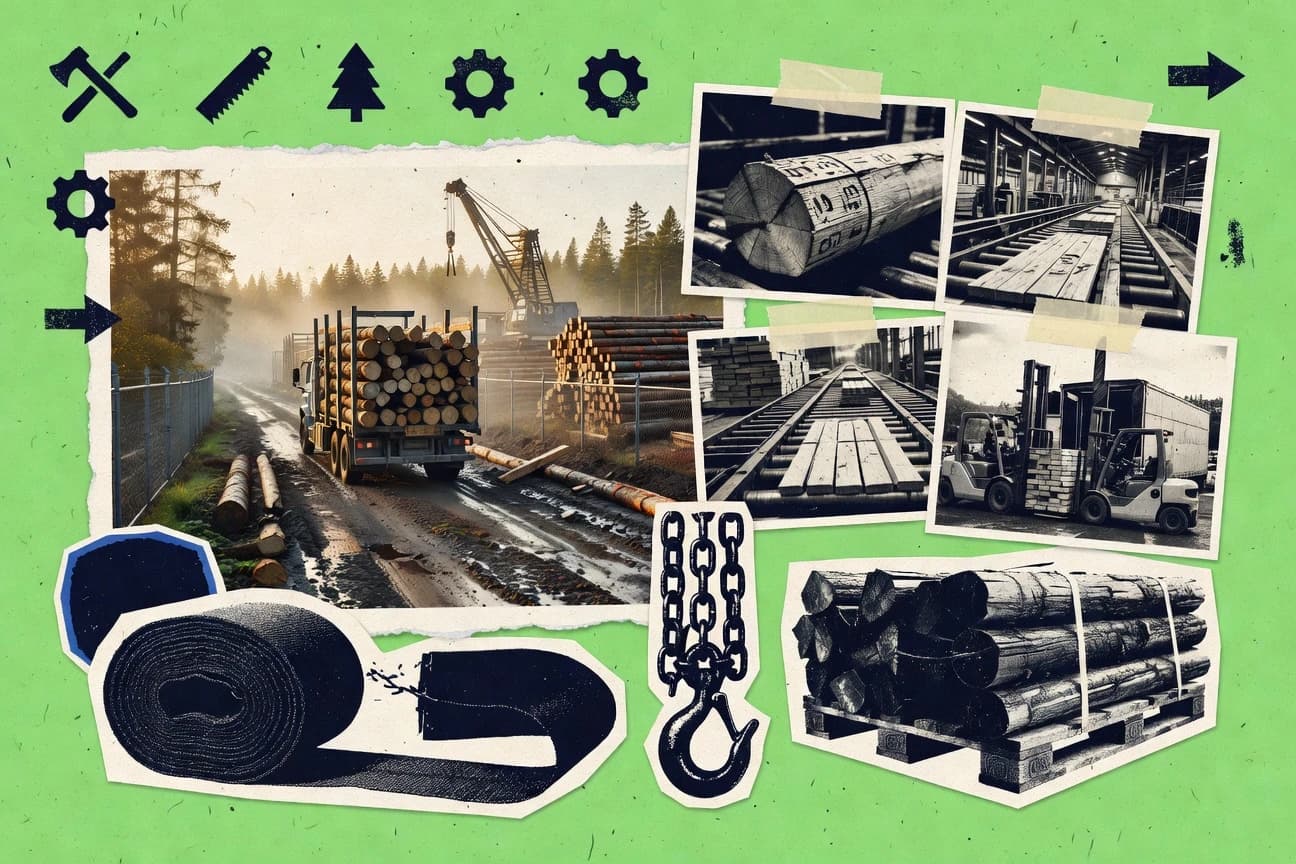
Supply Chain In The Logging Industry Statistics
With EU-27 logging at 450 million cubic meters in 2021 while most certified supply chains now face real-time compliance pressure, this page connects production and trade figures to the transport, labor, and traceability bottlenecks that decide what reaches mills. You will see how global freight costs surged 25% in 2022 alongside illegal logging estimated at 15 to 30% and why equipment capacity, certification coverage, and logistics routes reshape the entire logging supply chain from stump to shipment.

Supply Chain In The Oil Industry Statistics
From 60 days of refinery inventory to AI forecasting that lifts accuracy to 95%, this page pinpoints why mismatches still leave 40% of refineries under 80% utilization and what that costs across tank farms, hubs, and fleets. You will also see how digital twins, blockchain pilots, and cloud ERP reshape stock movements while disruptions, cyber risk, and seasonal builds push supply chain costs up and down.

Supply Chain In The Wedding Industry Statistics
Wedding supply chains run on tighter and more strategic stocking than most couples expect, from dresses turning over 4.2 times per year to florists holding only a 2 week peak bloom buffer. This page cuts through the logistics reality behind those smooth celebration moments, including the 27% of US wedding shipments slowed by port congestion and how many vendors rely on air freight and cold chain to keep everything arriving fresh.
Supply Chain In The Mobility Industry Statistics
From cyberattacks to container delays, this page weighs the shockwaves and the fixes, including inventory levels up 50% after 2021 and inventory resilience efforts shaped by 60% of executives calling geopolitical risk their top threat. You will also see how mobility logistics are changing under pressure, with nearshoring cutting lead times by 30% while supply chains still face single source fragility that hits 45% and logistics automation growing toward a $10 billion market by 2028.

Supply Chain In The Pcb Industry Statistics
Copper, resin, energy, and freight pressure the PCB bill every step of the way, with energy costs at 15% of manufacturing spend and shipping up 25% post 2022. Asia dominates supply at 85% of raw materials sourced in 2023, yet logistics delays hit 35% of firms in 2023, so this page highlights how shortages, tariffs, and underutilized capacity turn supply chain risk into real per unit pricing.
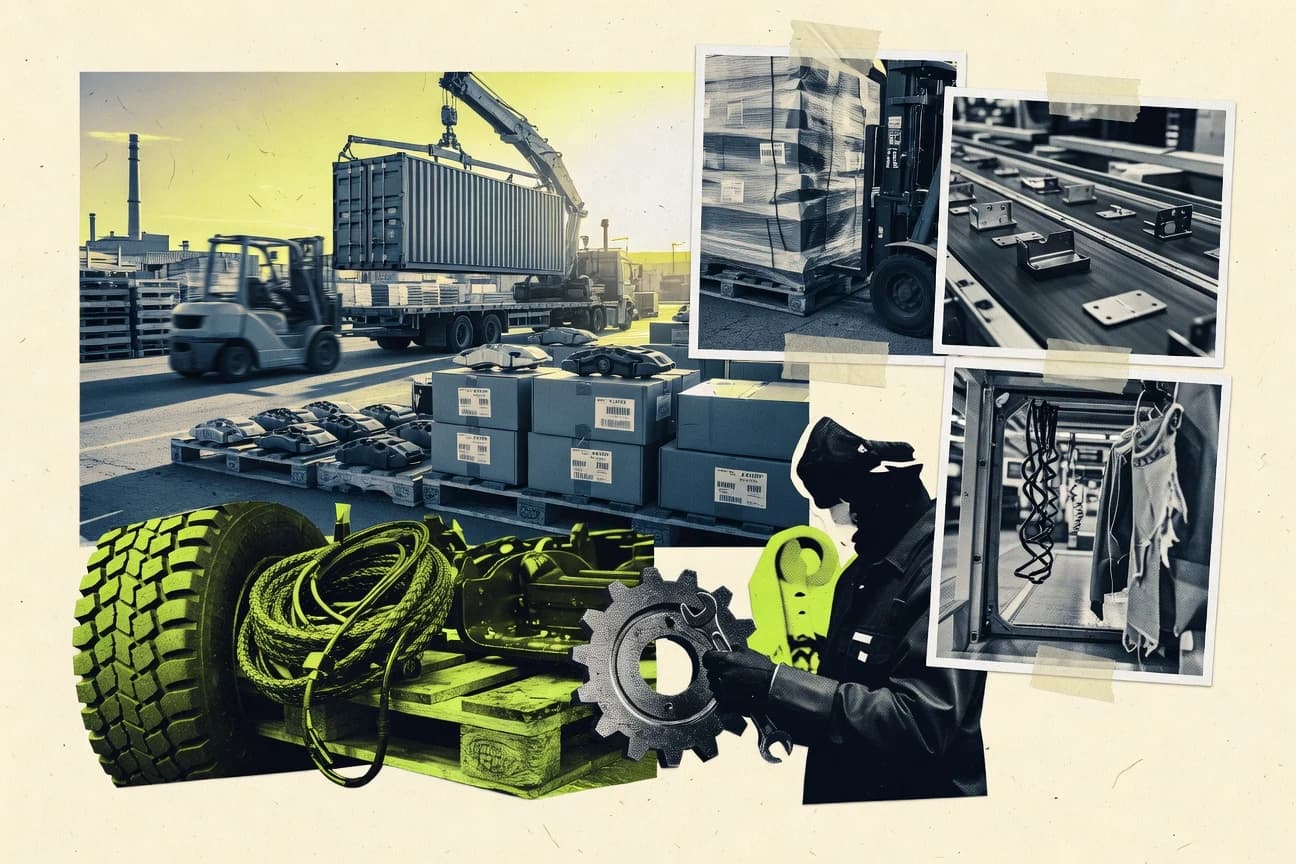
Supply Chain In The Automotive Industry Statistics
Automotive supply chains are expanding fast, with the market at $1.2 trillion in 2023 and projected to hit $1.5 trillion by 2028, yet pressures are tightening just as quickly with semiconductor disruptions, rising logistics costs, and a 12 to 16 week parts lead time. This page connects the spending and capacity picture to the real failure points like supplier single sourcing risk and cyberattacks, so you see where cost and continuity break first.

Supply Chain In The Semiconductor Industry Statistics
Supply chain risk in semiconductors has doubled since 2020, while cyberattacks on semiconductor firms have surged 300% and drought and geopolitical shocks threaten capacity where the inputs are most concentrated. If you are trying to understand how disruptions propagate from neon gas and photoresist chemicals to EUV lithography and packaging substrates, this page connects the biggest 2025 and near term stress points to what they mean for output, cost, and reliability.

Supply Chain In The Biotech Industry Statistics
With global biotech supply chain market digital and resilience momentum building fast, this page connects the $600M US government grants and $50B of projected value from biotech digitalization by 2027 to what is still breaking real operations, from cold chain failures affecting 20% of shipments each year to 29% of firms facing ransomware targeting supply chains. You also get a clear view of scale and power across the ecosystem, including Lonza’s 18% biotech CMO share, top five CDMOs controlling 55% of capacity, and the heat behind capacity bets like Samsung Biologics’ $2.1B expansion.

Supply Chain In The Legal Industry Statistics
See how legal supply chains are cutting costs and speeding casework when tools actually connect, from 35% faster matter closure with integrated supply chain capabilities to 50% lower e discovery supply chain costs through automation. Then weigh the pressure points on trust and compliance, where 78% of GCs flag supply chain cyber risk and 28% of firms report downtime from compliance audits, against the 12.5% projected software growth rate that is reshaping how legal ops buys, reviews, and governs work.

Supply Chain In The Plastic Industry Statistics
From a 200 million tonnes global retail plastic packaging flow to only a 9% global plastics recycling rate, this page connects demand hotspots with what the supply chain can actually recover and move. You get the logistics and feedstock pressure points too, including 78% plastic production capacity utilization in 2023 and shipping and trade shocks like a 300% rise in plastic resin container rates in 2021, so readers can spot where costs, risk, and sustainability targets collide.
Supply Chain In The Marine Industry Statistics
See how 2023 supply chain performance is being reshaped across the marine network, from global seaborne trade reaching 12.3 billion tons and tankers rising 3.1% to documentation and congestion gains from blockchain, digital twins, and 5G. It is also where the risks sharpen fast, with 300% more shipping cyber attacks in 2023 and disruptions rerouting 12% of container traffic in early 2024.

Supply Chain In The Msp Industry Statistics
See how MSP supply chains are being reshaped fast, from a 45 day average server lead time and 97 percent average fill rates to AI cutting stockouts by 30 percent and costs by 18 percent. But the page also confronts the pressure points, with freight costs up 17 percent and 55 percent of MSPs still relying on group buying to claw back 20 percent procurement savings.
Supply Chain In The SEO Industry Statistics
SEO supply chains are strained by content risk, with 55% of SEO content failing E E A T standards at first while algorithm churn hits 42% of campaigns yearly and 25% of traffic can evaporate after core updates. If you want a practical edge, this page contrasts where production is going wrong and where it pays off, including 80% of top YouTube SEO videos running over 10 minutes and video outperforming text with an 82% preference for SEO content.
Supply Chain In The Telecommunications Industry Statistics
With telecom logistics growing to $50 billion in 2022 and cyberattacks on supply chains jumping 300% in 2023, this page tracks how resilience is being built across networks, fiber, chips, and software, not just hardware budgets. From edge computing at $25 billion in 2023 to cloud infrastructure at $60 billion for telecom CSPs, plus 7.5% expected CAGR through 2030, it connects investment momentum to the disruption risks that can suddenly rewrite delivery timelines.
Supply Chain In The Watch Industry Statistics
See how Swiss finishing and QC discipline coexist with bottlenecks and rising logistics complexity, from 90% of watches assembled in Switzerland legally and COSC on 10% of volume to 15% shipments delayed by container shortages in 2021 and a 2023 air logistics tilt where 40% of watches head to the US and Europe. The page stitches together what happens on the line, like 200 watches/hour at final assembly and 40x final inspection for 95%, with what happens behind it, including 8% of revenue in annual logistics costs, 65% of sapphire crystals coming from Asia, and a supply chain footprint averaging 50 kg CO2 per watch.
Supply Chain In The Cannabis Industry Statistics
From 428,000 cannabis industry jobs in 2023 to trucking and testing costs that keep tightening margins, this page connects cultivation realities to logistics, compliance, and processing throughput using fresh, operationally relevant metrics. You will see where yield gains of 20 to 30 percent from CO2 supplementation clash with bottlenecks like a 40 percent labor shortage and seed to sale tracking issues reported by 40 percent of distributors, and how those gaps ripple from greenhouse power use to warehouse demand up 200 percent.
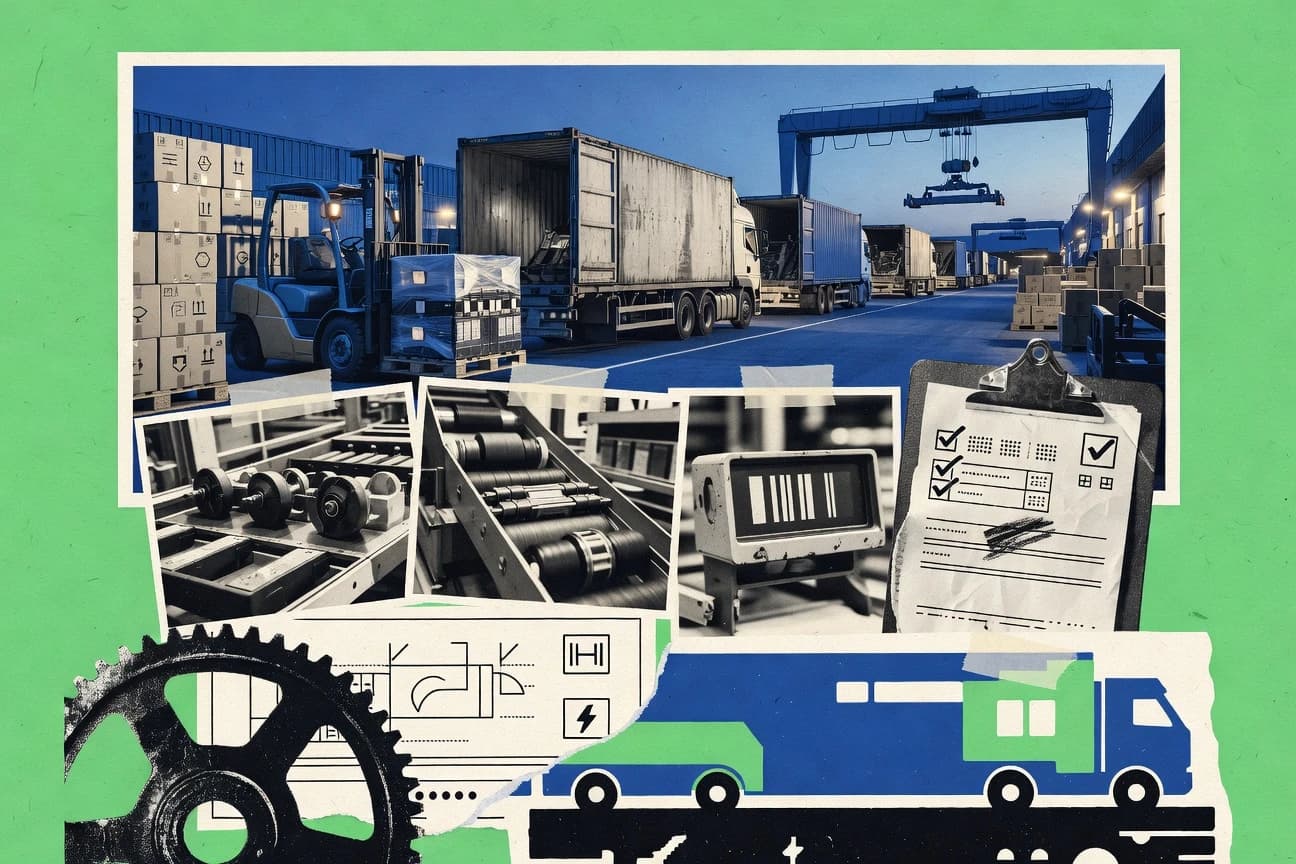
Supply Chain In The Material Handling Industry Statistics
By 2030, the material handling equipment market is forecast to jump from USD 253.01 billion in 2023 to USD 367.24 billion at a 5.4% CAGR, while warehouse automation is racing from USD 29.91 billion in 2023 toward USD 96.63 billion by 2032 at 14.1% CAGR. This page connects that buildout to day to day performance and cost pressure, from AI supported ASRS throughput up 300% and picker cycle time down 40% with slotting to cybersecurity and skills gaps that 65% of warehouses report as a real constraint.