GITNUX MARKETDATA
Browse Our Category
Safety Accidents
Latest update:


Bike Helmet Safety Statistics
Bicycle helmets cut head injury risk by 60% overall and by 65% for children, yet helmet use still varies wildly, from 85% among kids in some places to just 1 to 2% in the Netherlands. If you want the clearest answer to whether helmets truly change outcomes, this page pulls together crash, hospital, and neuroimaging evidence including a 63% lower head injury risk with ANSI or Snell certified helmets and 65% fewer facial injuries in bicycle crashes.
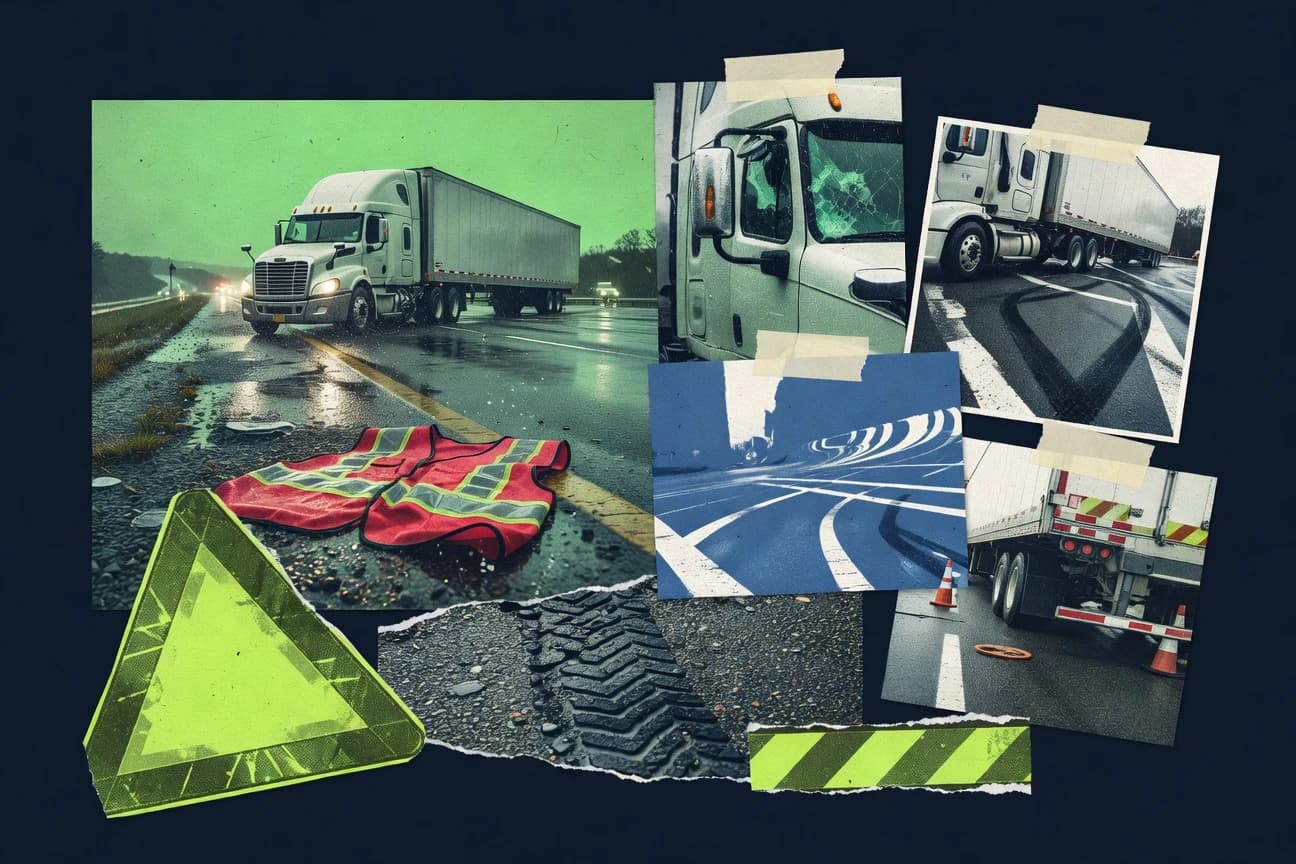
Truck Driving Accident Statistics
Truck Driving Accident patterns are stark even when you zoom out to national numbers, with 5,837 large trucks involved in US fatal crashes in 2022 and 6,511 fatalities tied to those crashes. Why it matters is what keeps repeating across years and systems, from speeding in 29 percent of large truck fatal crashes to roadside and mechanical gaps like brake issues in 29 percent of inspected crashes and tire failures in 11 percent, plus human factors such as fatigue, drowsiness, and following too closely.
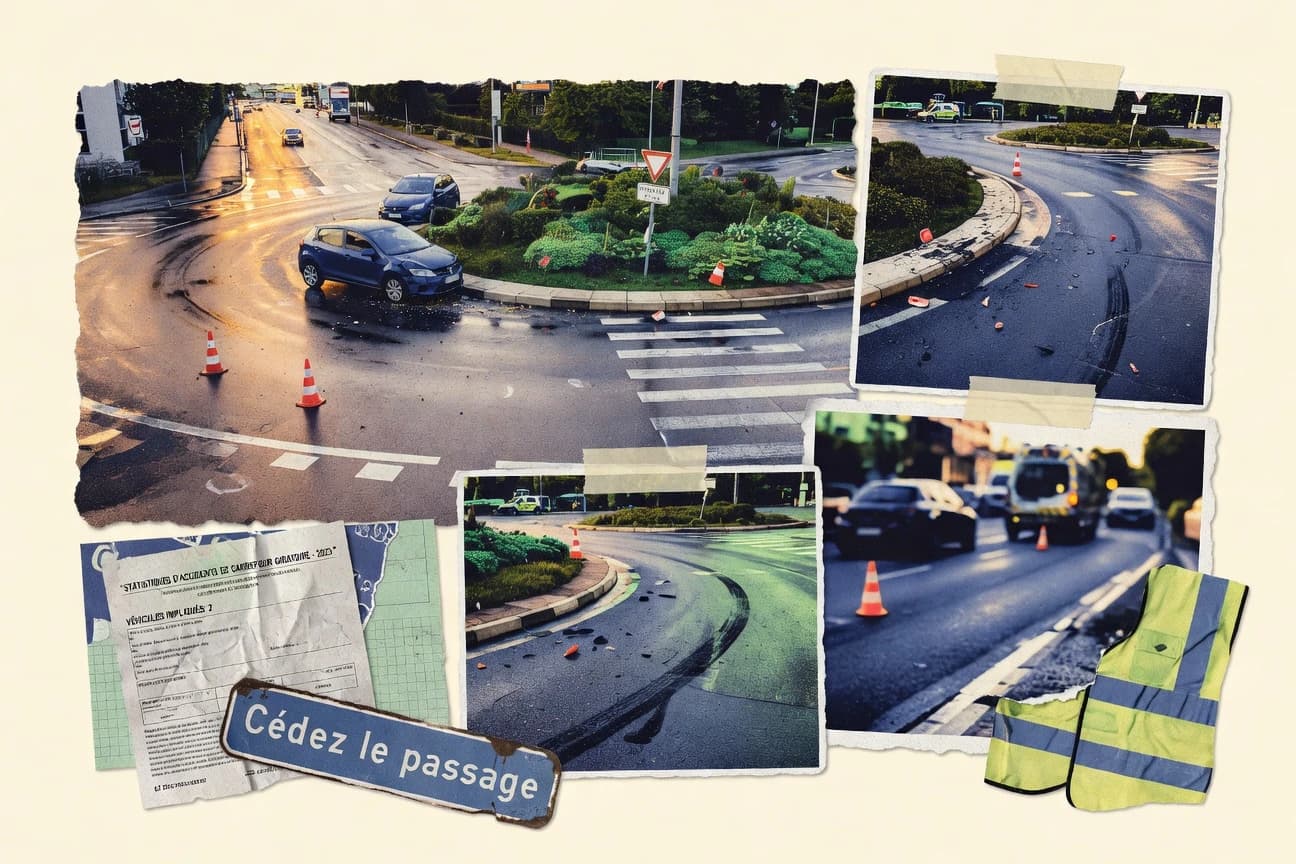
Roundabout Accident Statistics
The Roundabout Accident page pulls together 2025 level signals on safety, showing roundabouts can cut crashes by around 35% to 47% compared with signalized intersections while taking up just 3% of junctions in the UK. It also highlights the sharp tradeoffs that matter to drivers and planners, from fatality declines reported across multiple countries to recurring injury hotspots like rear-end and failing to yield.
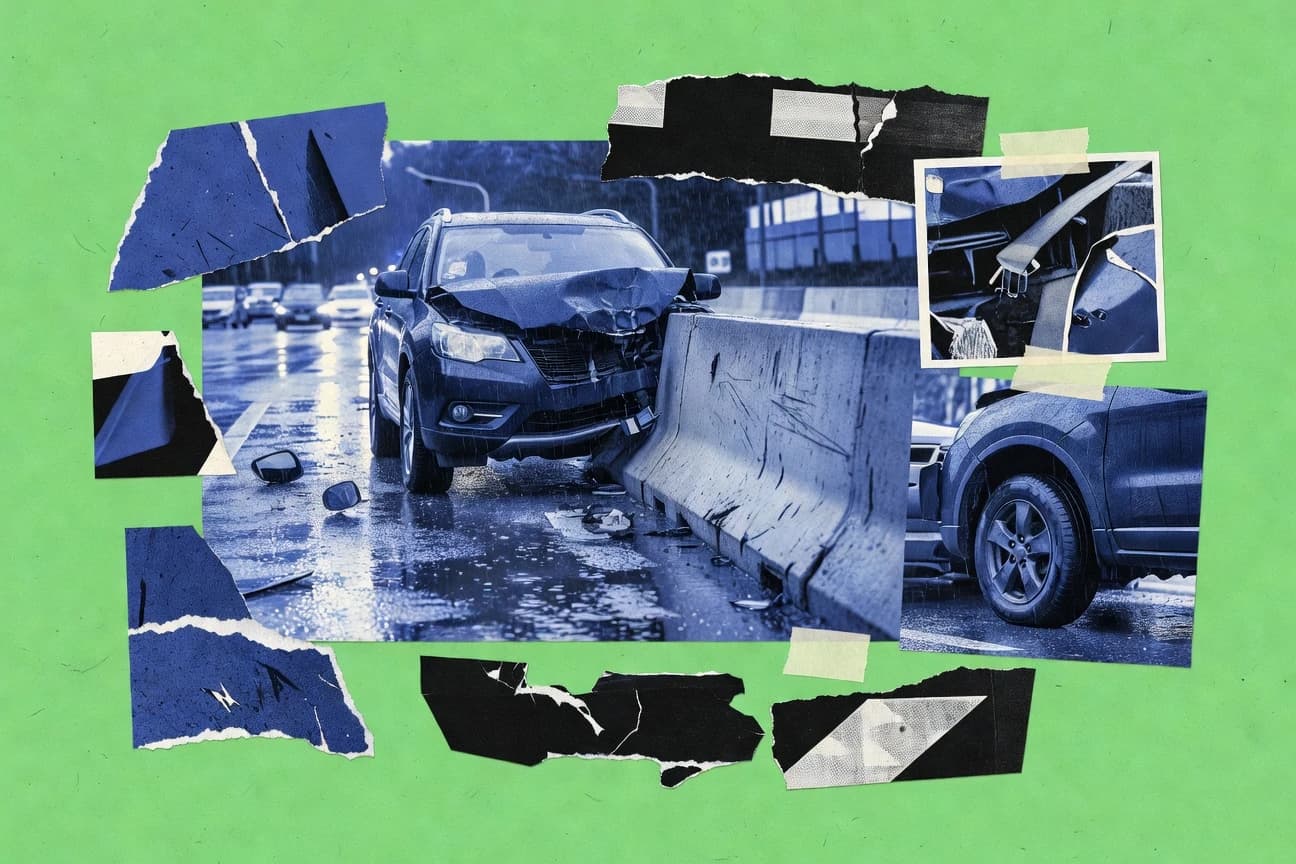
Suv Accident Statistics
SUVs are involved in 28% of all reported crashes despite a 17% fleet share and they still post a higher fatality rate than sedans and a sharp rollover penalty in real world single vehicle crashes. This page pulls together the biggest safety contrasts, including a 4.2x rollover severity jump and the way features like AEB and stability tech can materially change outcomes, so you can see where SUVs create the risk and where safeguards actually move the needle.

Escalator Accident Statistics
Fresh 2023 breakdowns point to sudden stops and other mechanical failures, but the biggest pattern is still human and environmental missteps that turn routine rides into injuries. From distracted phone walking to wet shoes and step and skirt entrapments, this page connects the most common causes with the sharpest stats so you can spot what actually raises risk.

Bungee Jumping Deaths Statistics
A grim 65 percent of bungee jumping deaths involve males aged 20 to 35, with neck or spine trauma from abrupt stops accounting for 35 percent and cord snap making up 25 percent of all worldwide fatalities. The page tracks how trends shifted year by year and includes the late lesson that operator and setup failures drive the majority of outcomes, while the overall fatality rate improved to 1 in 750,000 jumps after 2010.

Railroad Accident Statistics
Grade crossing harm remains the core story, with 2,230 fatalities from 2012 to 2021 and another 870 grade crossing injuries in 2022, even as trespasser deaths fell 12 percent to 618. You will also see how rail accidents shake out across causes and people, from 1,257 train accidents in 2022 to 94 percent of 2022 rail deaths tied to pedestrian trespass.
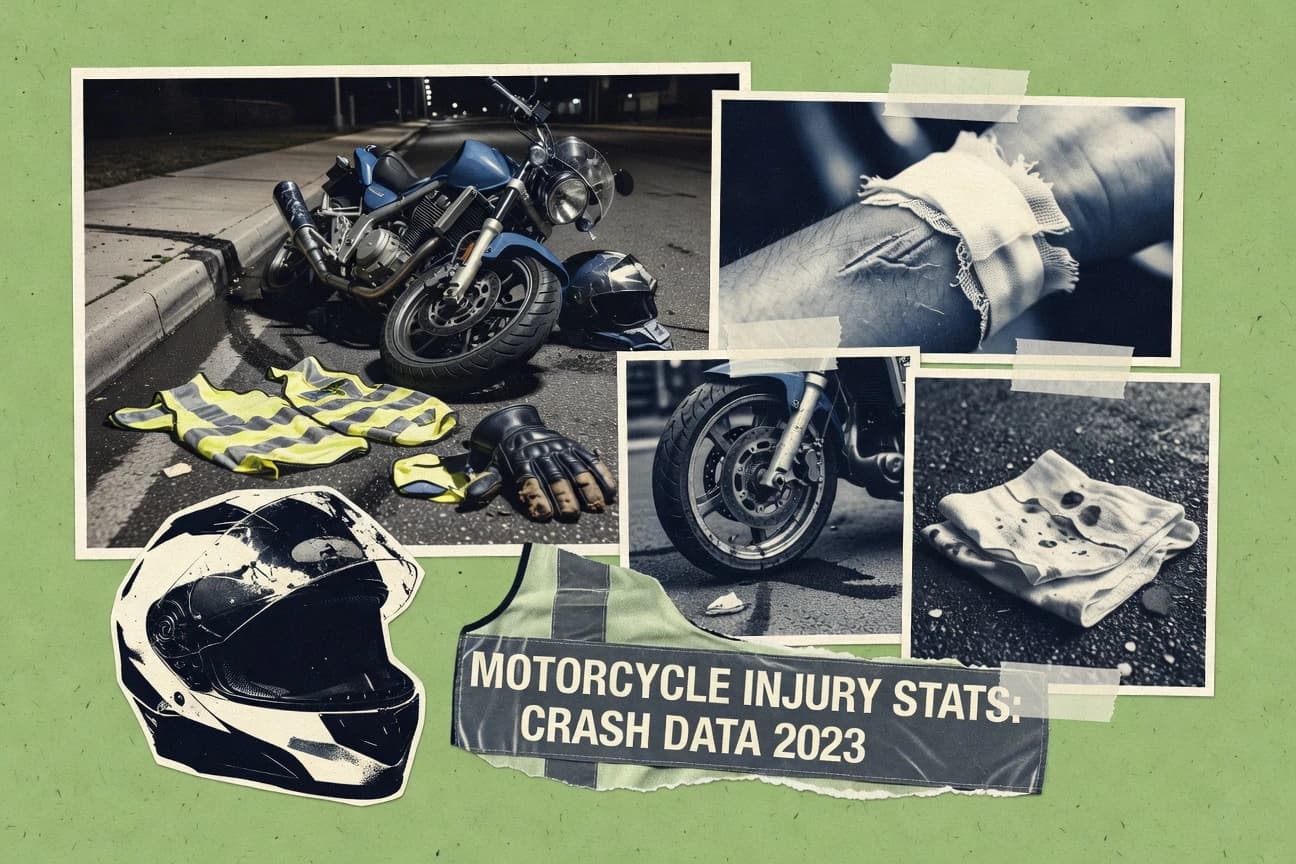
Motorcycle Injuries Statistics
Motorcycle crashes are being shaped by everyday decisions and road design, from left turns and failure to yield to loss of control, where speeding, alcohol, and inattention repeatedly show up across fatal outcomes, including 5,486 rider deaths on U.S. roads in 2022. Get the contrast that explains why the injury toll is so lopsided, such as rear end crashes making up only 5% of crashes but 25% of injuries, plus why rural run offs, curves, and wrong way riding can flip survivability fast.
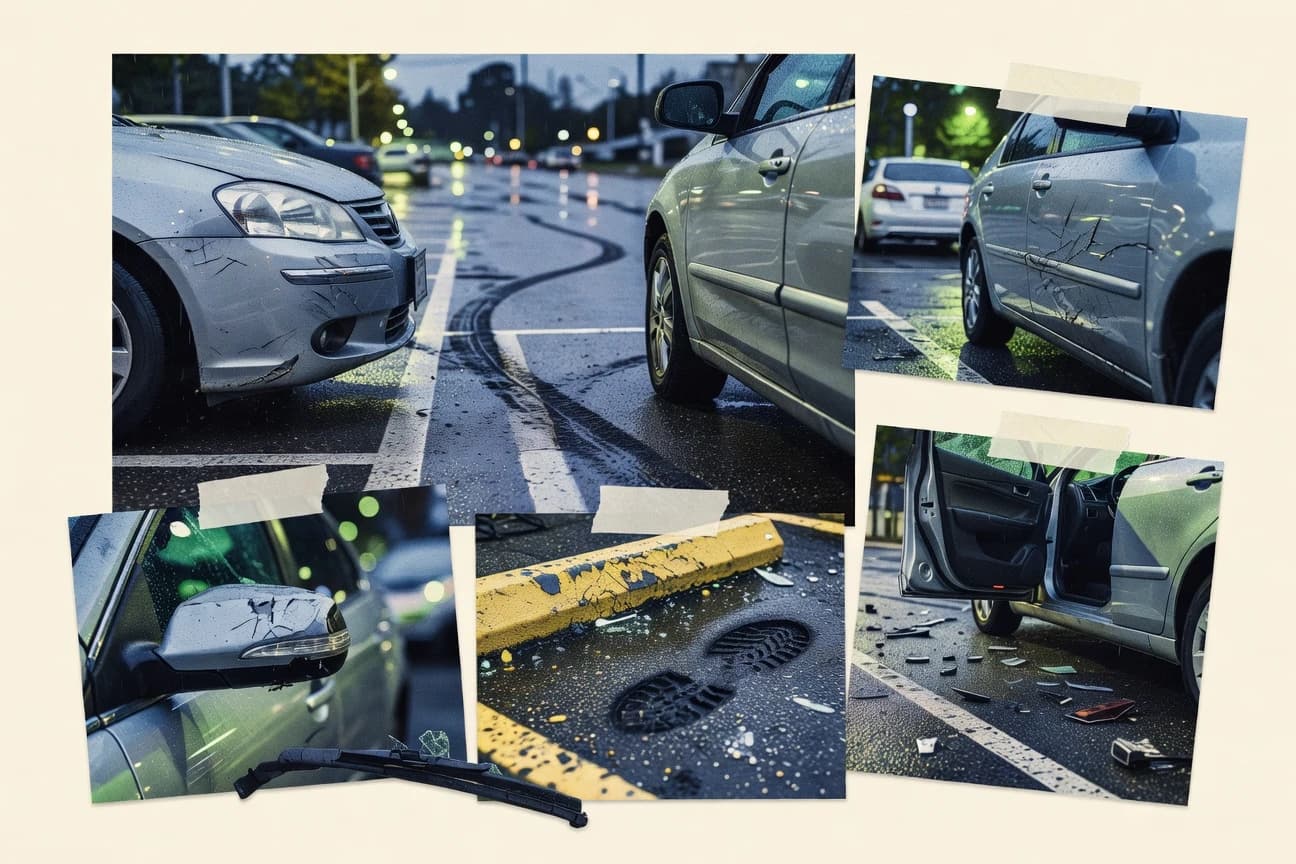
Parking Lot Accident Statistics
Backing up errors are behind 40% of parking lot accidents, while driver distraction and poor visibility stack up as major secondary risks that help explain why more than 1 in 49 accidents happens in retail parking lots. From $5 billion in annual US parking lot accident costs to how backing cameras cut crashes by 17% and better lighting reduces incidents by 25%, this page connects the most common causes to concrete ways to prevent the next dent, injury, and claim.

Reverse Parking Safety Statistics
Even camera and sensor upgrades cannot erase the reality that reverse parking still accounts for major collision share, from 72,000 US incidents in 2022 to 145,000 low speed EU crashes. This page connects those injury totals with the newest prevention proof points, so you can see exactly where reversing risk spikes and what actually cuts the contacts, scrapes, and backovers.
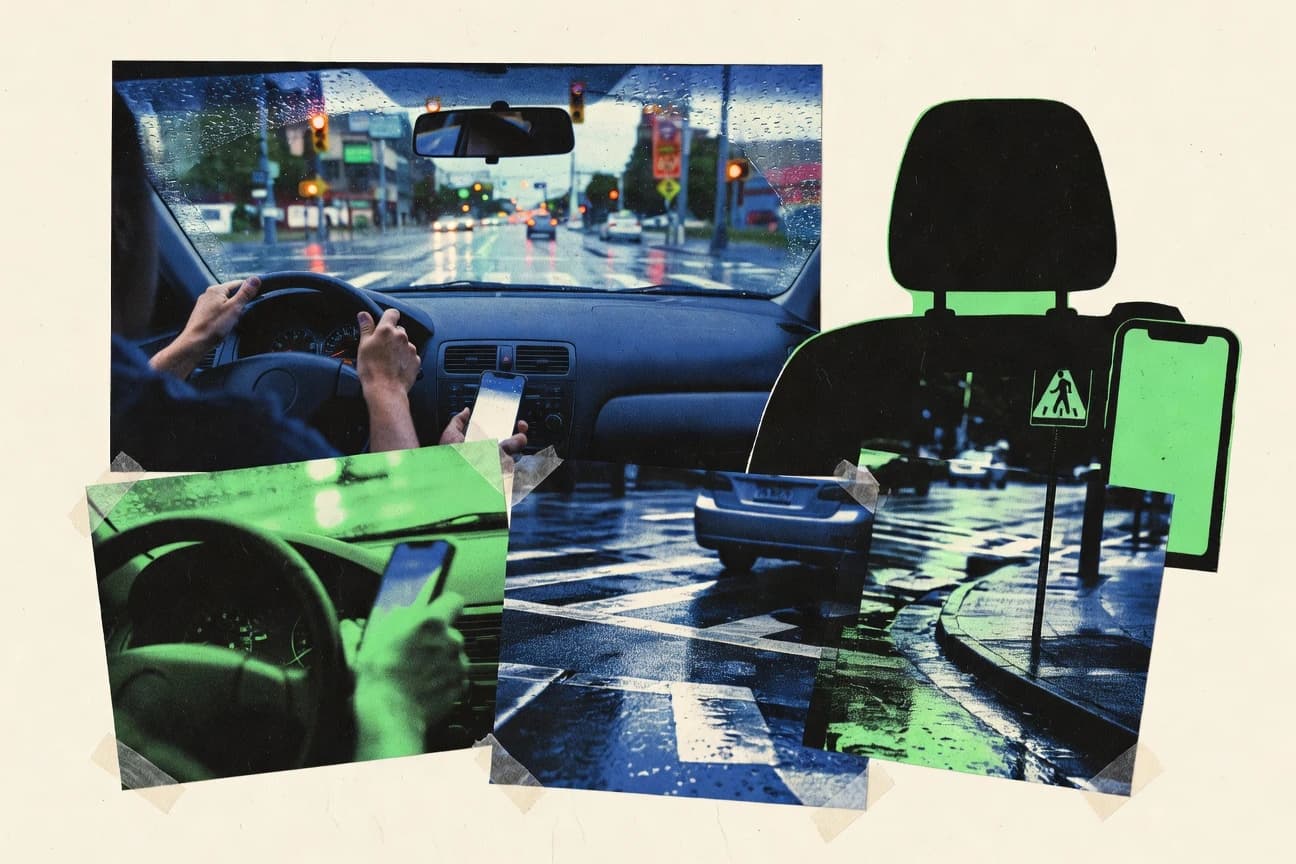
Texting While Driving Accident Statistics
Texting while driving is costing lives right now, including 3,308 deaths tied to texting in the US from NHTSA data and $230 billion in annual crash costs linked to texting distraction. The page maps how risk shifts by group and behavior, from teens facing a 4 times higher death risk to phones turning everyday driving moments into crashes that hit harder, even when the call is hands-free.

Motorcycle Safety Statistics
With motorcyclists making up just 3% of registered vehicles yet accounting for 14% of all traffic fatalities in 2021, the page spotlights how the risk gap keeps widening, including 5,932 deaths in 2022 and the stark helmet reality that 82% of riders killed in 2020 were not wearing a DOT compliant helmet. You will see how head injuries dominate outcomes, where states like California and Hawaii lead in death rates, and which road, behavior, and policy factors most often turn a ride into the fatal moment.

Skydiving Fatalities Statistics
Canopy mishaps still dominate, but the contrast is sharper than you might expect with 25% of USPA fatalities tied to canopy collisions and low or pilot error at 32% of deaths during 2011 to 2021, while 35% of night fatalities are driven by visibility problems. The page connects those cause specific patterns to who is most affected and how rates changed, including a 2022 USPA fatality rate of 0.28 per 100,000 jumps, so you can see exactly where prevention is gaining ground and where it is not.

Aviation Safety Statistics
Jet hull losses hit a new low in 2023 at just 0.09 per million departures while the risk index for commercial operations reached 0.18, the smallest on record. This page connects those safety gains to what is changing on the ground and in the cockpit, with accident causes, fatality breakdowns, and regional rates side by side across the latest datasets.

Visual Distractions While Driving Statistics
Visual distractions are tied to 8% of fatal crashes in 2021 and drive 424,000 police reported crashes each year with eye time lost to phones, navigation, and even looking away at billboards. You will see how those brief glances translate into real outcomes like visual phone use tripling crash risk and nighttime distractions raising fatal crash odds by 2.3 times.
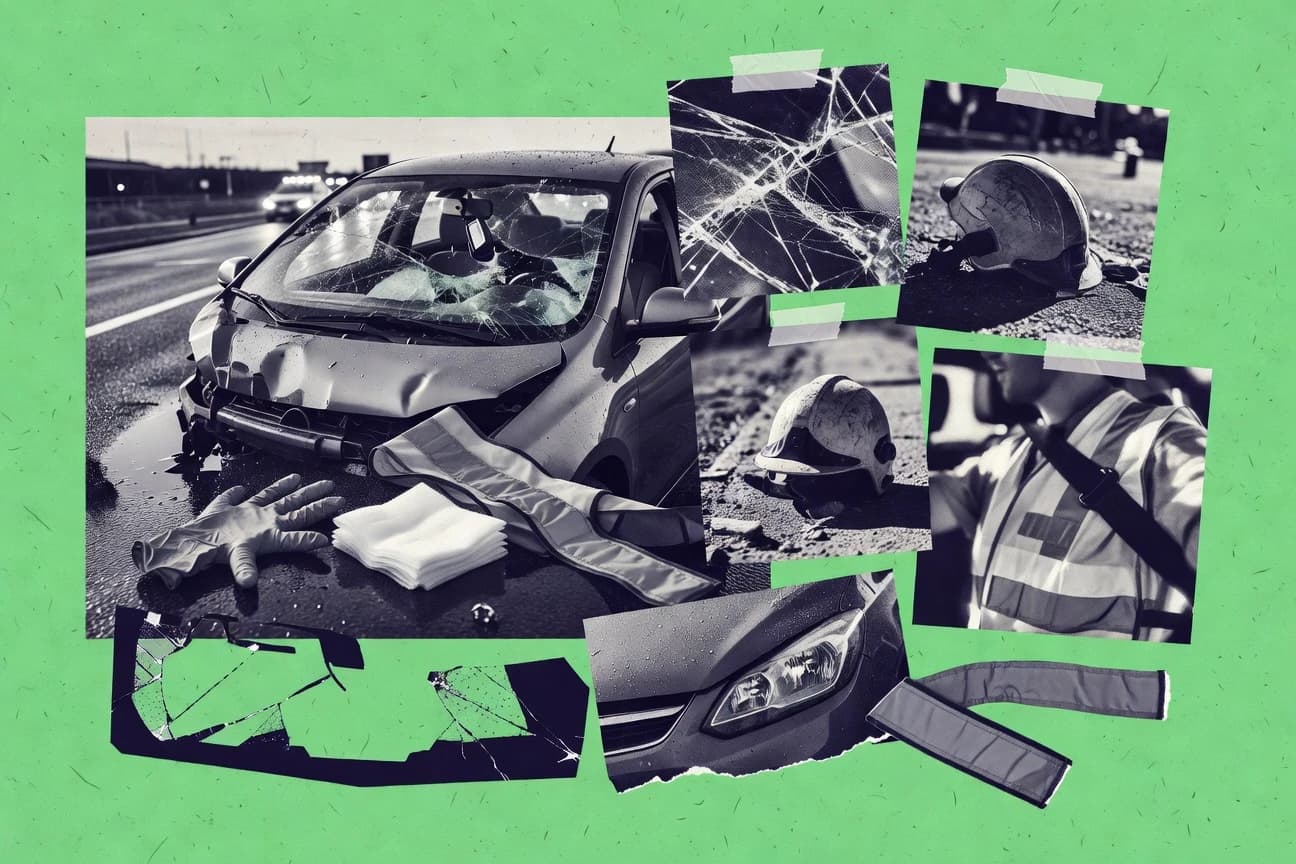
Car Accident Head Injury Statistics
Motor vehicle crashes produce 681,000 emergency department visits for motor vehicle related TBIs in the EU in 2019, yet the risk shifts sharply by age, gender, and setting, from teen drivers with TBI rates 3 times higher than adults to older adults where adults over 65 account for 28% of hospitalizations and men 18 to 34 dominate urban head injury cases. This page connects those patterns to what actually changes outcomes, including seatbelts cutting head injury risk by 60%, airbags reducing severe TBI in frontal impacts by 30%, and rapid EMS within 20 minutes improving survival by 25%.

Rottweiler Attack Statistics
Rottweilers account for 85% of US fatal dog stats yet still rank among the highest in severity, with a 4.2 severity index versus 1.1 for Collies and ER visits far outpacing smaller breeds, like 15% versus 2% for Chihuahuas. This page puts today’s risk in perspective, including 66 fatal deaths from 2005 to 2017, insurance payouts about 3x higher than Labs, and a 27% severe attack rate versus 8% for Huskies.
Driving Safety Statistics
With 37% of children aged 0 to 14 killed in crashes tied to alcohol-impaired incidents and repeat DUI offenders driving 24% of alcohol-related fatal crashes in 2021, the pattern is far more persistent than most people assume. The page also stacks the counterpoint of restraint and distraction with seat belt use dropping to 68% among fatally injured front occupants and texting distraction fueling 25% of fatal crashes for ages 15 to 20, so you can see exactly where prevention efforts matter most.

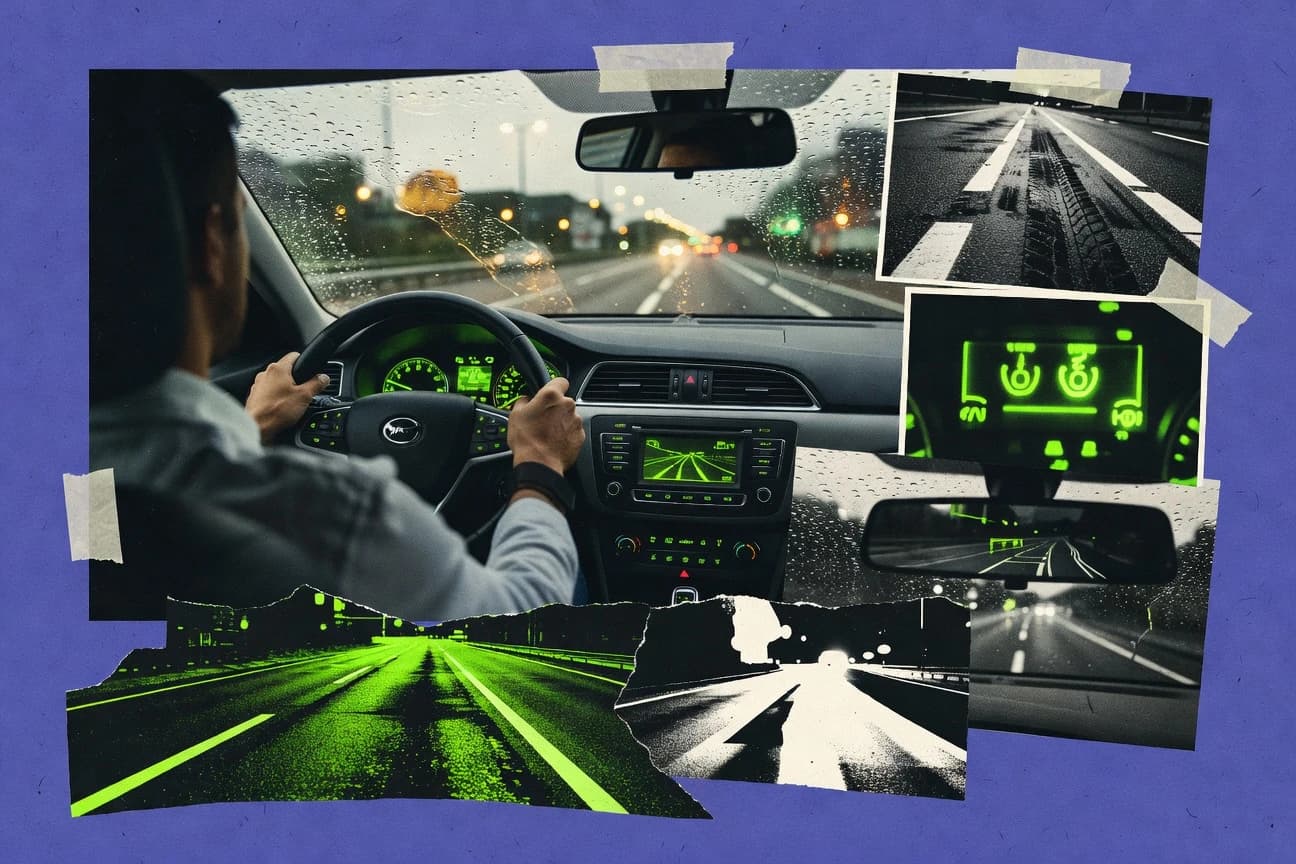
Night Driving Statistics
Nighttime accounts for 55% of all US fatal crashes while vehicle miles traveled drop to 27% so the risk rises fast once the sun goes down. You will see where the danger concentrates most, from 18,000-plus nighttime fatal crashes in the US to post-midnight spikes in urban areas and visibility related failures that make headlight glare and unlit roads turn into the real crash drivers.
Slips Trips Falls Statistics
Falls are a childhood crisis and a workplace budget breaker at the same time, with children under 5 driving 2.8 million ER visits every year and slips, trips, and falls costing US employers $11.7 billion in workers’ compensation in 2021. From helmet free bicycle head injuries to stair and bathroom hazards that dominate at home, this page connects the most preventable risk points to the staggering medical, legal, and productivity toll.