GITNUX MARKETDATA
Browse Our Category
Safety Accidents
Latest update:


Skateboarding Safety Statistics
With 144,000 US emergency department visits and 2021 showing a 15% jump in injuries after COVID, Skateboarding Safety breaks down what actually breaks, sprains, and concusses riders most, from wrist fractures at 24% and ankle sprains at 18% to the grim reality that full gear use can cut overall injury rates by 60%. You will see how age, experience, and protection habits flip the risk, including helmets reducing head injury risk by 85% and only 10% of skateboarders wearing them consistently.

Hunting Accident Statistics
With 2025 data still scarce, the latest snapshot makes the point fast: firearm discharges drive 45 percent of hunting accidents in 2022, while fatal incidents also keep clustering around tree stands and gunshot related injuries. If you hunt, the page is worth your time because it pairs those big causes with sudden, practical contrasts like how mistaken identity produced 15 percent of Texas accidents in 2023 and why Wisconsin self inflicted wounds accounted for 20 percent of its 2022 fatalities.

Cruise Ship Overboard Statistics
With a 2023 recovery rate of 42 percent for 28 reported man overboard incidents across major cruise lines, the page turns survival into a measurable story, not a tragedy. You will see why alcohol intoxication accounts for 70 percent of male victims and how rescue outcomes swing from cold water survival near 10 percent to far better first hour results.
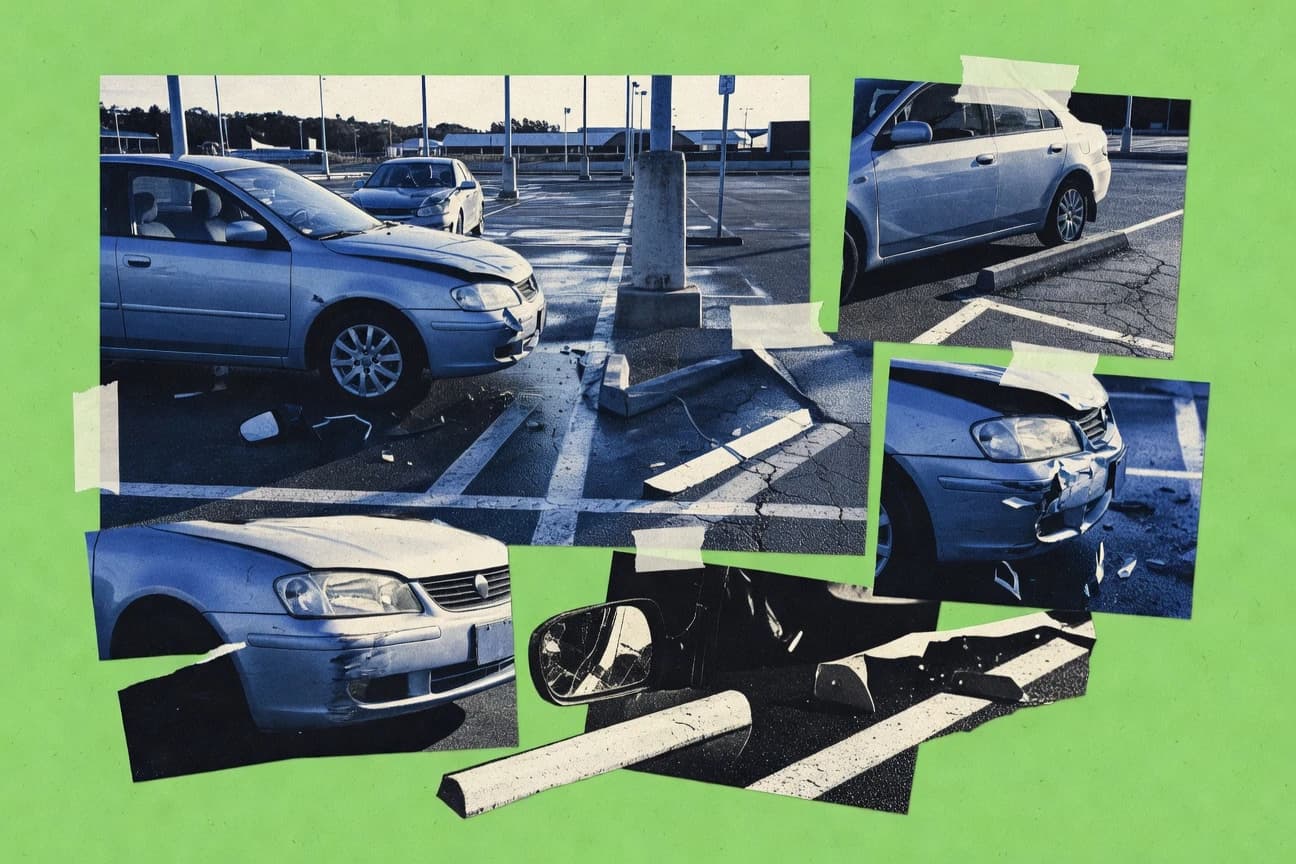
Accidents In Parking Lots Statistics
Parking lot crashes are often framed as minor fender moments, yet distractions, blind spots, and door openings drive a steady mix of severe harm. With US 2021 costs topping $8.5 billion in damages and over 210,000 pedestrians injured worldwide each year, this page connects the most frequent, fixable causes to the real injuries they trigger.

Scuba Diving Deaths Statistics
With 152 reported scuba diving fatalities worldwide in 2023 preliminary data from DAN, this page puts a spotlight on what has been driving deaths and why the risk is not evenly spread. From heart and drowning accounting for the largest shares to fatal patterns like deeper depth ranges, novice overrepresentation, and equipment or medical issues, you can see where tragedy clusters and what to watch next.
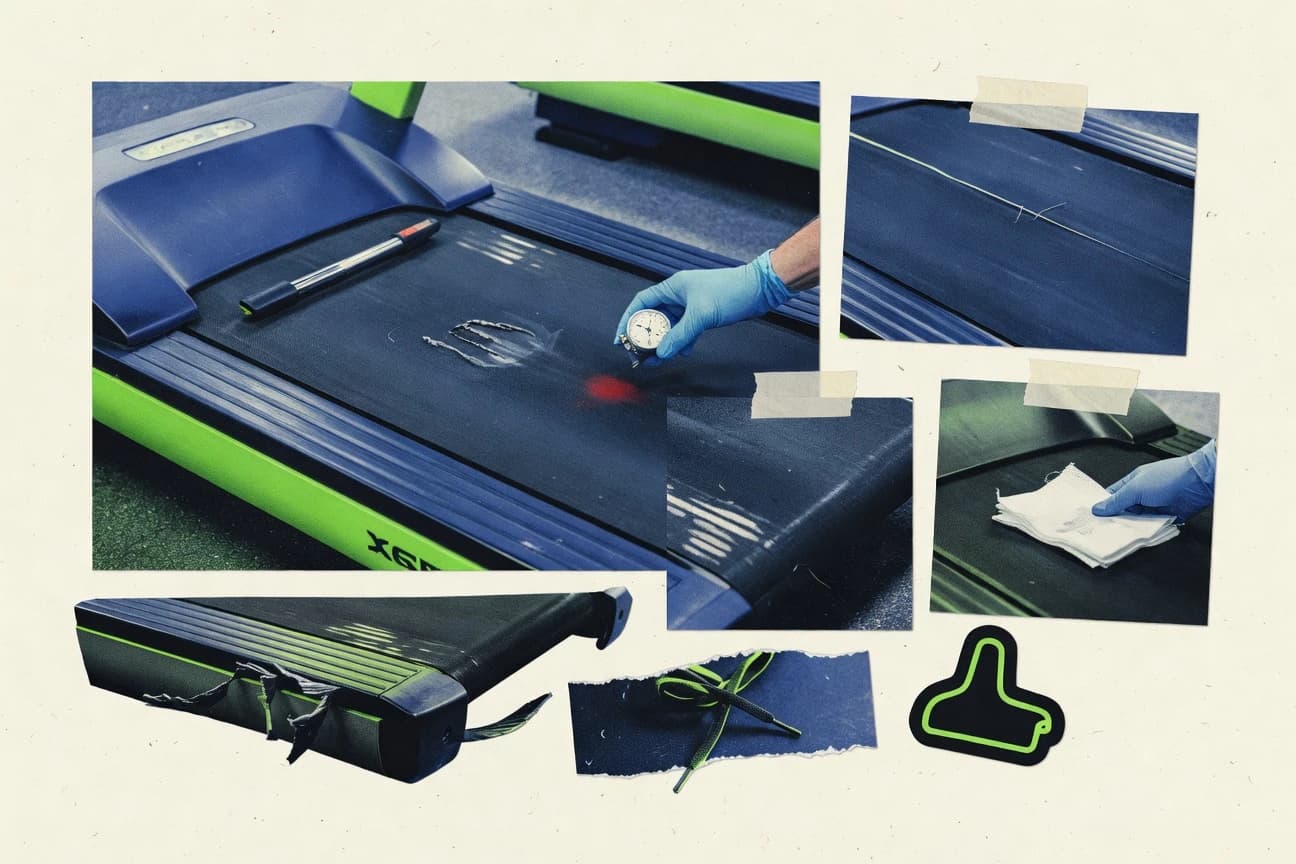
Treadmill Injuries Statistics
Treadmill injuries are still surging with 26,100 ER visits in 2023, and the biggest culprits are surprisingly everyday mistakes like unsafe supervision in 65% of pediatric cases and running too fast for fitness in 35%. This page breaks down what drives falls, belt injuries, and overexertion so you can spot the risks hiding behind speed settings, distractions, and maintenance before they become a trip to the ER.

New York City Car Accident Statistics
With 228 traffic fatalities in 2022 and speeding behind 58% of fatal crashes, NYC’s most dangerous mistakes often look routine until you see the percentages side by side. From 2025 prelim shifts like 12 fewer cyclist fatalities than 2022 to the sharp spikes in night and intersection deaths, this page breaks down the specific behaviors and conditions that drive crashes, injuries, and serious outcomes across New York City.

Child Pedestrian Accident Statistics
Texas boys under 15 account for 65% of child pedestrian fatalities, even though under 5s make up 25% of child pedestrian deaths and kids 5 to 9 face a pedestrian death rate of 1.2 per 100,000. This page connects the age and setting where danger spikes, from dusk to dawn hit-and-runs and speeding drivers to how crosswalks and supervision can sharply reduce the odds of a lifelong injury.
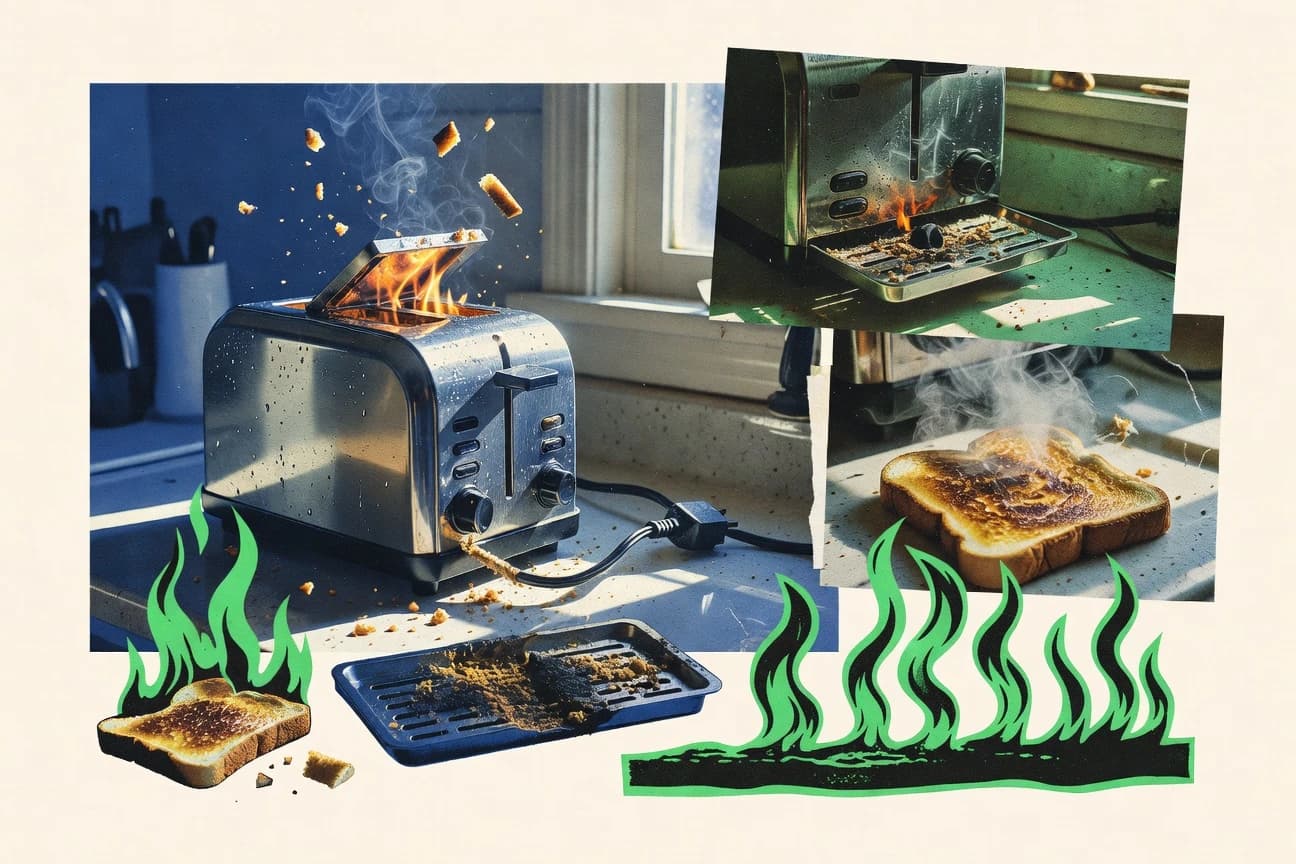
Toaster Fires Statistics
From peak evening spikes when 68% of toaster fires happen between 6 and 10 PM to the culprit mix where crumbs ignite in 35% of cases and faulty wiring drives 42%, this page explains what actually turns a casual snack into a home risk. It also pairs the latest injury and cost reality with practical prevention wins like cleaning cutting fire risk by 70 and auto shutoff preventing 60% of potential incidents.

California Car Accident Statistics
California recorded 4,454 traffic fatalities in 2022, up 4.3% from the year before, and the patterns are anything but random. From speeding tied to 40% of fatal crashes and DUI deaths at 1,047 to cell phone use in 6,500 crashes and rear ends driving 32% of collisions, this page pinpoints the behaviors, locations, and risk groups most likely to turn ordinary trips into life changing ones.

Paintball Injuries Statistics
Eye injuries lead paintball trauma at 45% of cases, but the more surprising read is what keeps players out of the game for longer. With 4,127 US emergency department visits in 2022 and injuries rising 15% from 2018 to 2022, the page breaks down what actually drives ER visits and which fixes like full face masks and chronograph testing cut risk the most.
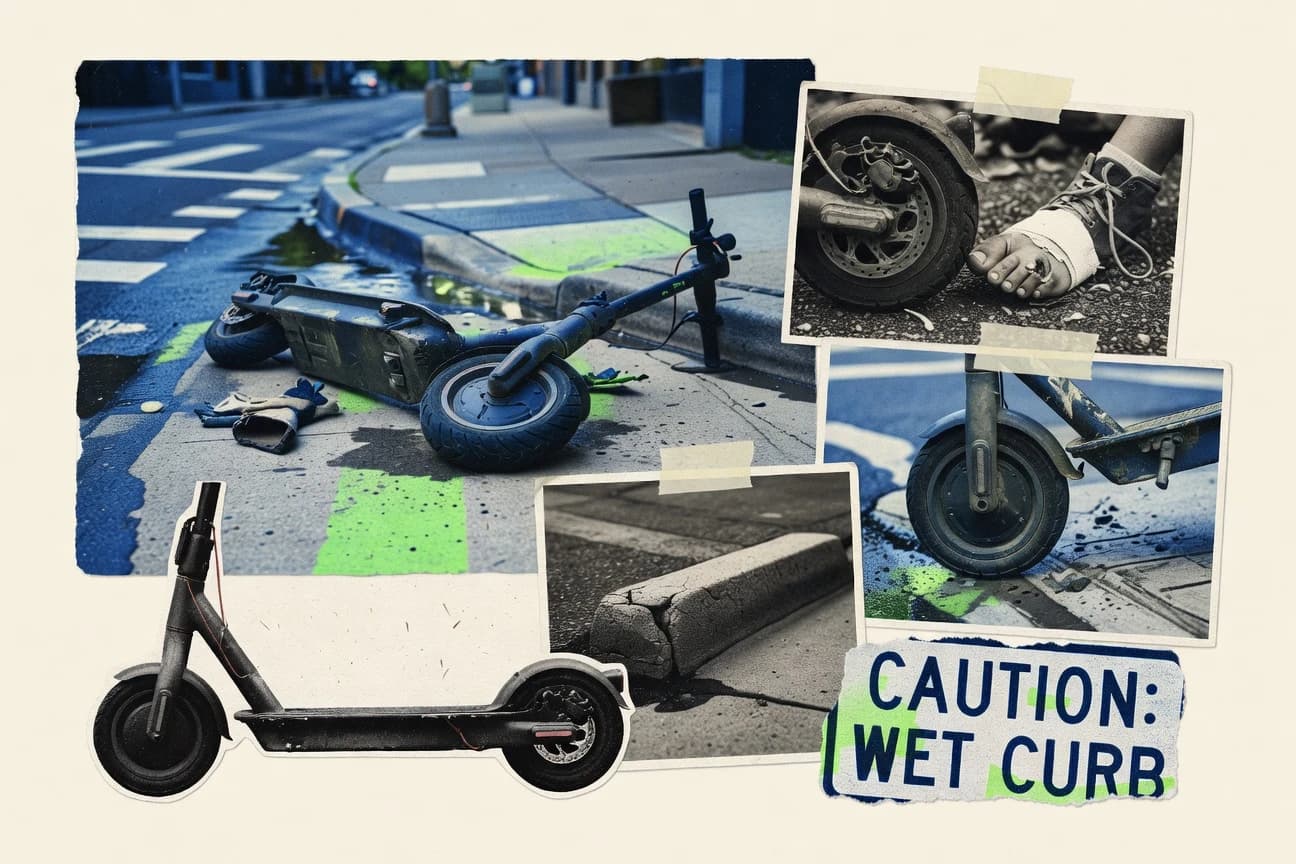
Electric Scooter Injury Statistics
Despite city bans, 8% of e scooter incidents still happen on sidewalks and nighttime riding accounts for 37% of crashes. With loss of control in 60% of single vehicle crashes and a $1,649 median California hospitalization cost for one trauma visit, these latest injury statistics explain exactly where risks spike and why helmets and safer infrastructure are still failing too many riders.

Tailgating Statistics
Tailgating is still driving staggering harm, with 5,200 fatalities in 2022 and $100 billion a year in damages and losses, while rear end tailgating crashes alone hit 1.8 million incidents in 2022. Scroll through the page to see how the risk spikes in the moments people think are “normal” like rush hour, night driving, rain, and work zones, and how enforcement and insurance costs pile up when impatience turns into impact.

Lost At Sea Statistics
Nearly 60% of vessel losses reported in 2022 concentrated in the British Isles, North Sea, and English Channel, while hotspots across South China, Indochina, Indonesia, and the Philippines keep telling the same warning story for global trade. Cargo ships drive the highest annual share of losses, fires and explosions hit record levels, and every delay in SAR and recovery multiplies costs and casualties you can quantify.

Autobahn Safety Statistics
Germany’s Autobahn logged 1.4 fatalities per billion vehicle km in 2022, versus 2.8 on UK motorways and 3.4 on Spain’s AP network, while serious injuries reached 1,284. The page also links these outcomes to what most often goes wrong, from wrong way deaths and speed to nighttime and wet road risk, and shows how targeted safety changes are beginning to bend the curve.

Amusement Park Accident Statistics
At US amusement parks, there are on average 4.4 fatalities per year and roller coasters alone account for 25% of deaths, yet the biggest patterns are often about what happens after the ride, with 60% of fatalities involving a fall entirely out of the vehicle. This page breaks down where park deaths cluster, from maintenance setups and crowd pressure to fixed versus mobile ride risk, and pairs it with the leading medical causes like intracranial hemorrhage.
Truck Driver Injury Statistics
Fatigue and speed turn into injury risk fast, with long hours over 60 per week raising injury risk 2.5x and speeding driving 29% of fatal truck crashes with injuries, while musculoskeletal disorders still account for 45% of trucker nonfatal injuries. If you drive, manage fleets, or study safety, this page maps the practical culprits behind the injuries from poor ergonomics to dock lighting and untreated sleep apnea so you can spot what is most likely to hurt people next.

Skydiving Dangers Statistics
From 2025 reporting ready rates like 0.28 fatality per 100,000 jumps in the US and 0.1 percent AAD malfunction, Skydiving Dangers breaks down what actually drives injuries and fatalities with the kind of hard-to-spot culprits that statistics often hide, like packing errors causing 5 percent malfunctions and low turn pilot errors tied to 45 percent fatal crashes. You will see why the headline number matters less than the chain of failures, including 20 percent of low turns linked to canopy control losses and 70 percent of tandem fatality declines since earlier decades.

Teenage Distracted Driving Statistics
Even though teens are only 6.5% of drivers, they account for 9% of distraction related deaths. Phone distraction is behind 1 in 5 teen crash deaths, and the costs add up fast with $15,000 on average per crash, so this page makes it clear why small moments of checking a screen can turn into big consequences for everyone on the road.

Forklift Accident Statistics
Tip-overs still drive 24% of forklift fatalities, and training gaps show up in a staggering 70% of incidents, so the risk often feels preventable but isn’t. Get the breakdown of what flips outcomes from improper loading and brake failures to pedestrian blind spots and fatigue, plus the real financial hit, with annual forklift accident costs reaching $170 billion globally.