GITNUX MARKETDATA
Browse Our Category
Safety Accidents
Latest update:


Electric Bike Accident Statistics
E-bike accident rates and injury severity are skyrocketing worldwide.

Fire In The Workplace Statistics
With 1,000+ fatal workplace fires in the US each year tied to ignition sources like smoking and open flames, Fire In The Workplace statistics connect what actually sparks fires to the rules meant to stop them, from OSHA hazard communication and emergency action training to NFPA standards for alarms, sprinklers, and ITM. You will also see why controls that seem procedural, like hot work permits and refreshed training, can change outcomes, including measurable gains in correct extinguisher use and evacuation compliance.

Trampoline Injury Statistics
With US emergency data showing trampoline injuries spike in summer and can reach an estimated 200,000 a year, this page connects where injuries happen, how families use safety nets, and what happens after the ER visit, from follow up within 30 days to admissions and surgery. You will also see why safer home enclosures are far from universal, how guidance like no somersaults and routine inspections can change outcomes, and what major recall activity says about preventable risk.

Accidental Gun Deaths Children- Statistics
Even with firearm deaths at 0.52 per 100,000 people in 2022, the grim pattern for kids is tightly linked to access and storage choices, including 1 in 4 youth firearm deaths tied to unintentional shootings. This page connects the latest prevention evidence to what works, from measurable shifts in household safety behaviors to estimates that safe storage and child access prevention policies can prevent a substantial share of pediatric deaths.

Child Drowning Statistics
Each year, drowning claims more children than many families realize, and the gap between what feels preventable and what happens in real life is stark. Get the latest 2026 backed by current statistics and see which situations most often lead to tragedy and how quickly prevention can change the outcome.

Fall Height Death Statistics
Fall height deaths still claim lives in the places you assume are safest, with the 2026 figures showing the risk remains sharply real rather than drifting away. If you have ever wondered what actually drives these fatalities and where prevention efforts miss most often, this page lays it out with clear, up to date numbers.
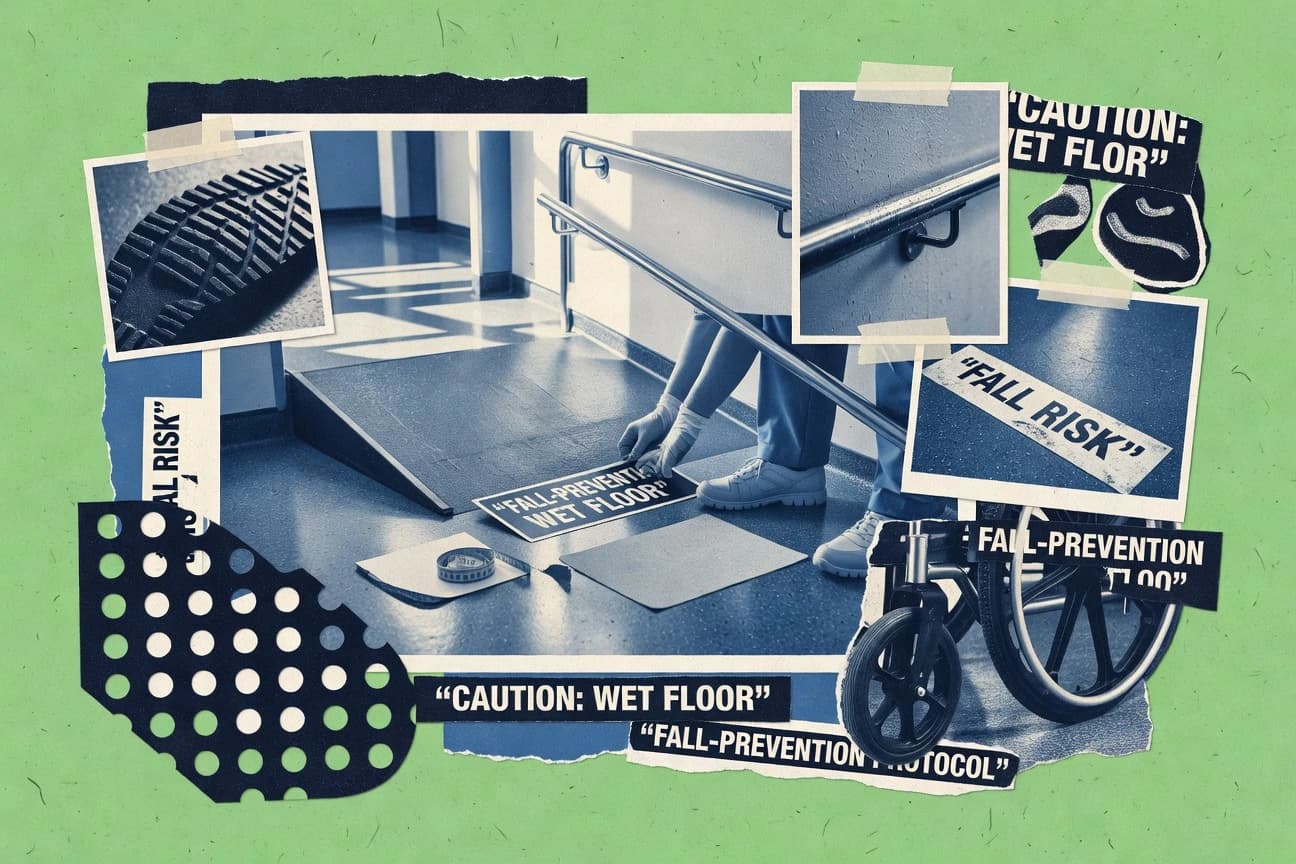
Fall Prevention Statistics
Falls remain the second leading cause of unintentional injury death globally, yet practical prevention can cut risk in measurable ways such as up to a 12% lower risk with home safety and 67% lower odds of recurrent falls with individualized plans. Want the most useful tension behind the headlines between the 0.8–1.4% hospital fall rate and the fact that 77% of hospital fall events tie back to environmental factors?

Private Plane Crash Statistics
Private Plane Crash breaks down what the latest U.S. general aviation fatality risk really looks like, from 4.2 fatal accidents per million flight hours and 727 fatal GA accidents in the NTSB Aviation Accident Statistics portal to a NASA Ames estimate that only 0.45% of flights end in at least one fatality, then connects survivability and tech choices like ELTs, EGPWS and ADS-B to the real phases where loss of life concentrates. If you want to understand why runway and approach hazards, restraint use, and emergency alerting equipment can swing outcomes so dramatically, this is the page to reconcile the gap between everyday risk and high consequence surprises.

Boating Accident Statistics
With 4,291 boating-related fatalities in 2022, the page shows how drowning remains the leading killer at 2,493 deaths, with 54% of victims not wearing a life jacket. It also highlights alcohol involvement in 1,724 fatalities and the sharp concentration of deaths tied to operator issues and vessel collisions.

Drunk Driving Age Statistics
Even with a legal minimum drinking age of 21 in 49 states plus DC, 0.6% of US adults ages 18 to 20 reported drinking and driving in the past month and 8% reported it at least once in the past year. For context, alcohol-impaired driving fatalities reached 13,524 in 2022, and the page explains how the under 21 zero tolerance BAC thresholds of 0.02 and 0.04 stack up against the 0.08 limit used for drivers 21 and older.

Fatal Car Crash Statistics
With 42,514 road crash deaths estimated for 2019 in the US alongside 38,680 fatalities reported for 2022, this page pairs the latest U.S. counts with the risk details behind them, from speeding and alcohol impaired driving to unbelted occupants and helmetless riders. You will also see how pedestrian and bicyclist losses stack up against passenger car and truck deaths, plus the safety gaps like fatalities occurring at night and in crashes where belts were unavailable or unknown.
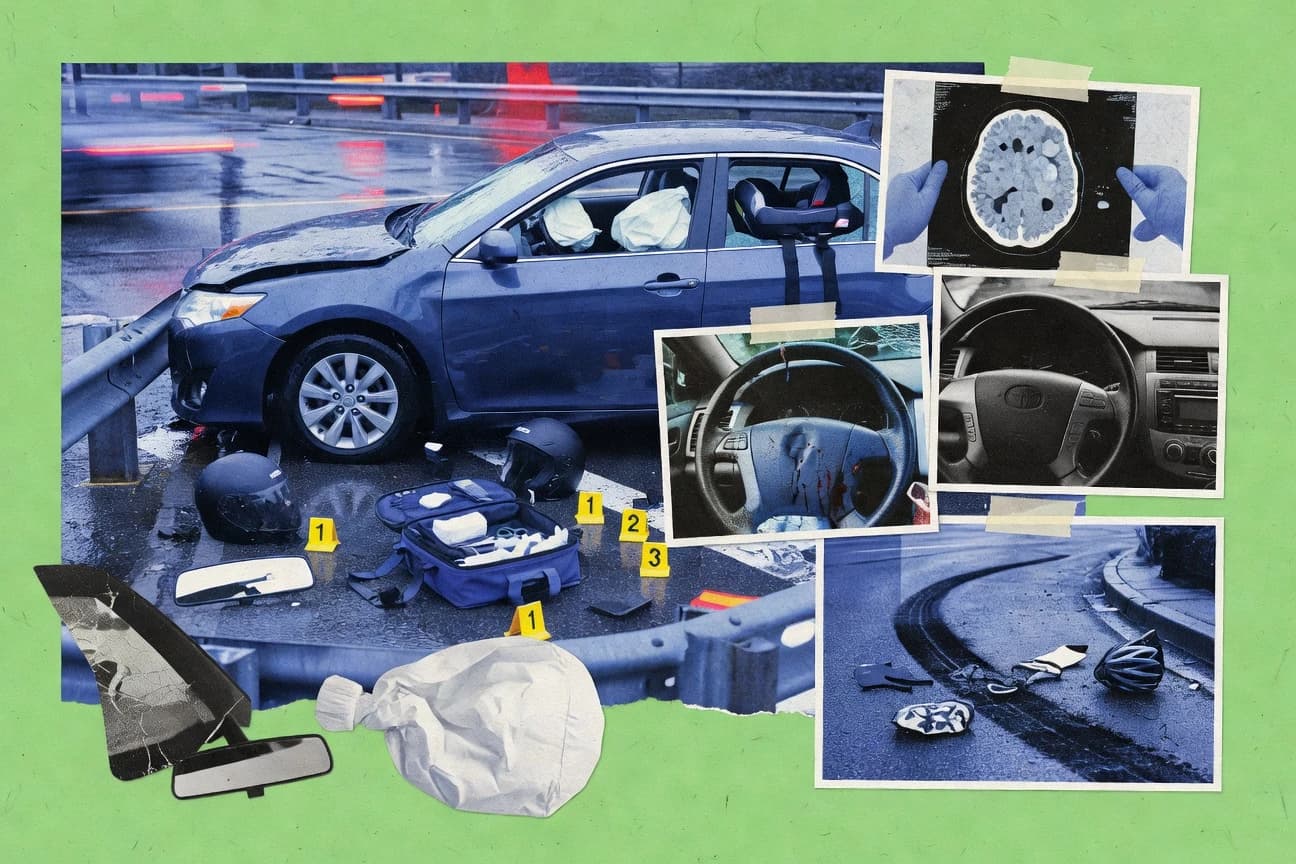
Traumatic Brain Injury Car Accident Statistics
A Traumatic Brain Injury can be life changing even when it starts as a seemingly “minor” car crash, with 10% of mild TBI patients developing post concussion syndrome and 12% still facing persistent cognitive deficits at 1 year. From 10.0 million estimated TBI related injury deaths worldwide in 2019 to how seat belts, helmets, CT rules, and early tranexamic acid treatment shift outcomes, this page connects the risk behind car accidents to the real decisions that improve survival and recovery.

Motorcycle Risk Statistics
Motorcyclists were 13.6% of all traffic fatalities in 2022 while making up only 3% of registered vehicles, and total motorcycle deaths climbed to 5,579. Motorcycle Risk pulls together the helmet, night riding, alcohol, and intersection patterns behind those outcomes so you can see exactly what is driving the risk.

Helmet Statistics
Helmet use still looks stubbornly low, with only about 1 in 5 children (ages 6 to 12) wearing helmets while biking and just 2.6% of bike trips in one U.S. city involving helmeted riders, yet helmet promotions show what’s possible with 57% reporting helmet use after intervention. The page pairs these real world gaps with the safety payoff, including bicycle helmets cutting head injury risk by 63% and motorcycle helmets reducing head injury risk by 69%, so you can see both the adoption challenge and the stakes.

Texting While Driving Statistics
Texting while driving is tied to 3,142 deaths and about 424,000 injuries from distracted driver crashes in 2022, yet most states still rely on uneven rules, with only 14 having primary enforcement for texting and 14 for handheld phone bans as of 2024. The page pulls together NHTSA findings and study results to show just how reaction time, lane control, and crash risk shift when a driver’s eyes and hands are off the road.
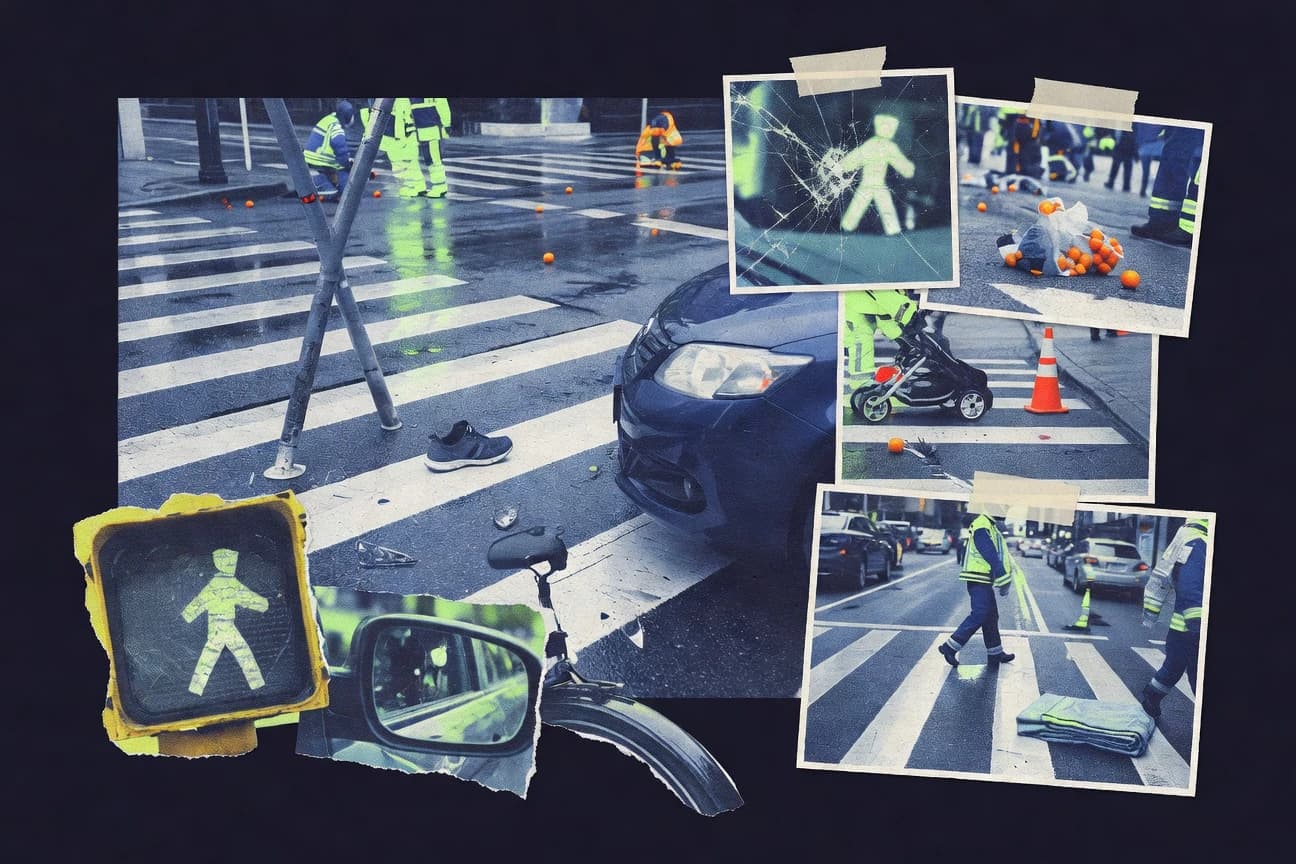
Pedestrian Accidents Statistics
Pedestrian harm is alarmingly concentrated, with 6,721 pedestrians killed and 78,000 injured in US motor vehicle crashes in 2022, and pedestrians still make up 18% of all traffic deaths while only 1.1% of injured people in traffic crashes. This page pairs that stark contrast with what drives risk most, from speed and lighting to crosswalks and vehicle type, so you can see exactly where prevention could matter most.

Kitchen Safety Statistics
Every year, 36,000 people die from cooking related fires and burns and 185,000 deaths come from household air pollution tied to cooking, yet many households underestimate the hazards by skipping simple defenses like kitchen fire extinguishers and anti scald devices. Get the practical, kitchen specific safety stakes behind the U.S. burden of scald injuries and the small behavior gaps that turn a hot liquid moment into an emergency.

Dog Breed Attacks Statistics
With 2018 showing 3.8 million people bitten by dogs in the United States each year yet fatality risk remains small, this page follows what happens next in real outcomes, from 76 percent of emergency department visits involving kids under 15 to 1 in 5 bite patients needing surgery. You will also see how costs and complications stack up alongside the breed patterns behind fatal cases, including Pit bull type dogs in 60 percent of reported deaths where breed was known.

Electric Scooter Accident Statistics
From 40.6 million e-scooter rides in 2022 to rising emergency visits after 2017 to 2019, the page pinpoints what injuries actually look like, including alcohol involvement around 1 in 4 patients and head and face injuries in 62% of European hospital cases. It also shows why helmets matter, with head injury severity dropping to an odds ratio of 0.33 even though helmet non use is reported in more than 80% of riders across studies.
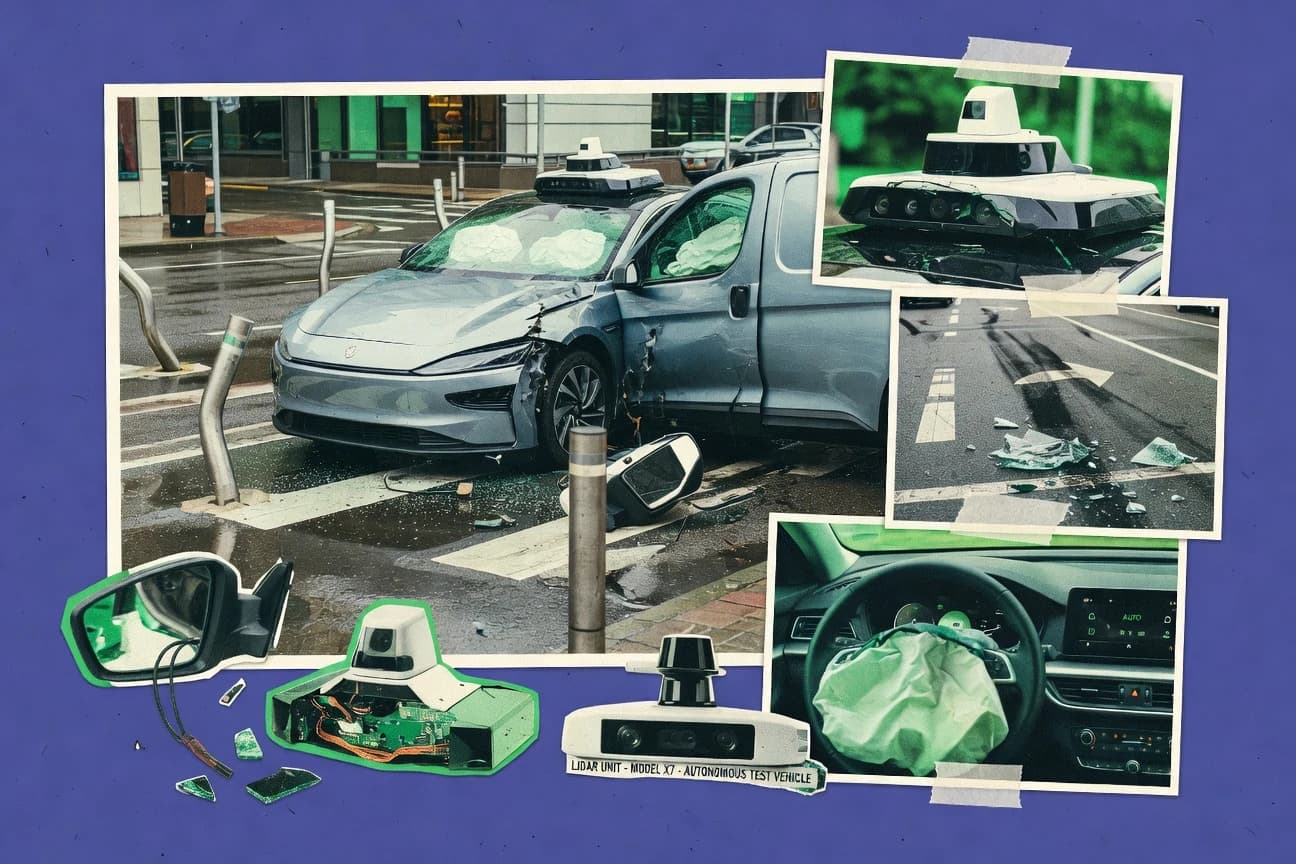
Self Driving Car Crash Statistics
With 42,915 people killed in US motor vehicle crashes in 2021, the page connects the dots between distraction, partial automation, and emerging self-driving reporting metrics so you can see where safety claims meet measurable crash exposure. It also pulls in key baselines from distracted driving deaths, NHTSA AV reporting rules, and SAE Level 3 to 5 requirements to explain why “millions of miles” can still produce uncomfortable, trackable risk.