
Market data
Medical Conditions Disorders
Explore verified medical conditions disorders statistics and market research reports with sourced data and trend analysis.
Latest update:
 Elif Demirci

Pancreatic Cancer Survival Statistics
Pancreatic Cancer Survival statistics reveal a rare bright spot in 2026, where outcomes improve enough to change what “survival” can mean for real people. You will see exactly how survival rates shift by stage and treatment, and why the gap between early detection and late diagnosis is wider than most families expect.

Autistic Statistics
From 34.5% of autistic children also identified with language impairment to 60% reporting bullying at school, these statistics spotlight how autism touches learning, healthcare access, and daily safety in measurable ways. You will also see the real-world contrasts behind support and cost, including unmet service need at 34.0% and global economic estimates reaching $68.9 billion in 2019.

Cleft Palate Statistics
Recent 2026 figures highlight a sharp mismatch between cleft palate needs and the real-world timing and access to care, making outcomes less about biology and more about systems. The page breaks down the most telling trends so you can see where delays and disparities show up, and why closing that gap matters.

Lymphoma Cancer Statistics
Non Hodgkin lymphoma survival and response rates span from a median of 5.1 years to complete responses like 54% with axicabtagene ciloleucel in ZUMA 1, while CAR T and antibody strategies are reshaping outcomes even as staging and prognostic tools such as the IPI and Deauville PET score keep risk sharply stratified. This page also tracks how the market pressure is translating into faster innovation, including the 2023 U.S. oncology drug spend reaching $44.0 billion and CAR T therapy growth projected to $14.8 billion by 2030.

Cancer Statistics
With fresh 2025 figures on new cases and survival, this Cancer statistics page highlights a key shift you may not expect, where risk and outcomes don’t move in lockstep across age and sex. You will see which cancers are driving the trends and what the latest survival patterns suggest for how long the outlook can actually hold.

Fetal Alcohol Syndrome Statistics
Alcohol during pregnancy carries a dose dependent risk and no level is safe, including low amounts that can raise FASD risk by 2 to 3 times. Read to see how timing and patterns such as third trimester binge drinking can sharply escalate harm and why better awareness, screening, and early diagnosis matter for prevention and support.

Peanut Allergy Statistics
Peanut allergy is common enough to shape millions of families, with US prevalence among children around 2.5% and emergency visits costing about $1 billion each year, including roughly a quarter tied to peanut reactions. This page breaks down the real financial and emotional toll, from $25 billion in lifetime costs to the rising need for safer schools and affordable treatment.

Down Syndrome Statistics
From heart disease and sleep apnea rates around 32% and 20% to hearing loss in about half of children and thyroid disease in 40% of adults, this page puts the most common health and development challenges for Down syndrome side by side with clear estimates. It also tracks how risk shifts across the lifespan, from age 35 to about 1 in 350 and age 40 to about 1 in 100, and follows what that means for care needs and outcomes.

Childhood Cancer Research Funding Statistics
Childhood Cancer Research Funding tracks how much support is reaching the most urgent parts of pediatric care, with 2026 figures that show whether momentum is building or stalling. You will see the gap between money earmarked for research and the outcomes families are still waiting on, and why that difference matters right now.

Gallbladder Cancer Survival Statistics
Survival for gallbladder cancer can swing from about 10.2% overall 5 year survival in a large US SEER analysis to 60% after resection when lymph nodes are negative, yet it drops to around 30% with N1 to N2 spread. Newer trial results add another sharp contrast, with durvalumab plus gemcitabine and cisplatin lowering the risk of death versus placebo and extending median overall survival in advanced biliary tract cancers.
Chronic Pain Statistics
Chronic pain touches 20.9% of US adults, and use of CBT for pain sits at just 19% among those affected, even as work disruption, access barriers, and cost burdens keep piling up. This page puts those gaps side by side with what helps, from interdisciplinary rehabilitation and multidisciplinary programs to mindfulness, telehealth, and acupuncture.

Gender Dysphoria Statistics
Gender dysphoria is not just a personal experience reflected in clinical samples. It is tied to stark mental health pressure alongside high rates of improvement after evidence based supports, while access remains uneven as insurance variability reaches 62% of clinicians and coverage denials or restrictions affect 38% of insurers.
Global Cancer Statistics
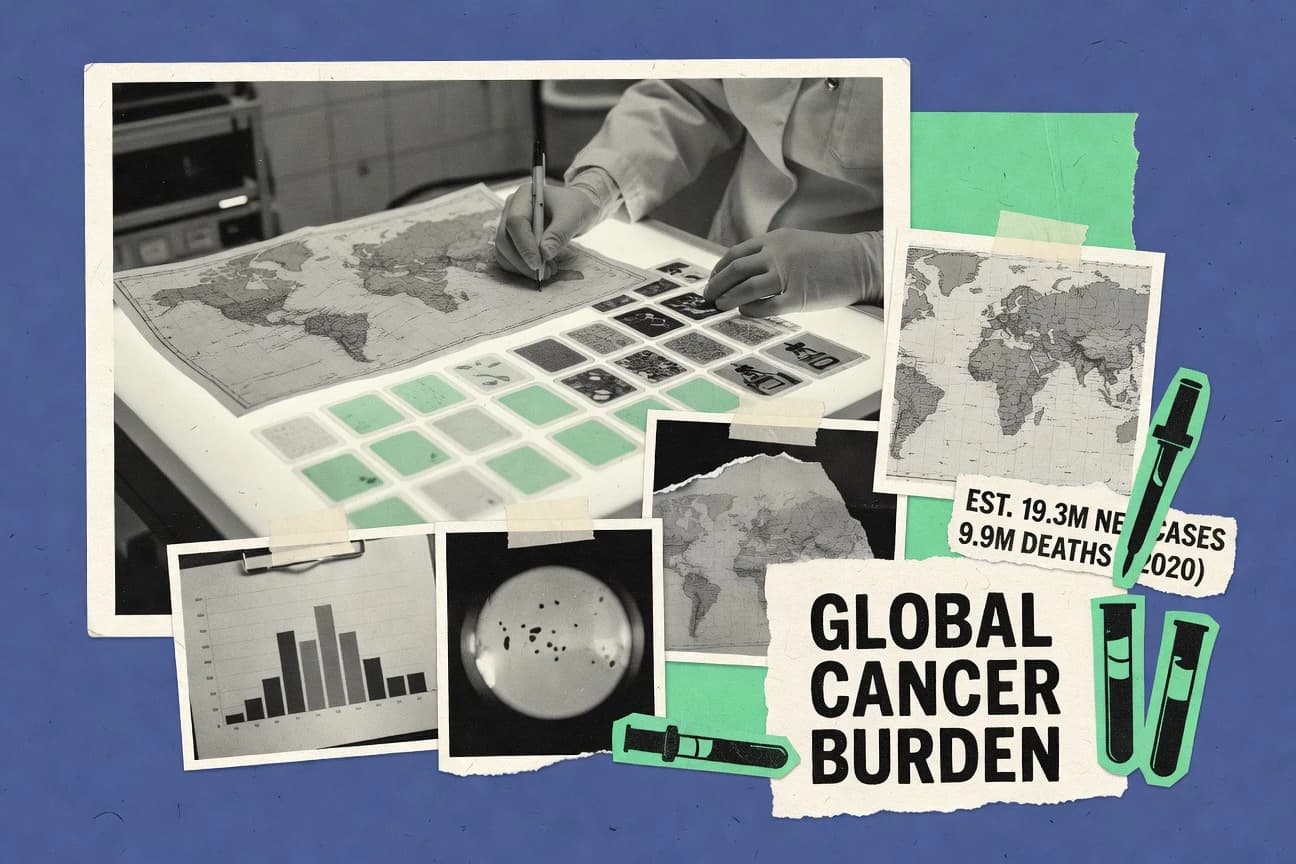
Cancer still claims 1.3% of the global population in 2020, yet survival chances and access to care swing sharply by place, from 50% one year survival in low-income settings to 70% in high-income countries, and radiotherapy is needed by 5.1 million people in low- and middle-income countries but only 1.3 million can receive it. This Global Cancer page connects why preventable risks like alcohol and diet sit beside late-stage diagnoses and screening gaps, with the latest signals on vaccines, policy, and the market forces shaping treatment and technology.

Hepatitis B Statistics
HBsAg prevalence is still strikingly high with 10.0% of Chinese adults aged 30 and older positive in 2018 and 6.0% of US adults aged 20 and older positive in 2015 to 2018, even as chronic hepatitis B silently drives cirrhosis and liver cancer. Learn what it takes to change outcomes, from birth-dose vaccine coverage and treatment gaps to how tenofovir and entecavir achieve sustained viral suppression and how earlier screening and treatment could avert millions of deaths by 2030.

Back Injury Statistics
Low back pain drives global disability, and in the US it is also a workplace and healthcare pressure point where imaging and opioids are still common even as recovery is often rapid. This page pulls together the most current burden and care patterns, including 5.6 million opioid prescriptions for back pain in 2019, 38% of adults using over the counter medication for low back pain in the past month, and how guideline concordant care can cut unnecessary imaging and spending.

Brain Cancer Statistics
Brain cancer outcomes hinge on details that change the timeline fast, from just 7.0% 10-year relative survival to a median survival jumping to 14.6 months with temozolomide plus radiotherapy instead of 12.1 months with radiotherapy alone. You will also see how treatment resistance and access realities shape results, including 4.2 months versus 1.5 months PFS in certain recurrent glioblastoma analyses and the 2024 snapshot of 540 active brain tumor trials alongside care bottlenecks like 42% of UK radiotherapy referrals scheduled more than 4 weeks after the decision.

Vulvar Cancer Statistics
Vulvar cancer counts are changing fast, with 2026 estimates pointing to a rising number of new cases and deaths that many people still do not associate with this disease. Read the statistics to see where the risk concentrates by age and region and how survival patterns vary, so you can separate what sounds familiar from what is actually happening now.

Heart Attack Statistics
Find out what’s driving heart attack risk and outcomes, from coronary heart disease deaths that largely happen outside the hospital to the treatment timing and therapies that can change survival and recurrence, including smoking cessation cutting recurrent MI by 36% and high intensity statins lowering recurrent events by about 15%. You will also see how “numbers you can act on,” like getting the first ECG within 10 minutes and choosing PCI within 120 minutes when possible, directly compete with the delays that keep many patients waiting 3 to 4 hours.

Cleft Lip Statistics
Cleft lip and cleft palate affect thousands of babies each year, and recent data shows the need for earlier diagnosis and coordinated care is only growing. You will see where prevalence is highest and what that means for families planning treatment and support.

Selective Mutism Statistics
With 1 in 140 children estimated to experience selective mutism in the United States, the page also shows why it is so easy to miss, including an average 2.5x longer time to diagnosis than other anxiety disorders and 50% of parents reporting delays of more than 1 year. You will find practical accuracy and treatment signals too, from clinician and school screening performance to the effect size and real-world implementation gaps that shape whether behavioral exposure plans actually reach home and classroom.