Market data
Manufacturing & Engineering
Explore manufacturing & engineering statistics and market research reports with sourced data and trend analysis.
Latest update:
 Ryan Townsend


Statistics · 2026
Sealing Industry Statistics
With the global sealing devices market forecast growing beyond US$6.1 billion in 2023 and a 2024 to 2026 demand estimate of 3.3% for sealing and gasket products in industrial equipment, the page ties market momentum to the performance pressure points that keep plants running. It also connects leak and friction losses to policy and compliance realities like EU F Gas and REACH, spotlighting why better sealing reliability can cut downtime costs, reduce emissions, and protect supply chains where even a small failure can turn into an expensive cascade.

Statistics · 2026
Digital Printing Industry Statistics
Digital printing is projected to keep scaling fast with the global market forecast to hit $68.6 billion by 2032, while North America, Europe, and Asia Pacific all add billions more headroom. This page connects demand drivers like e-commerce and personalization to production realities such as make ready time cuts of 50% to 90% and the supply side from inkjet shipments to toner cartridges, so you can see where growth is accelerating and why.

Statistics · 2026
Quality Control Statistics
From cutting aerospace delaminations to pinpointing ECUs faults at 99.8%, this Quality Control statistics page maps the shift to modern inspection where automation and NDT push defect detection beyond what traditional checks can reliably catch. You will also see how ISO and digital QC practices translate into measurable outcomes like 70% of industries adopting digital QC transformation by 2025 and supply chain QC delays costing $5B annually, making the case for upgrading quality systems before problems surface.

Statistics · 2026
Fastener Industry Statistics
Global fastener demand is on track to rise from USD 92.48 billion in 2023 to USD 123.45 billion by 2030 at a 4.2% CAGR, but the real pressure point sits inside the mix where automotive alone takes 30% while marine corrosion resistant use is just 3%. This Fastener Industry statistics page connects end use shares, production scale and the newest material and smart fastener shifts like IoT enabled smart fasteners reaching USD 2.5 billion by 2030.

Statistics · 2026
Market Pulp Statistics
Global market pulp trade topped $50 billion in 2023, while capacity and demand signals have started to diverge, with Asia Pacific consumption hitting 120 million tons in 2022 against China’s 2023 capacity surge to 110 million tons. Track where the price pressure landed too, from NBSK averaging $850 per metric ton in Q4 2023 to dissolving pulp at $1,200 per ton, and see which regions are gaining the most leverage.

Statistics · 2026
Tire Industry Statistics
Online research and social review habits are reshaping every purchase decision, with 78% of tire buyers researching online in 2023 and 60% checking tire reviews on social media. The page connects that modern behavior to what buyers actually value and why, including EV owners being 2 times more likely to choose premium tires, while low rolling resistance tires are selected by 55% for fuel savings and sustainable materials can cut tire CO2 by 10 to 20%.

Statistics · 2026
AI In Manufacturing
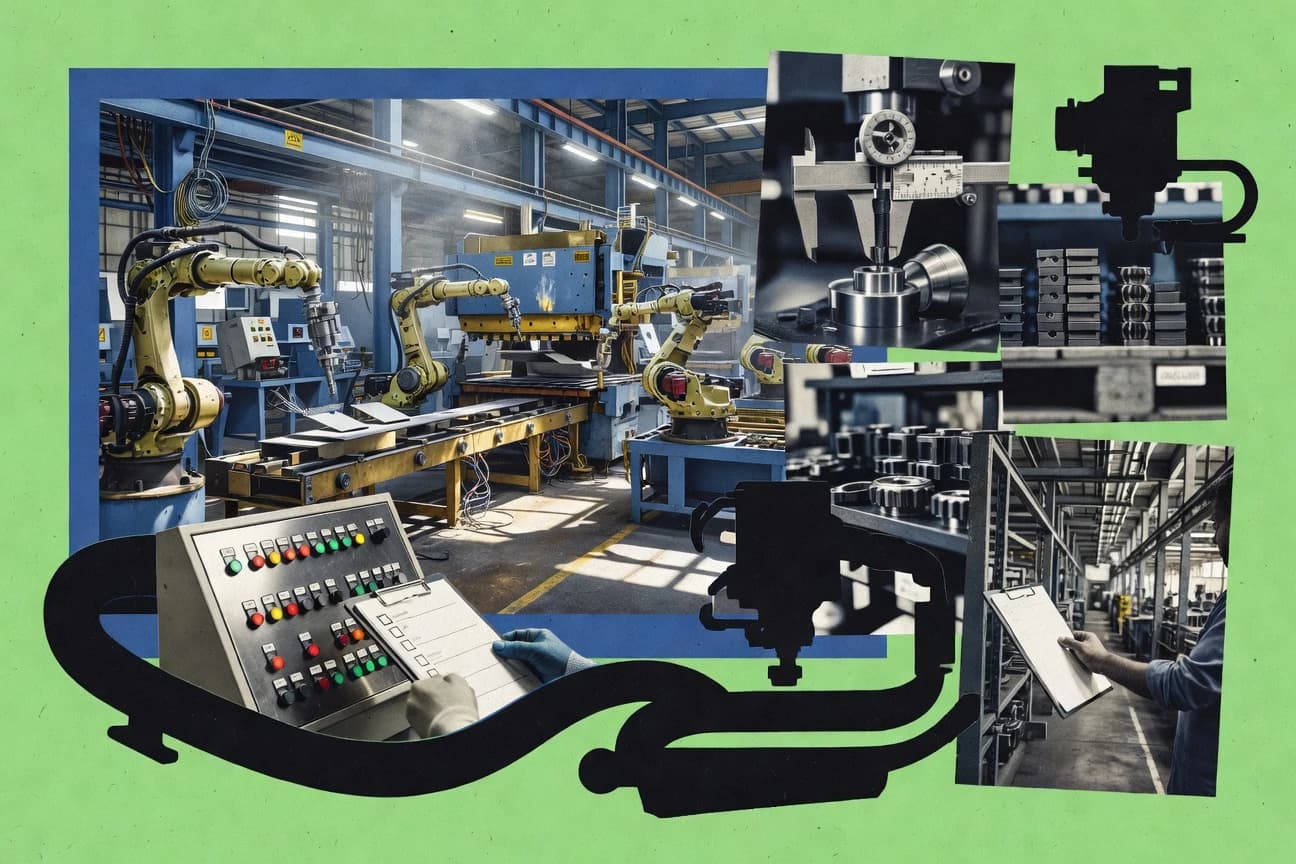
Only 12% of manufacturers have fully deployed AI at scale, yet many are already seeing measurable payoffs like 3.5x ROI in 18 months and 8 to 12% maintenance cost savings. This page maps where adoption is accelerating in 2025 minded priorities, including predictive maintenance, quality inspection, and supply chain visibility trends, plus the barriers holding back the jump from pilots to production.
Statistics · 2026
India Manufacturing
Capacity utilization in Indian manufacturing averaged 76.8% in Q4 FY24, even as the sector kept stretching its output and jobs, with manufacturing employment intensity sliding to 0.12 jobs per INR 1 lakh GVA and manufacturing PMI sitting at 56.8 in 2023. Steel and refineries run far hotter than the overall average, while quality and productivity gains, logistics score improvements, and shrinking defect rates help explain how manufacturing competitiveness can rise even when efficiency, labour mix, and capacity use are under real tension.

Statistics · 2026
Automation Statistics
Automation momentum is accelerating, with 80% of business leaders speeding up process automation and 97% of IT leaders saying it is essential for business growth, while 43% plan workforce reductions as technology reshapes roles. See why 90% of employees feel more productive and what it takes to scale, even as 86% of companies struggle to roll automation out across the enterprise.

Statistics · 2026
Printing Industry Statistics
Digital is already reshaping print economics with the global commercial printing market at USD 709.58 billion in 2022 and a 2.9% CAGR to 2030, while 65% of commercial printers adopted digital presses by 2023 and UV LED curing grew 25% in 2022 to 2023. This page connects that shift to demand and sustainability pressures worldwide, from North America’s 40% share to e commerce driving 60% packaging print growth and carbon footprint estimates showing digital printing 30% lower than offset, so you can see where opportunity and disruption are landing next.

Statistics · 2026
Lean Statistics
Lean’s community runs on real momentum at scale, with 1,200 plus mathlib contributors, 2,500+ Discord members, and 50,000+ Lean-related papers published since 2013, while mathlib alone now sits at 1.2 million lines of code. The page also pairs those social signals with hard engineering speed, including Lean 4 mathlib typechecking in about 1.5 hours on a 16 core machine, so you can see how people, proofs, and performance reinforce each other.

Statistics · 2026
Welding Industry Statistics
With 404,800 welders employed in 2023 and projected 2% growth through 2032, the U.S. is still facing a projected 400,000 welder shortage by 2024 as 82% of employers struggle to hire qualified workers. The page pairs labor and wage realities with safety and modernization signals, from $48,290 median pay to automation cutting injury risk by 70% and AI monitored welding appearing in 15% of new factories.

Statistics · 2026
Automation In Manufacturing Statistics
With 67% of manufacturing executives planning to boost automation investment in 2024 and 70% of surveyed manufacturers increasing automation after COVID, the push is clearly accelerating while outcomes like 3 to 5 times faster changeovers and 40% productivity gains sharpen the business case. At the same time, adoption varies sharply by region and capability, from 32% of SMEs in Europe using automation to 55% of Japan’s factories fully automating welding and 62% piloting cobots, plus the workforce trade off, where 85% report upskilling needs and 47% fear job loss, makes this more than a tech trend.

Statistics · 2026
Wood Industry Statistics
Employment and output figures reveal where the wood economy is truly heavy, with global wood industry jobs totaling 4.5 million and the EU supporting 3.7 million in 2022 while China adds another 4 million through wood processing. The page also pairs those workforce snapshots with sustainability signals like 4 billion cubic meters harvested sustainably and 10 billion tonnes of carbon stored in global wood products, so you can see productivity and environmental impact moving together rather than competing.

Statistics · 2026
India Packaging Industry Statistics
From a packaging industry market worth USD 50.5 billion in 2023 on track to USD 107.9 billion by 2029, this snapshot makes clear where demand and value are heading across FMCG, food, pharma, and e-commerce, including FMCG taking 45 percent of output at 12.5 million tonnes. It also tracks how India is reshaping supply and sustainability, with flexible packaging export strength and 65 percent of companies already adopting sustainable materials by 2023, alongside the pressure to stay competitive as plastic and machinery imports shift.

Statistics · 2026
Heat Treatment Industry Statistics
Global heat treatment is forecast to rise from a USD 109.2 billion market in 2023 to USD 145.6 billion by 2030 at a 3.7% CAGR, even as demand for vacuum heat treatment climbs 5.2% YoY to 1.2 million tons processed. The page pairs that macro growth with hard 2023 benchmarks from leading operators and equipment makers, including Bodycote’s £1.05 billion revenue and SECO WAREWICK’s 120 furnace sales, showing where capacity, technology and spend are shifting fastest.

Statistics · 2026
Photomask Industry Statistics
Photomask demand is still being pulled hard by foundries with 65% of total demand and 2023 shipments pushing to 12.5 million units, while the CPU and GPU side shows how quickly the rules change with AI accelerator mask sets costing $5M each for 3nm. Read how new categories like photonics masks doubling to 120k units and power SiC and GaN masks reaching a $320M market coexist with tighter yields, lower scrap, and faster EUV lead times, reshaping who wins in high value mask manufacturing.

Statistics · 2026
Screen Printing Industry Statistics
Screen printing is cutting waste by 20% industry wide while water usage per print drops 30% through recycling, yet 60% of printers report rising ink costs and 70% of small shops feel labor strain. Get the full picture of a greener, more regulated process where 50% less VOC emissions come from low cure inks, but competition from DTG and PFAS bans are reshaping what survives from shop floor to market.

Statistics · 2026
Power Equipment Industry Statistics
With the global power equipment market at USD 145.2 billion in 2023 and forecast to hit USD 220.7 billion by 2030, this page tracks the numbers reshaping the sector, from HVDC and grid modernization to digital maintenance. You will see how major players like ABB at 14.2% global market share and Siemens Energy’s EUR 112 billion end 2023 order backlog sit alongside the fastest growth pockets such as switchgear, while policy and ESG pressures accelerate investment through 2025 and beyond.

Statistics · 2026
Vacuum Industry Statistics
Robotic and cordless breakthroughs are reshaping the vacuum market fast, with global vacuum cleaner CAGR forecast at 6.2% from 2024 to 2032 and robotic vacuums expected to reach 35% share by 2030. This page pairs brand scale and momentum, from Dyson’s 20 new cyclonic models planned by 2030 to iRobot and Amazon’s post 2026 revenue upside, with hard operating metrics like Electrolux 12 million unit sales and SEBO’s 95% customer retention.