Market data
Fashion Apparel
Explore verified fashion apparel statistics and market research reports with sourced data and trend analysis.
Latest update:
 Elif Demirci
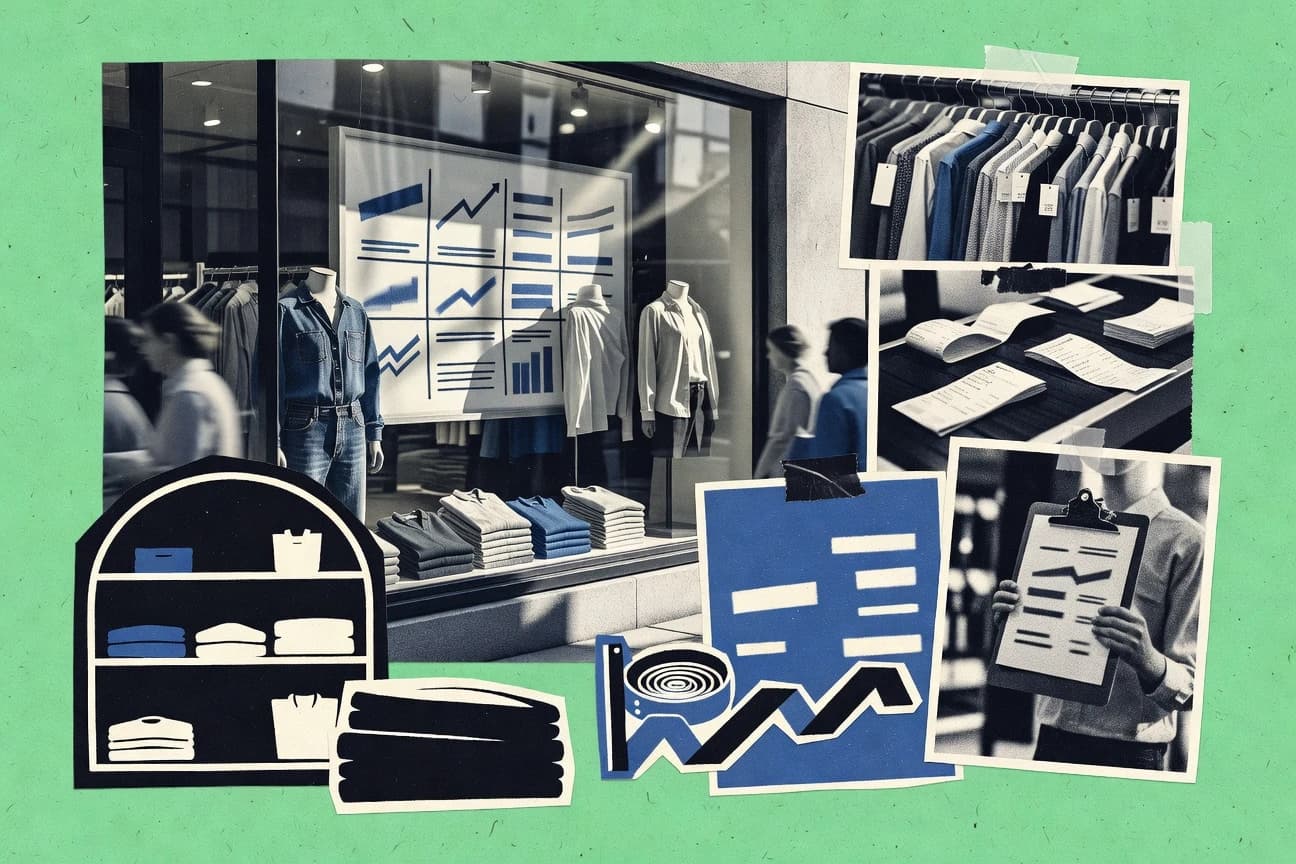
Clothing Retail Industry Statistics
Gen Z favors second-hand over new: 62% in 2023. See the stats on channels, sustainability, and market share driving clothing retail.
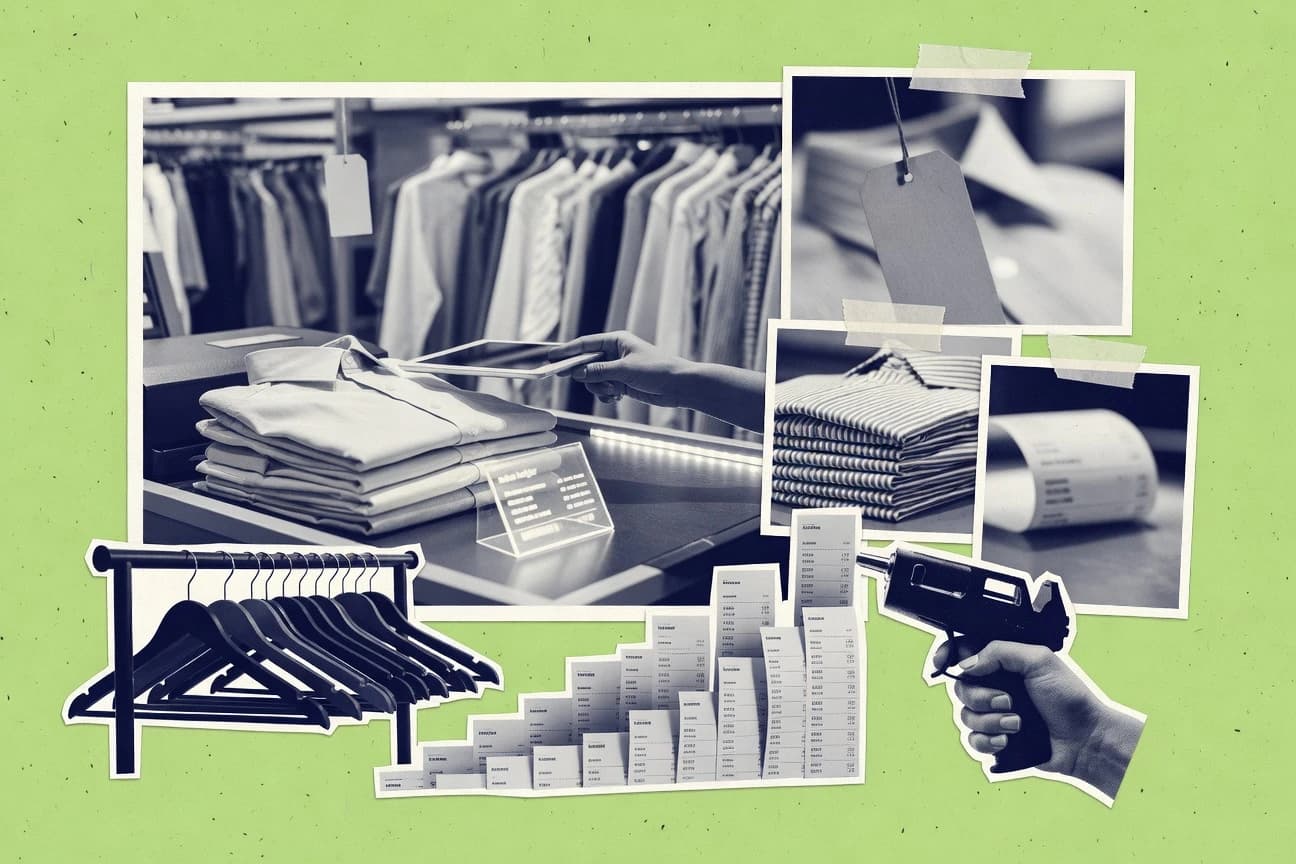
Fashion Retail Industry Statistics
From RFID speedups that can make inventory available 2.5 times faster to 54% of apparel shoppers who rely on online reviews before buying, these stats reveal where fashion retail is winning and where it’s leaking profit. Add 78% of consumers demanding product transparency and a $1.05 trillion global online clothing and footwear forecast by 2027, and you get a sharp case for what brands need to fix right now.
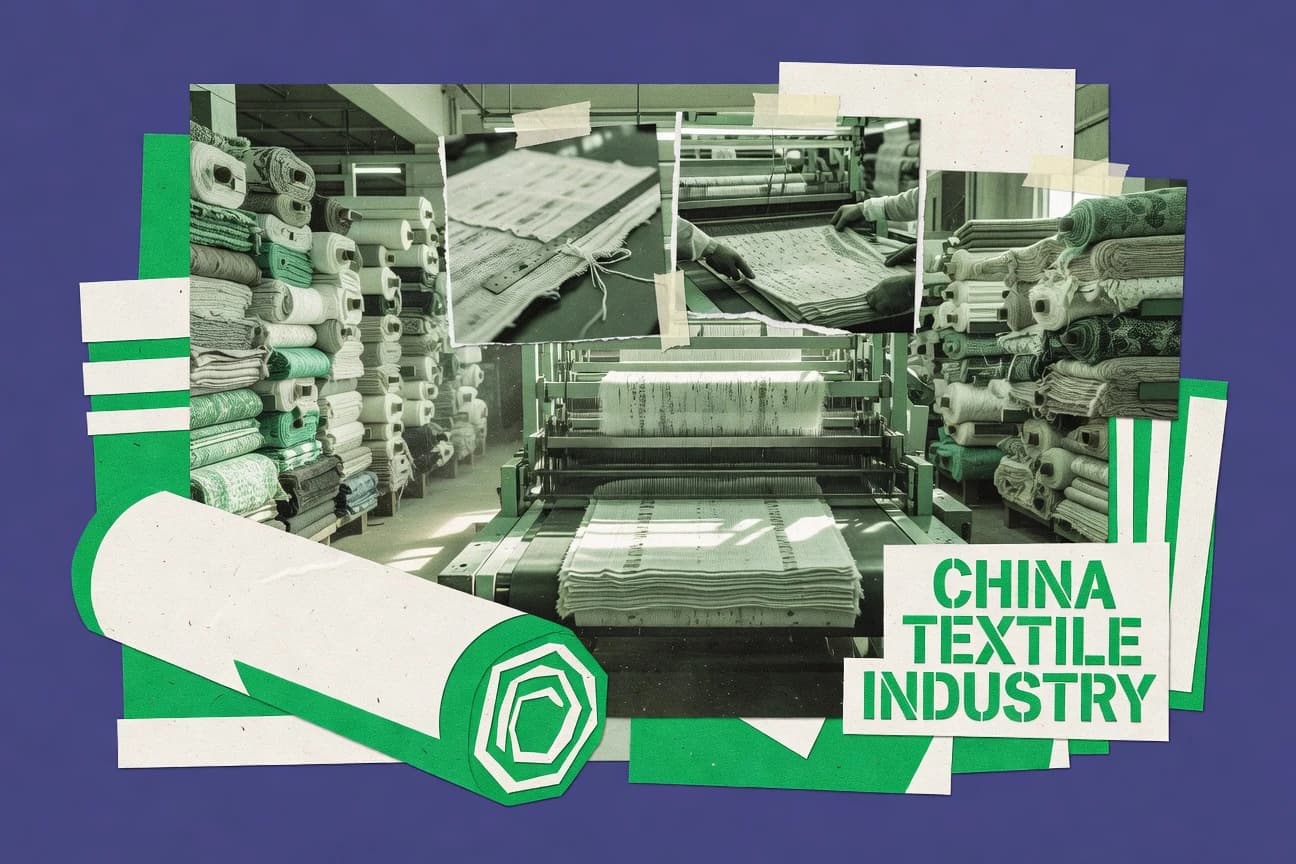
China Textile Industry Statistics
With China driving 42% of global textile production while shipping $35.5 billion in textiles and apparel exports in 2023, this page connects the supply chain from cotton and yarn to trade flows, waste, and chemicals. It also highlights the pressure points behind the progress, from EU and US destination shares to environmental targets like a 20% wastewater pollutant reduction plan and circularity benchmarks that turn industrial and clothing waste into secondary fibers.

Apparel Industry Statistics
U.S. clothing and accessories store sales topped $330B+ in 2023 while EU textile and clothing spending sits near 2.5% of total consumption, a contrast that helps explain why global production, fast fashion growth, and U.S. import demand remain tightly linked. The page connects forecasts like online apparel reaching $350B by 2030 with hard pressure points such as polyester dominated microfiber release and the hard fact that only 1% of used clothing becomes new clothing, alongside labor and compliance rules shaping what can legally be sold.

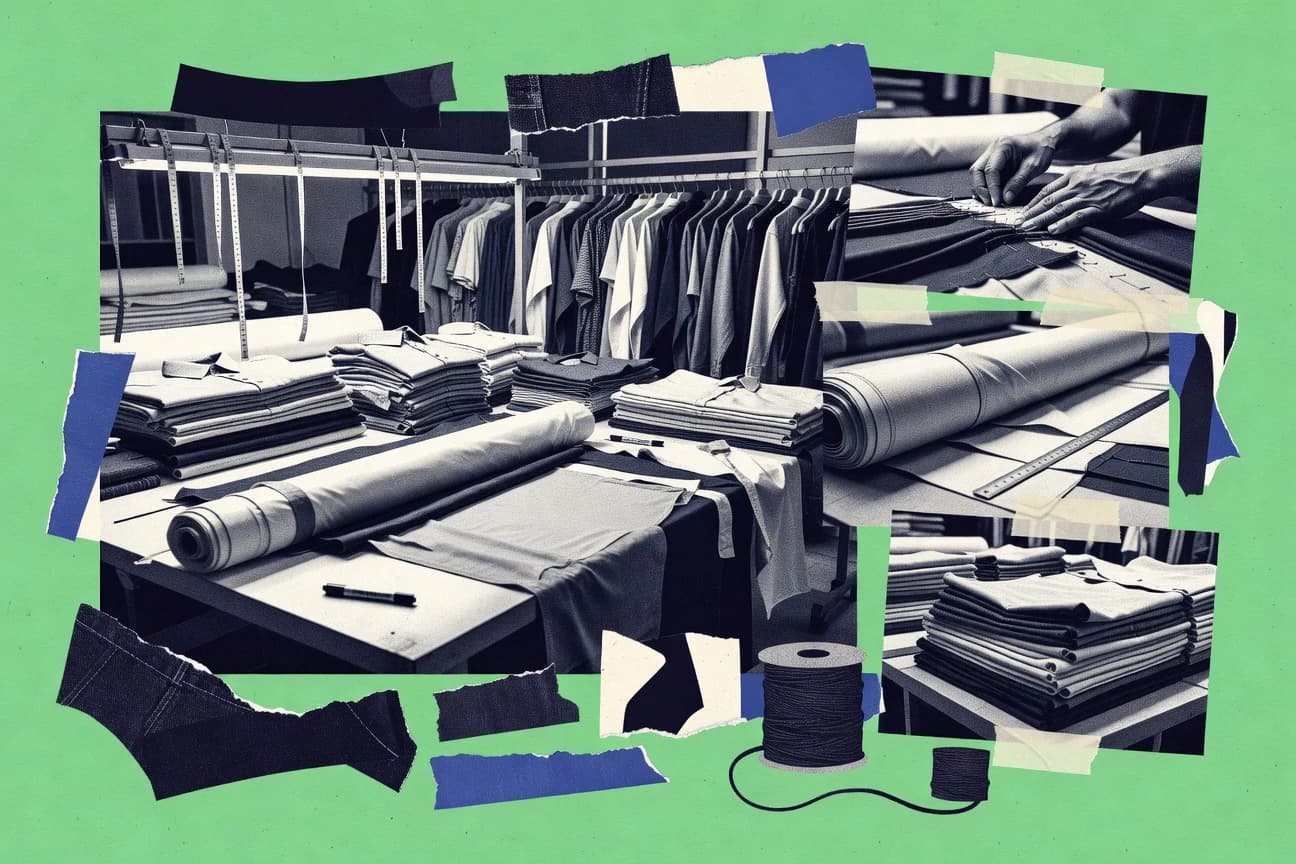
Garment Industry Statistics
With 60% of global apparel production tied to fast fashion by unit volume and EU rules tightening across textiles, retailers are being pushed to prove both compliance and carbon impact starting 2025 and 2026. Track how far the pressure reaches, from recycled fiber usage and carbon pricing to forced labor controls, digital product passports, and AI or RFID tools that can cut defects by 30% and reduce out of stocks by 8 to 12%.

Footwear Industry Statistics
Footwear Industry statistics track how 2026 projections are colliding with current demand patterns, revealing where retailers and brands are gaining leverage and where margins are getting squeezed. Expect clear numbers on sales momentum, pricing pressure, and shifting customer preferences that make last year’s assumptions look outdated.

Sportswear Industry Statistics
See how sportswear demand and pricing move together as the industry pivots into 2025, with China and North America showing notably different growth patterns and margin pressure. If you are trying to forecast inventory, brands, and sourcing decisions, these 2025 specific signals are exactly where the story sharpens.
Bangladesh Textile Industry Statistics
Bangladesh’s textile industry statistics for 2025 reveal a sharper split between expanding demand and the real constraints on production, with key indicators updating the picture of factories, exports, and employment. Read this to understand what’s accelerating now and what is holding growth back, based on the latest numbers.
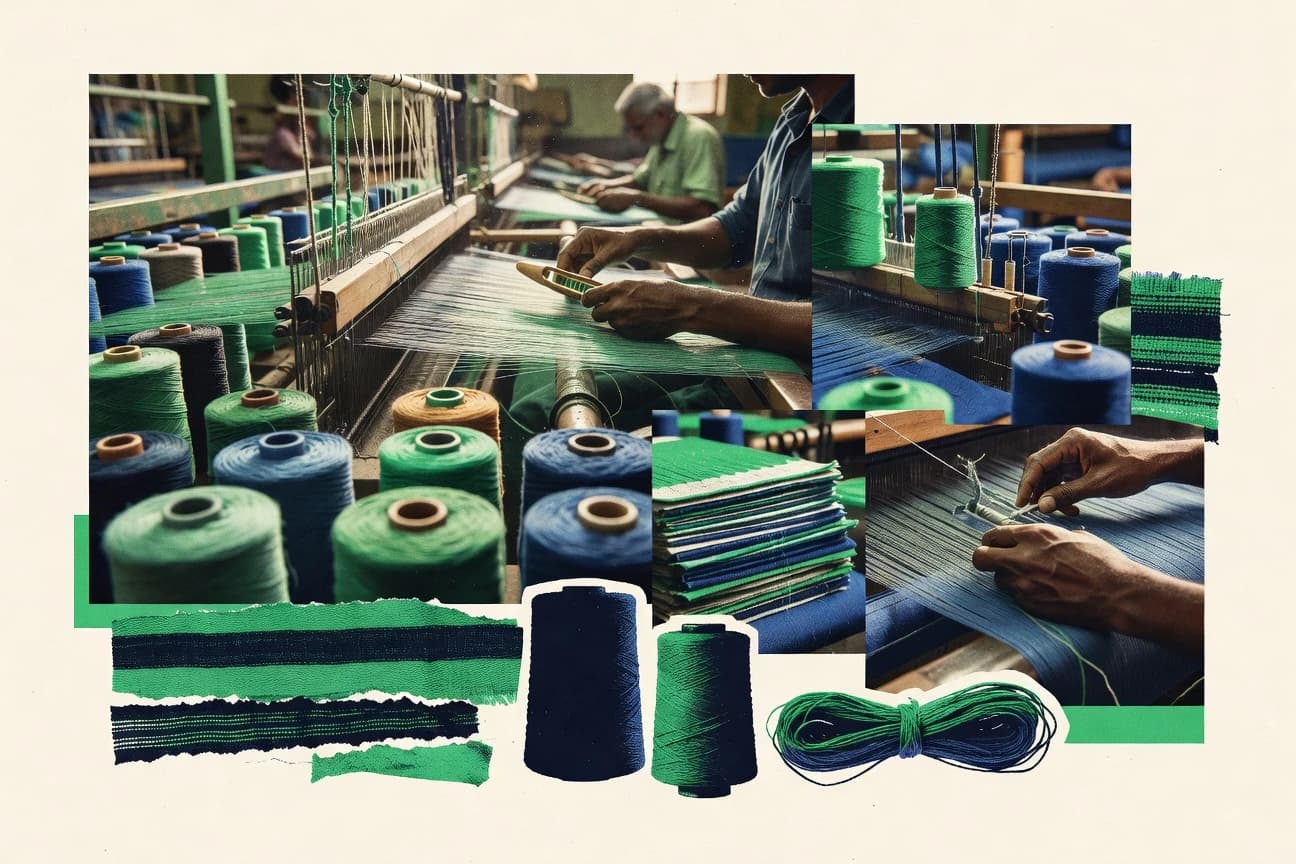
Textiles Industry Statistics
With the global textile market projected to reach USD 1,955.50 billion by 2034 and the Europe textile segment still being shaped by high concentrations of tiny firms, this page connects the scale of demand with the people and pay that make it happen. From 75.7% of US textile apparel employment tied to clothing retailers to median wages like $15.50 an hour for pressers and $40,011 for textile workers, you get a sharp sense of what growth means on the factory floor.

Female Dress Code Statistics
Across research and courtrooms, women’s dress rules still police bodies in sharply gendered ways, with 2025 data showing 78% of female executives in Fortune 500 firms expected to follow business formal standards tied to skirts and dresses. At the same time, historical snapshots and religious codes swing between restrictive silhouettes and enforced coverings, making it clear why Female Dress Code tracks what is demanded, who pays the price, and how “appropriate” keeps changing.
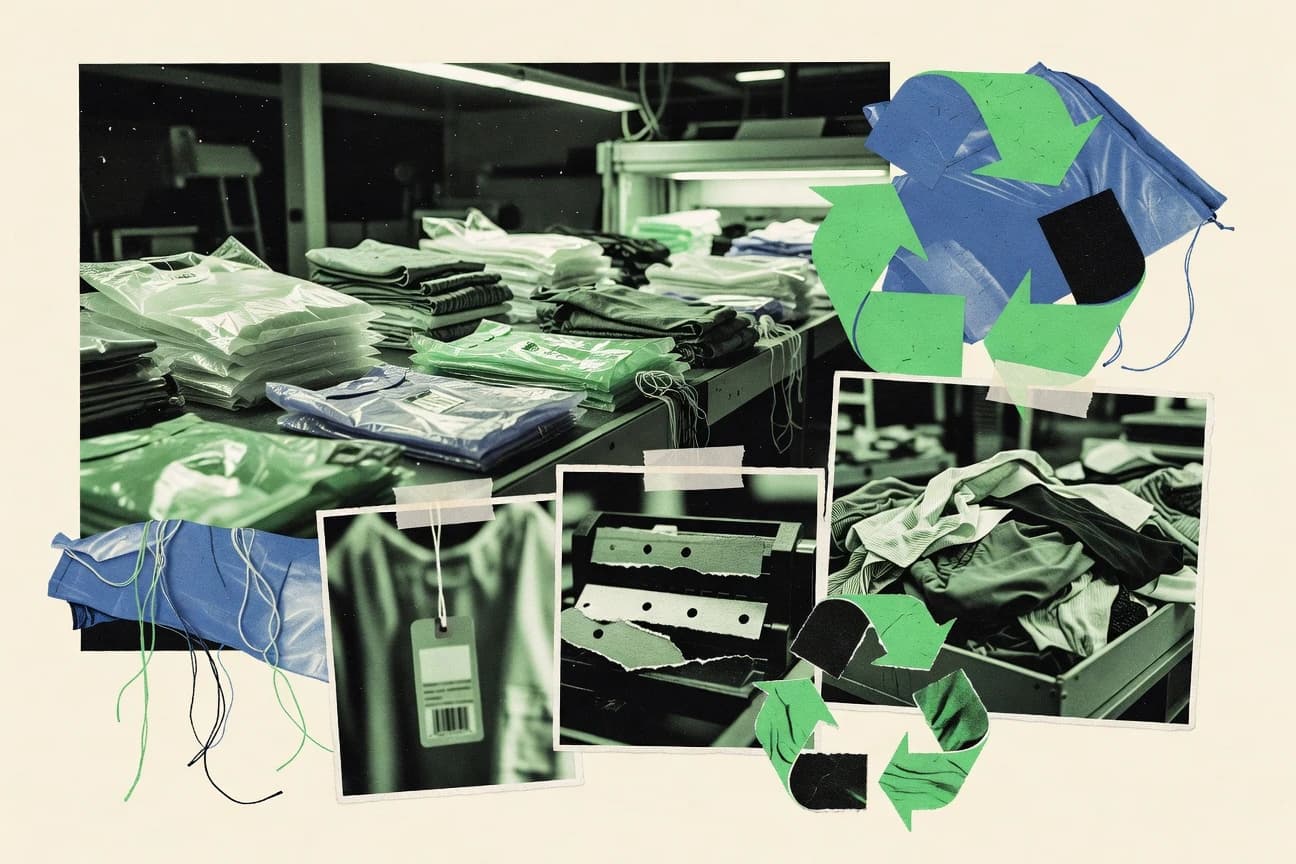
Clothing Industry Statistics
Online apparel sales now make up 30% of total purchases and the average price per item is down 12% since 2015, yet 70% of clothing is never worn after purchase. This page connects the spending shifts with sustainability signals like 57% willing to pay more for sustainable clothing, while also revealing the people and costs behind the seams.
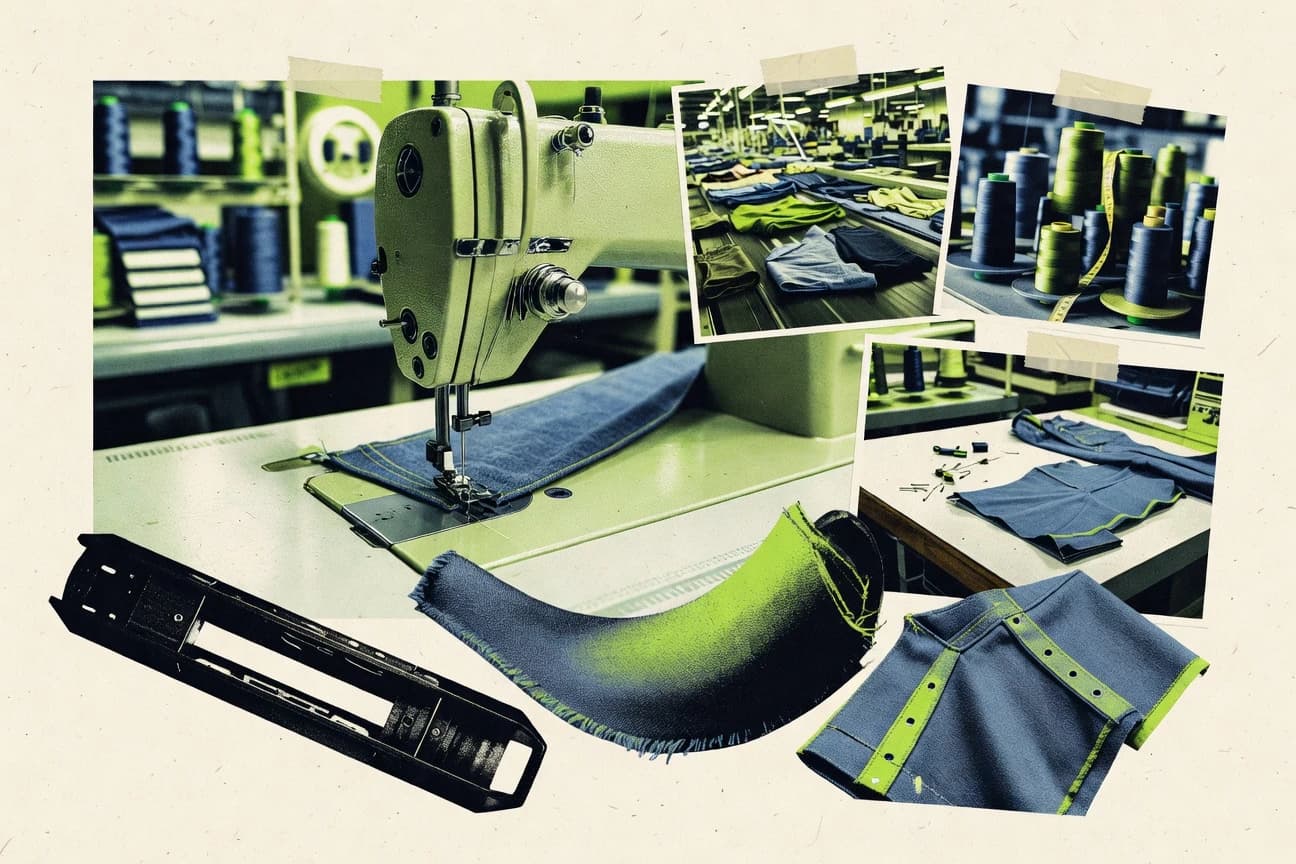
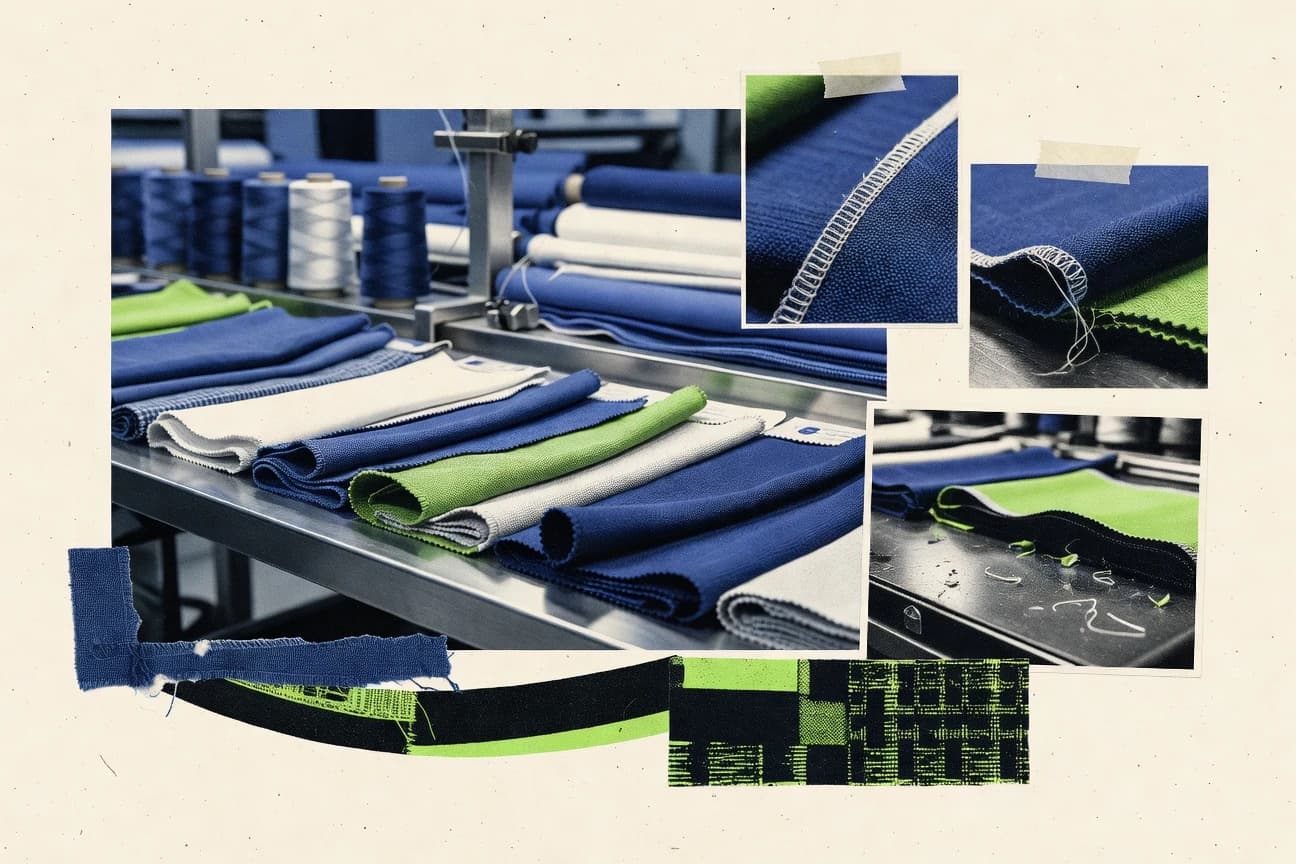
Sewing Industry Statistics
With apparel manufacturing projected to grow at a 2.2% CAGR through 2030 and a global sewing ecosystem stretching from a $6.8 billion embroidery market to $6.8 billion worth of industrial sewing machinery demand, this page pinpoints where throughput, quality, and cost pressures really land. Expect hard contrasts like 20% fewer stockouts from RFID inventory and an 11 kg CO2e average fast fashion footprint alongside wage benchmarks and price headwinds that can squeeze sewing supply chains faster than capacity can catch up.

Athletic Apparel Industry Statistics
Activewear is still accelerating toward a $434.6 billion global market by 2030, but the real tension is how quickly demand, costs, and compliance pressures are reshaping athletic apparel decisions, from 49% of online visits coming from mobile to 33% online penetration of apparel sales and freight costs ticking up 15.3% in 2023. The page ties that shift to sustainability and margins, including Adidas with 49.1% gross margin and 99% recycled polyester, alongside supply chain realities like textiles, CO2e, and water use that explain why “performance” now has a balance sheet and a footprint.
Fast Fashion Industry Statistics
The fast fashion industry is an environmentally destructive and socially exploitative global economic force.

Fashion Industry Statistics
The fashion industry is massive but must urgently address its severe environmental and social impacts.