
Market data
Customer Experience In Industry
Explore verified customer experience in industry statistics and market research reports with sourced data and trend analysis.
Latest update:
 Margot Villeneuve

Customer Experience In The Supplement Industry Statistics
See how customer experience in the supplement industry is shifting, with 2026 statistics revealing where satisfaction is tightening and where trust is slipping. The contrast between repeat purchase behavior and reported support experiences makes it clear why CX has become the real differentiator, not just product quality.

Call Center Statistics
Customer service is still more phone driven than many teams expect, yet online contact is already the majority at 63.5% of global channel usage in 2023 and call centers handle anywhere from 1,000 to 5,000 inbound calls a day. This page connects staffing reality like 30% average agent attrition and 68% of employees working from home with performance levers such as up to a 12 point NPS lift from better resolution and a 75% generative AI adoption forecast by 2025.

Customer Experience In The Building Industry Statistics
One bad experience can tip 76% of consumers away, yet construction teams can lift satisfaction with measurable operational fixes like faster RFI responses and centralized field communication. This page connects CX ROI to what actually drives outcomes, from 47% of customers blaming delays for rising costs to 90% plus SLA attainment that correlates with materially higher satisfaction.

Customer Experience In The Oil Industry Statistics
With the global omnichannel contact center software market projected to hit $38.4 billion by 2029 and conversational AI reaching $9.96 billion by 2024, oil and gas CX teams are being pushed to modernize how customers get help across every channel and turnaround time. The same pressure shows up in sustainability expectations too, where IPCC AR6 estimates tie 3.1% of global value added emissions to energy supply chains, forcing operators to treat transparency and reliability as part of the customer experience, not just operations.

Customer Success Industry Statistics
Customer Success teams are shifting from “measuring outcomes” to “proving impact,” with 2026 figures that show how fast retention, onboarding, and adoption metrics are becoming board level priorities. Read how the industry’s benchmarks are tightening and what that means for teams trying to scale customer value without losing the human touch.

Customer Experience In The SEO Industry Statistics
Customer experience is no longer a soft add on in SEO. With 2026 signals showing faster rising CX expectations and measurable retention impact, the page connects how clients evaluate agencies to the customer journey changes that actually move rankings.

Customer Experience In The Msp Industry Statistics
Customer experience is becoming the MSP battleground, and the 2026 numbers make that shift hard to ignore. See which CX metrics are moving most customers to keep, switch, or churn and what that means for pricing, support, and retention decisions.

Customer Experience In The Food Industry Statistics
Customer experience is becoming the real differentiator in food, with 88% of companies saying it matters and only 36% delivering an exceptional experience. The page connects the dots between fast fixes, accurate updates, and personalization to retention and revenue, from 86% of consumers staying with great service to 63% sharing positive experiences when issues are resolved quickly.

Customer Experience In The Fishing Industry Statistics
When anglers, buyers, and charter customers feel treated well, loyalty follows fast. A striking 86% will pay more for a better experience and 96% will switch if another provider delivers, even though 72% of customers say they have trouble with customer service in the last year.

Customer Experience In The Ict Industry Statistics
With the CXM market forecast to grow at a 13.2% CAGR through 2027 to $14.4B, this page sets up a sharp tension between tech investment and customer loss, where 15% churn after one bad experience and 54% leave after a single poor support interaction. It also pinpoints where ICT teams can win fast, from chatbot self service cutting support costs by up to 30% to Ofcom and FCC quality and reliability measures that directly shape what customers feel in the moment.
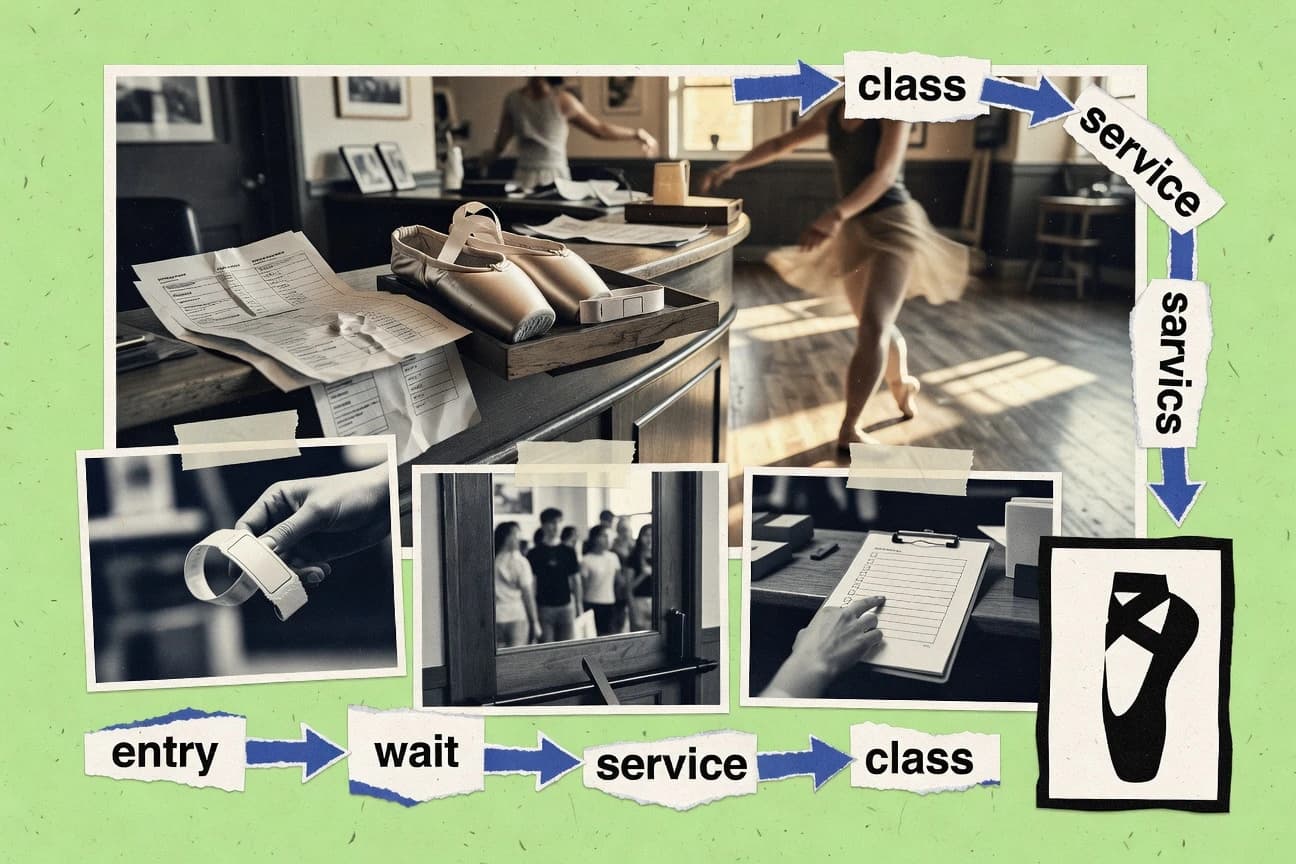
Customer Experience In The Dance Industry Statistics
After the pandemic reshaped expectations, customer experience in dance is now measured with new urgency, from how quickly studios and ticketing teams respond to how often dancers feel heard. See which 2026 signals point to real retention gains, and where the data still shows a painful gap between what dancers want and what venues deliver.
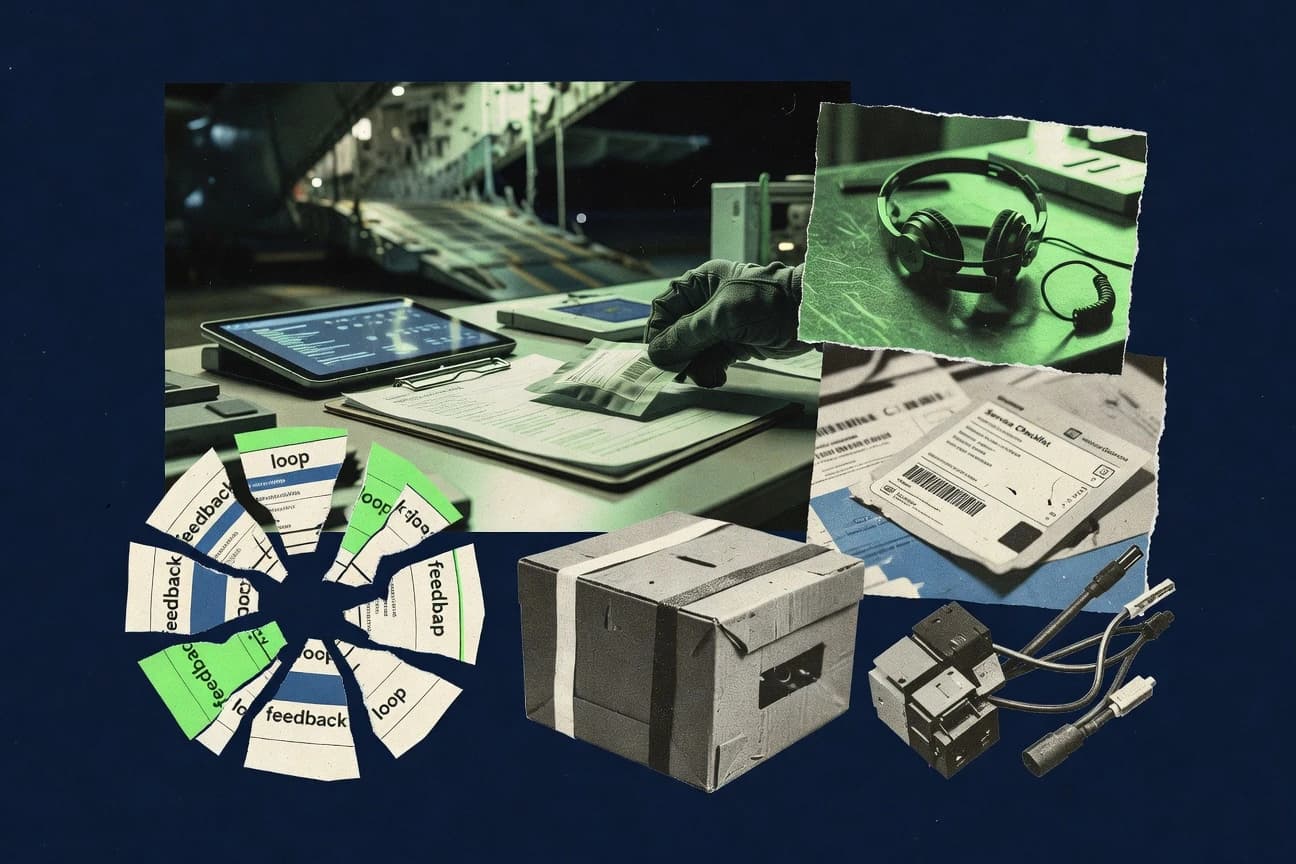
Customer Experience In The Arms Industry Statistics
See how customer experience in the arms industry is changing hands, with 2026 figures revealing where service expectations are rising faster than delivery confidence. Compare those shifts in responsiveness and satisfaction with what buyers actually report, and you will spot the gap that suppliers cannot afford to ignore.

Customer Experience In The Ria Industry Statistics
Find out how customer experience in the ria industry is shifting in 2025, with measurable changes in satisfaction and service delivery that reveal what customers are noticing right now. The tension is clear in the results, where improvements in some moments don’t always translate into the same level of trust across the full journey.

Customer Experience In The Material Handling Industry Statistics
In 2025, material handling brands report a sharp uptick in customer satisfaction when service teams close the loop quickly, yet first response and issue resolution still vary widely by region and channel. This page pinpoints the CX metrics that most strongly separate top performers from the rest and shows where the next gains are likely to come from.
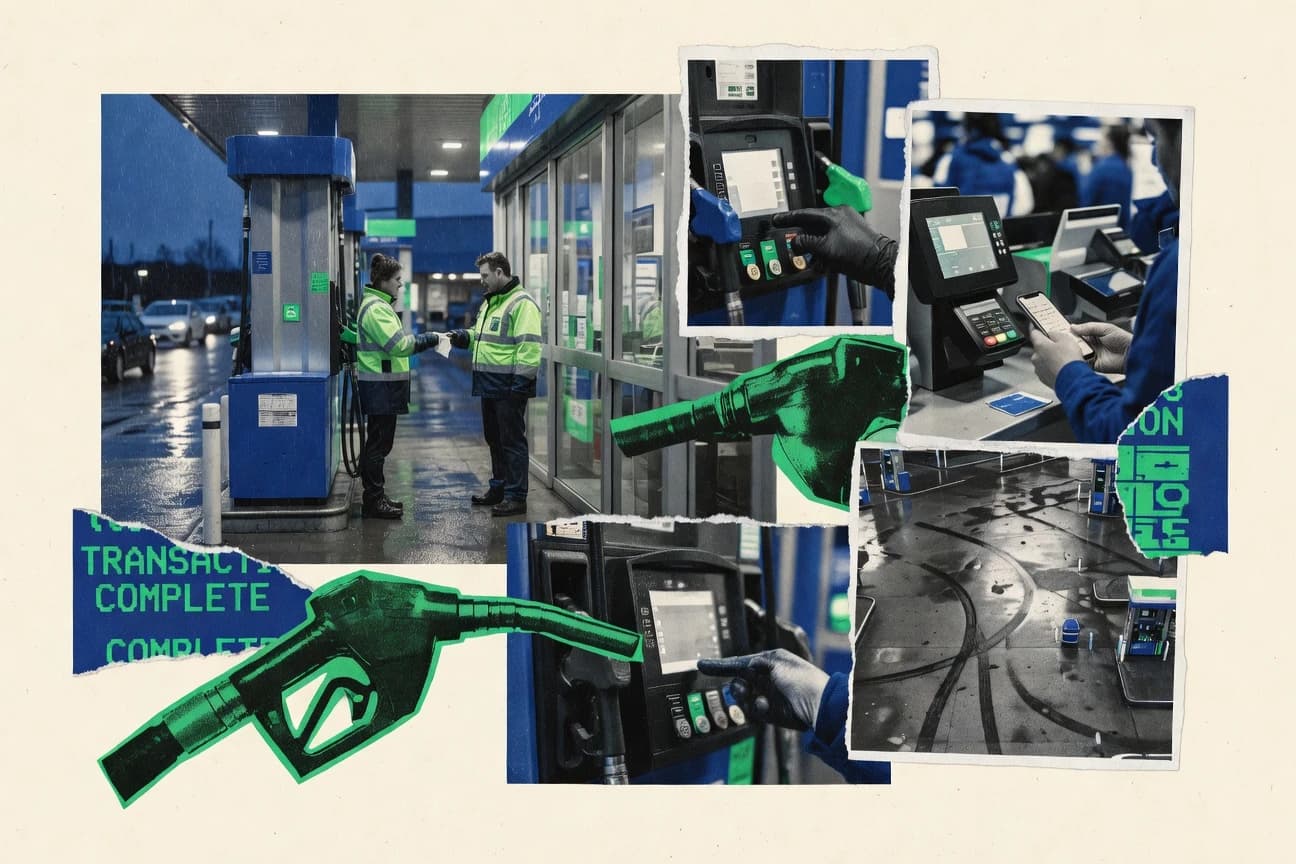
Customer Experience In The Petroleum Industry Statistics
Customer Experience In The Petroleum Industry turns up a sharp contrast between what operators promise and what customers feel, using the latest results from 2025. The page highlights where journeys are improving and where friction is still costly, so you can see exactly which CX gaps deserve attention first.

Customer Experience In The Security Industry Statistics
Customer experience spending is forecast to hit $563B by 2027, and leaders in it can earn 2.6x higher revenue while being 5.1x more likely to turn profitable, but security firms still face hard reality like 51% of customers switching providers due to wait times. This page connects CX expectations like resolving issues within 5 hours and responding to chat in 5 minutes to real security outcomes, from managed security growth to the true cost of slow breach detection and customer churn.
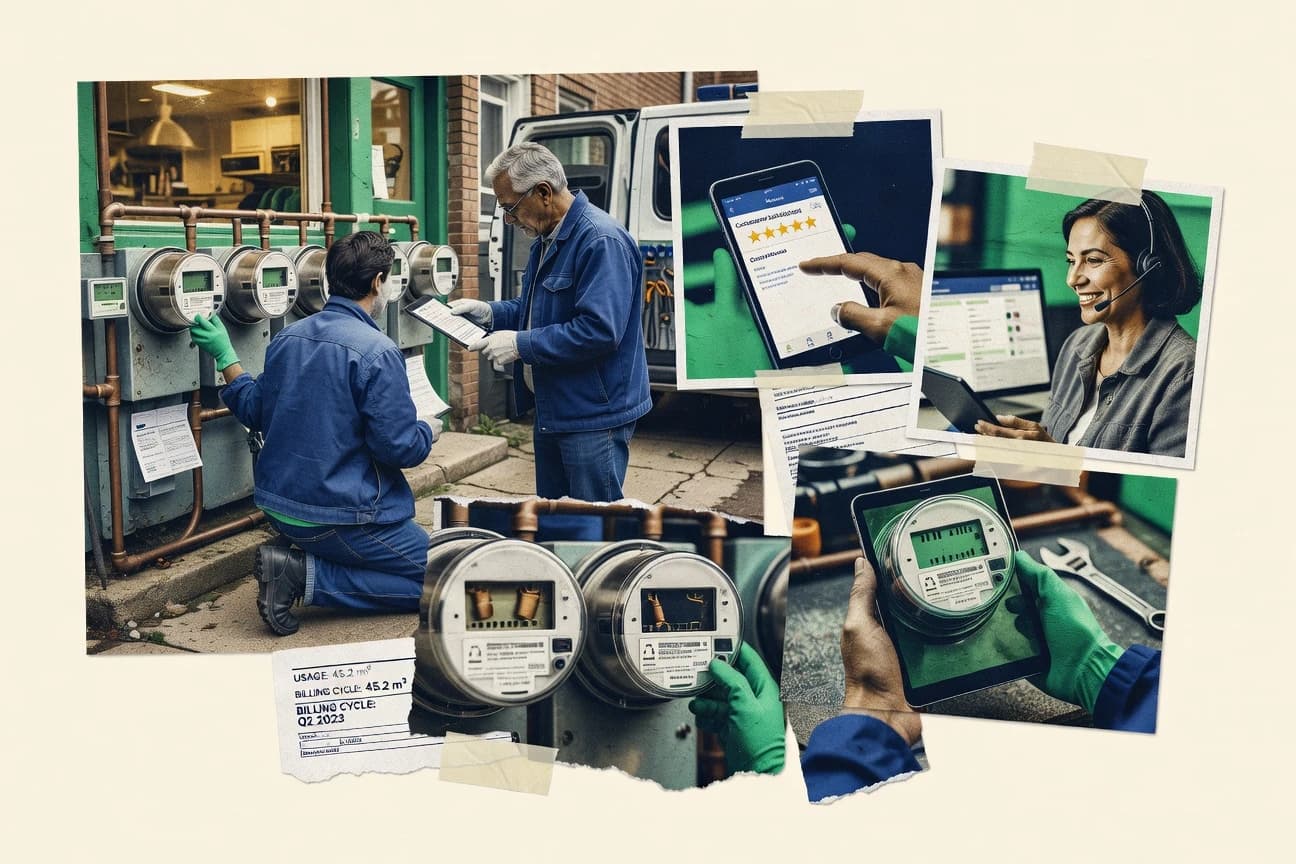
Customer Experience In The Gas Industry Statistics
Customer Experience In The Gas Industry takes the pulse of service performance with a 2025 view that shows where reliability efforts are actually landing, and where customers still feel the gap. The page pulls together the clearest CX signals to help you spot the moments that drive churn and loyalty before the next cycle of change.

Customer Experience In The Electrical Industry Statistics
With utilities projected to spend $1.1 billion on customer service technology by 2026, the page connects that investment to what customers actually feel, from speed and outage messaging to effort and first contact resolution. You will see why 12% of organizations still lack CX metrics and how better outage communications can cut escalations by 5% for every 10% improvement, tying day to day service decisions to measurable loyalty and revenue growth.

AI Customer Service Statistics
AI-enhanced service is already paying off, with voice AI delivering 91% satisfaction compared with 86% for IVR and proactive AI notifications reducing churn by 15% while saving up to 30% in customer service costs each year. The page also calls out the friction points that keep results from being automatic, like data quality delays and skills gaps, so you can see what it takes to get the gains in 2025 and beyond.

AI Customer Service Agent Statistics
See why AI customer service agent deployments are cutting costs and headaches at a scale that is hard to match. AI CS drops cost per interaction by 66% and lowers operational costs by 30% while delivering 30% ROI within the first year, all alongside 91% of customers rating AI to human handoffs positively.