Market data
Chemicals Industrial Materials
Explore chemicals industrial materials statistics and market research reports with sourced data and trend analysis.
Latest update:
 Lukas Bauer


Statistics · 2026
Germany Chemical Industry Statistics
In 2022, German chemicals posted a 6.2% production decline versus 2021—see the R&D, jobs and trade picture behind the numbers.
Statistics · 2026
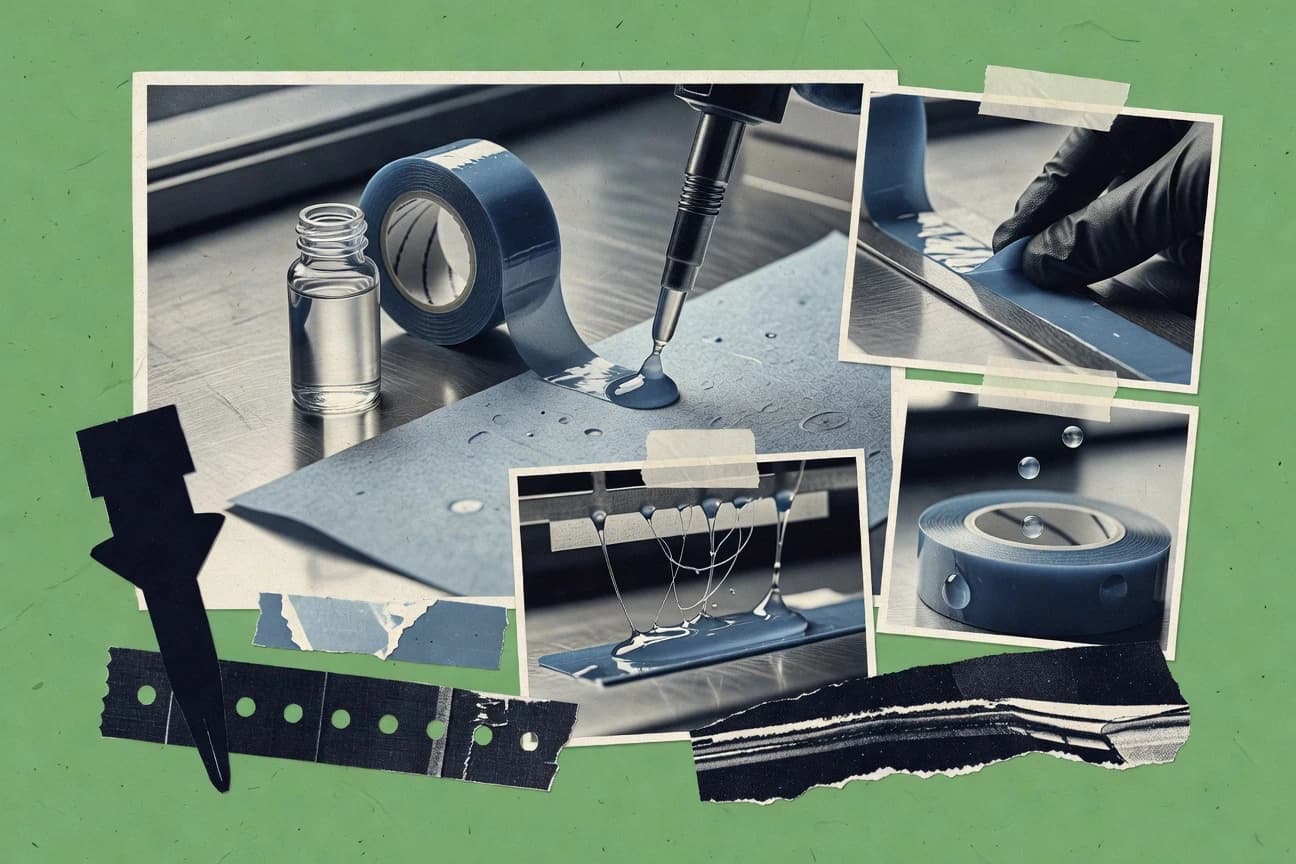
Adhesive Industry Statistics
Packaging accounted for 32% of adhesives by volume in 2022 (5.6 million tons). See the market numbers shaping hot-melt demand.
Statistics · 2026
Specialty Chemicals Industry Statistics
Asia-Pacific held a 42% share of the specialty chemicals market in 2023—see how this regional concentration drives demand and capacity planning.
Statistics · 2026
India Plastics Industry Statistics
India’s packaging plastics demand hit 8.5 million tonnes in FY23, up 10% YoY—discover what’s driving the jump and where it goes.

Statistics · 2026
Metal Statistics
Global iron ore production hit 2.6 billion metric tons in 2022—see how iron, copper, aluminum, and gold differ in corrosion, chemistry, and reserves.
Statistics · 2026
Polyurethane Industry Statistics
Europe produced at massive scale—5.2M tons/year capacity in 2023—while recycling hits 28% in 2022. Explore the forces shaping PU demand.

Statistics · 2026
Flavors And Fragrances Industry Statistics
Synthetic flavors make up 60% of the global flavors category—discover how that share is shifting alongside faster-growing natural flavors.
Statistics · 2026
Resins Industry Statistics
Epoxy resins reached $9.21B in 2022—see how electronics and wind power drive growth to $13.46B by 2030.
Statistics · 2026
Global Chemicals Industry Statistics
Specialty chemicals make up 28% of global chemical sales in 2022 (about $1.4T)—discover what this growth means for investors and suppliers.

Statistics · 2026
Acrylic Sheet Industry Statistics
Signage takes 35% of global acrylic sheet production—so what fuels this demand, and where do those sheets end up?
Statistics · 2026
Enzyme Industry Statistics
Only 15% of industrial enzymes were used in biofuel production in 2024—explore how cellulases power cellulosic ethanol.

Statistics · 2026
Flavor Fragrance Industry Statistics
Plant-based flavors surged 12% in 2023—discover how this momentum shapes growth to 2030.
Statistics · 2026
Dry Ice Industry Statistics
In medical shipping, dry ice moved 2.5 billion vaccine doses in 2022—discover what it takes to keep them cold and compliant.

Statistics · 2026
South Korea Petrochemical Industry Statistics
CO2 emissions hit 45 million tons in 2022—how South Korea’s petrochem sector is cutting carbon while scaling output. Explore the numbers.

Statistics · 2026
Epoxy Resin Industry Statistics
Global epoxy resin consumption hit 3.1 million tons in 2023—see which applications consume the most and what that means for 2028 market growth.
Statistics · 2026
Chemicals Industry Statistics
Global chemical waste is 95% recycled or recovered (2023). See how circularity cuts impact—and what drives it across today’s industry.
Statistics · 2026
Paint Coatings Industry Statistics
Statistics · 2026
Nonwovens Industry Statistics

Statistics · 2026
Silicone Rubber Industry Statistics
China produced 1.05 million tons of silicone rubber in 2022—50% of the global total—and the market is forecast to hit $17.82B by 2030.

Statistics · 2026
Polycarbonate Industry Statistics
China produced 5.7 million metric tons of polycarbonate resin in 2023—fueling a market projected to reach $10.7B by 2030.