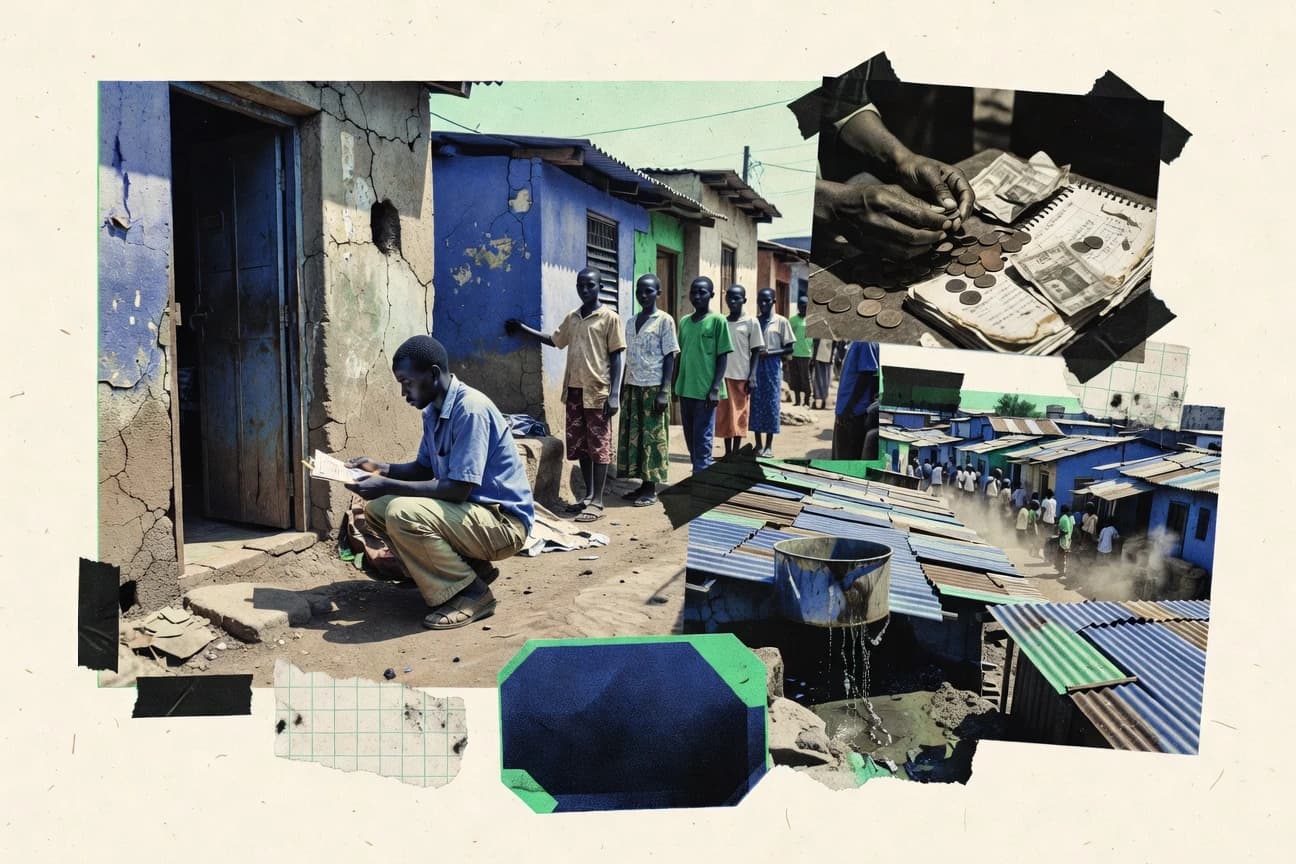

712 million people live in extreme poverty worldwide. Sub-Saharan Africa accounts for 40 percent of that total. The statistics also show how poverty concentrates among children, rural residents, and women compared with other groups.
Key Takeaways
- Global Multidimensional Poverty Index (MPI) shows 1.1 billion in acute multidimensional poverty in 2019-2021
- 333 million children under 5 in extreme poverty globally in 2022
- In 2022, approximately 712 million people worldwide lived in extreme poverty, defined as less than $2.15 per day in 2017 PPP terms
- Sub-Saharan Africa has 40% of global extreme poor, 429 million people
- Extreme poverty declined from 36% in 1990 to 10% in 2015
Nearly 700 million people still live in extreme poverty worldwide, highlighting the urgent need for action.
Related reading
01 · Category
Dimensions28 stats
01
Global Multidimensional Poverty Index (MPI) shows 1.1 billion in acute multidimensional poverty in 2019-2021
02
25 countries have 1/3 of multidimensionally poor population
03
MPI intensity averages 44.5% across poor households globally
04
584 million multidimensionally poor live in Sub-Saharan Africa
05
390 million in South Asia are multidimensionally poor
06
Nutrition deprivation affects 57% of multidimensionally poor people
07
65% of multidimensionally poor lack access to clean cooking fuel
08
45% of poor lack sanitation, 35% lack clean water per MPI
09
MPI covers 110 countries, 1.3 billion poor in 2023 update
10
Child MPI shows 644 million children multidimensionally poor
11
MPI in India: 234 million poor, 16.4% HDI
12
In Pakistan, MPI 38.3%, affects 53 million
13
Ethiopia MPI 67.5%, 70 million poor
14
Nigeria MPI 32%, 67 million poor
15
School attendance deprivation in 27% poor children globally
16
Housing materials deprivation 56% among poor
17
Assets deprivation affects 82% multidimensionally poor
18
In SSA, 66% poor lack electricity
19
South Asia 40% poor without sanitation
20
Child undernutrition 25% in poor households MPI
21
MPI global H=15.5%, affecting 1.1 billion
22
350 million poor in conflict countries MPI
23
Drinking water deprivation 25% poor, sanitation 43%
24
Child mortality deprivation 15% among poor
25
Years of schooling <6 years for 33% poor adults
26
In Latin America, MPI average 3.8%
27
East Asia MPI 1.4%, lowest
28
67% poor deprived in at least 4 indicators
Interpretation
Dimensions Interpretation
While these numbers paint a stark portrait of a planet still laboring under the weight of poverty, it’s the human details—the 65% cooking over toxic fires, the 82% without basic assets, and the 644 million children born into this deprivation—that transform a statistical abstract into a damning indictment of our collective inaction.
02 · Category
Populations30 stats
01
333 million children under 5 in extreme poverty globally in 2022
02
1 in 6 children worldwide lives in extreme poverty
03
Women and girls are 15% more likely to be poor than men
04
Rural poverty rate is 17.2% vs urban 5.3% globally
05
80% of world's poor live in rural areas
06
Indigenous peoples 19% more likely to be poor
07
Elderly poor face higher rates in low-income countries, 20-30%
08
People with disabilities twice as likely to be poor
09
Youth unemployment exacerbates poverty for 1.3 billion under 25
10
Female-headed households 10-20% poorer on average
11
Refugees and IDPs: 70% in poverty
12
Farmers comprise 75% of extreme poor
13
356 million children in extreme poverty in SSA alone
14
In South Asia, 98 million children extreme poor
15
Globally, 9% of children in extreme poverty vs 6% adults
16
50% of extreme poor are children under 18
17
Adolescent girls 20% more deprived in education
18
Rural children 3x more likely poor than urban
19
40 million children in conflict zones extreme poor
20
Orphaned children 2x poverty risk
21
Migrant children face 15% higher poverty
22
Poor children 3x stunting rate
23
167 million girls not in school, poverty linked
24
Poor households 2x dropout rate
25
815 million poor lack healthcare access
26
Single mothers 30% higher poverty risk
27
Ethnic minorities 2-3x poverty rates
28
Urban slums house 1 billion poor
29
Fishers and pastoralists 50%+ poverty
30
Poor women work 2x hours unpaid
Interpretation
Populations Interpretation
Behind every cold statistic lies a preventable human story, a cascade of inequality where a child's birthplace, gender, or disability too often dictates a life sentence of poverty, proving that our world's greatest failing is its distribution of chance.
03 · Category
Prevalence27 stats
01
In 2022, approximately 712 million people worldwide lived in extreme poverty, defined as less than $2.15 per day in 2017 PPP terms
02
The global extreme poverty rate fell from 38% in 1990 to 8.7% in 2022
03
44% of the world's extreme poor lived in just two countries, Nigeria and the Democratic Republic of Congo, in 2022
04
Between 2019 and 2022, extreme poverty increased by 70 million people due to COVID-19
05
In 2019, 648 million people were in extreme poverty pre-COVID
06
Global poverty headcount ratio at $2.15a day was 9.2% in 2020
07
1.1 billion people live on less than $3.65 per day globally in 2022
08
Nearly 700 million people endure extreme poverty in 2023 estimates
09
Extreme poverty affects 8.5% of the world population as of latest PIP data
10
In 2022, 2.8 billion people were moderately or severely food insecure, linked to poverty
11
Nigeria's poverty increased 10 million 2018-2021
12
Pakistan has 40% population below $3.65/day
13
Yemen: 80% in poverty due to conflict
14
Afghanistan: 23.7 million need aid, half in poverty post-2021
15
Bangladesh: reduced extreme poverty to 0.9% by 2022
16
Global moderate poverty ($3.65/day) affects 44% of population
17
3.5 billion live below $6.85/day upper-middle line
18
In SSA, 59% below $2.15/day
19
1.2 billion in acute food insecurity linked to poverty
20
In 2022, 700 million in extreme poverty, stable post-COVID
21
Madagascar highest poverty rate 77.3% at national line
22
South Sudan 76% extreme poverty
23
Central African Republic 71% poverty
24
Burundi 65% extreme poor
25
Rwanda reduced poverty from 77% to 38% 2006-2017
26
Global $6.85/day poverty 47%
27
4.2 billion below $10/day living wage line
Interpretation
Prevalence Interpretation
The world is simultaneously winning the marathon against extreme poverty while tragically losing several critical sprints, with progress in places like Bangladesh and Rwanda starkly overshadowed by backsliding in nations like Nigeria and the haunting reality that nearly 700 million people still subsist on less than the price of a cup of coffee each day.
More related reading
04 · Category
Regions29 stats
01
Sub-Saharan Africa has 40% of global extreme poor, 429 million people
02
In South Asia, 101 million in extreme poverty in 2022
03
East Asia and Pacific has 23 million extreme poor, lowest regional rate
04
Latin America and Caribbean: 25 million extreme poor at $2.15/day
05
Middle East and North Africa: 40 million in extreme poverty
06
Europe and Central Asia: under 3 million extreme poor
07
In Nigeria, 87 million in extreme poverty, world's highest
08
India reduced extreme poor from 16% to 12% 2011-2019
09
DRC has 75 million extreme poor
10
Ethiopia: 25 million extreme poor despite growth
11
In Sub-Saharan Africa, poverty rate is 35% at $2.15/day
12
Haiti: 59% extreme poverty, highest in LAC
13
Madagascar: 80% below $2.15/day
14
Mozambique: 63% extreme poor
15
Niger: 45% extreme poverty rate
16
Burkina Faso: 37 million multidimensionally poor
17
Tanzania: 26% extreme poverty, 15 million people
18
Uganda: 21 million below poverty line
19
Zambia: 54% poverty rate national line
20
Malawi: 71% below $2.15/day
21
Sierra Leone: 53% extreme poverty
22
In West Asia, 7 million extreme poor
23
China: <1% extreme poverty now
24
Brazil: 5% extreme poverty
25
Indonesia: 9.5% national poverty
26
Philippines: 18% poverty rate
27
Vietnam: reduced to 5% extreme poverty
28
Ghana: 24% below $2.15/day
29
Kenya: 34% extreme poverty
Interpretation
Regions Interpretation
While a few nations are valiantly chiseling down the monolith of poverty, the stark and stubborn concentration of misery in Sub-Saharan Africa reminds us that global inequality remains a gaping, unforgiving chasm.
05 · Category
Trends29 stats
01
Extreme poverty declined from 36% in 1990 to 10% in 2015
02
COVID reversed 3 years of progress, adding 97 million poor 2020-2021
03
By 2030, projected 575 million still in extreme poverty, mostly SSA
04
Annual decline in poverty rate slowed to 0.6% pre-COVID from 1.1%
05
SDG 1.1 target: eradicate extreme poverty by 2030 unlikely
06
$3.65/day poverty projected to affect 3.5 billion by 2030
07
Climate change may push 100 million more into poverty by 2030
08
Social protection reached 52% of extreme poor in 2020s, up from 18%
09
East Asia lifted 784 million out of poverty since 1981
10
Global poverty rate halved between 1990-2015
11
In 2023, 47% decline in extreme poverty since 1990
12
Sub-Saharan Africa poverty rate rose from 54% in 1990 to peak then 35% now
13
South Asia poverty dropped 70% since 1990
14
689 million extreme poor in 2019, peaked at 759m in 2020
15
In 2023, extreme poverty rate at 8.5%
16
Extreme poverty rate dropped 1% annually 2013-2019
17
By 2015, 1 billion lifted out since 1990
18
China alone lifted 800 million since 1978
19
India: 415 million escaped poverty 2005-2021
20
SSA needs to halve poverty every 5 years for SDG
21
Conflict drives 75% of poverty increase since 2015
22
Digital financial services reduced poverty 2% in poor countries
23
Cash transfers cut poverty 10% in recipient countries
24
Remittances $831 billion to low/middle income, poverty buffer
25
Global poverty fell 20% 2010-2019
26
By 2030, 7.3% extreme poverty if trends continue
27
Universal basic income pilots cut poverty 20-30%
28
Microfinance reaches 140 million poor
29
Agriculture growth reduces poverty 1.6x more in poor countries
Interpretation
Trends Interpretation
While we've heroically lifted a billion people from extreme poverty since 1990, our progress is now stalling so precariously that we're in a race against pandemics, conflict, and climate change just to stop the backslide, let alone finish the job by 2030.
Reference
Cite This Report
This report is designed to be cited. We maintain stable URLs and versioned verification dates. Copy the format appropriate for your publication below.
APA
Margot Villeneuve. (2026, February 13). Poverty In World Statistics. Gitnux. https://gitnux.org/poverty-in-world-statistics
MLA
Margot Villeneuve. "Poverty In World Statistics." Gitnux, 13 Feb 2026, https://gitnux.org/poverty-in-world-statistics.
Chicago
Margot Villeneuve. 2026. "Poverty In World Statistics." Gitnux. https://gitnux.org/poverty-in-world-statistics.
Sources & references
34 datasets cited across this report · attribution is report-level