
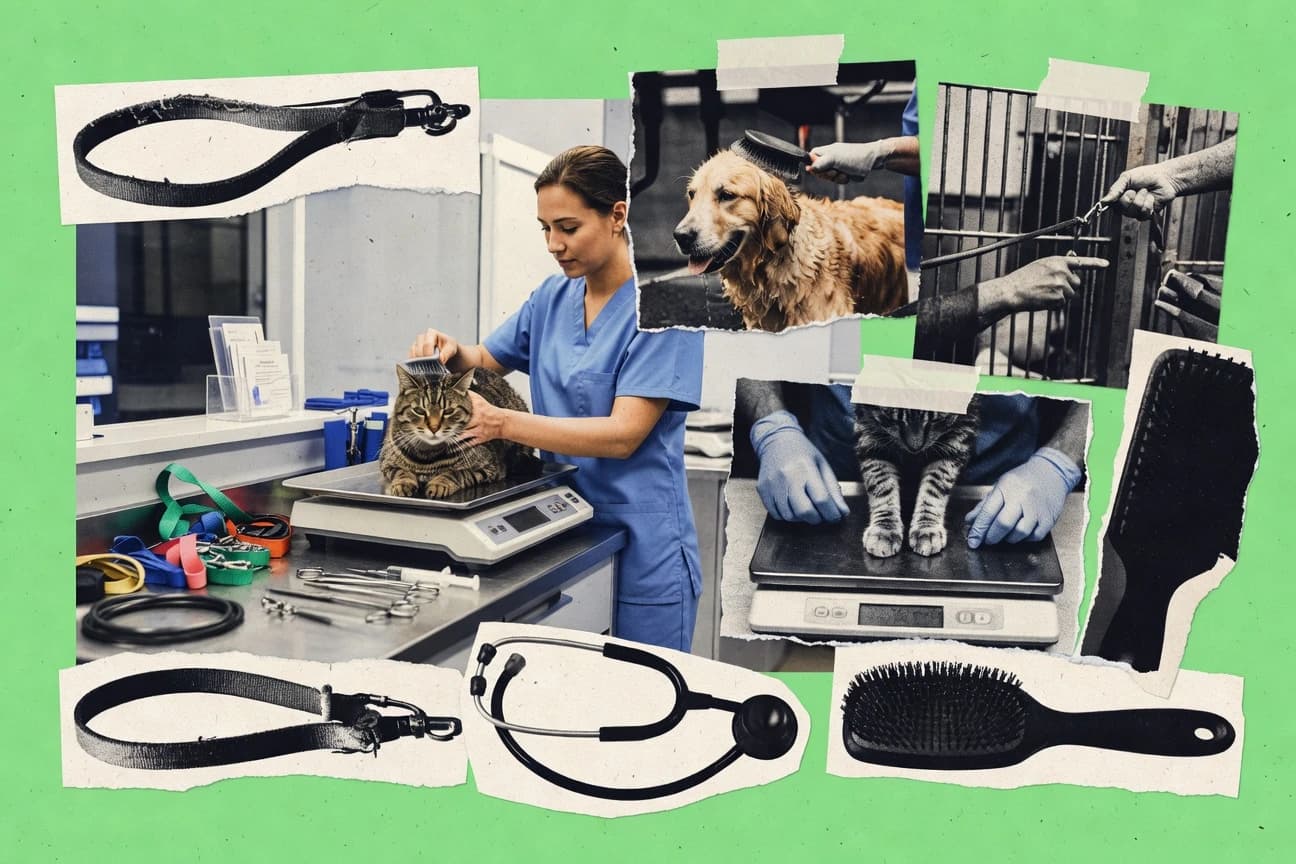

Pet services are becoming a bigger part of everyday life for U.S. households. This page compares what people spend and how often they use services—grooming, daycare, walking, boarding, and training—along with where staffing and demand are shifting. You’ll also see how pet ownership patterns, holiday boarding demand, and regional service mixes shape the market’s growth, including global momentum.
Key Takeaways
- 68% of U.S. pet owners spent on pet grooming services in 2023.
- Average annual spend on pet daycare by U.S. households was $1,250 in 2023.
- 45% of dog owners used professional walking services weekly in 2023 survey.
- 18,500 pet grooming businesses employed 145,000 workers in U.S. 2023.
- Pet services industry added 25,000 jobs in U.S. from 2022-2023.
- Average pet groomer salary $38,500 annually in 2023.
- The U.S. pet services industry generated $12.4 billion in revenue in 2023, marking a 7.2% increase from 2022.
- Global pet grooming services market was valued at $2.8 billion in 2022 and expected to grow at a CAGR of 5.9% from 2023 to 2030.
- Pet boarding and daycare services in the U.S. reached $8.1 billion in 2023.
- 67% of U.S. households own pets, with 86 million pet-owning households in 2023.
- Dogs are owned by 65 million U.S. households, cats by 46 million in 2023.
- 70% of millennials own pets, highest rate among generations in 2023.
- 62% of pet daycare users have working pet parents daily.
- 75% of dog owners groom professionally 4-6 times/year.
- Pet boarding occupancy rates averaged 85% during holidays 2023.
In 2023, booming U.S. pet services drove strong spending, job growth, and high demand across grooming, daycare, and walking.
Related reading
01 · Category
Consumer Spending & Habits25 stats
01
68% of U.S. pet owners spent on pet grooming services in 2023.
02
Average annual spend on pet daycare by U.S. households was $1,250in 2023.
03
45% of dog owners used professional walking services weekly in 2023 survey.
04
U.S. millennials spent 25% more on pet services than baby boomers in 2023.
05
52% of cat owners utilized pet sitting services in the past year per 2023 data.
06
Average cost paid for pet boarding in U.S. was $45per night in 2023.
07
37% of pet parents increased spending on training services by 15% in 2023.
08
Households with pets spent $1,800annually on services on average in 2023 U.S.
09
61% of Gen Z pet owners subscribed to pet service apps in 2023.
10
Average groomer visit cost $65for dogs in U.S. 2023.
11
29% of pet owners paid for waste removal services monthly in 2023.
12
U.S. pet owners' service spending rose 11% to $2,300 average in 2023.
13
48% of high-income households spent over $2,000 yearly on pet services.
14
Pet training session average cost $120per hour in urban U.S. 2023.
15
55% of dog owners used daycare services averaging 3 visits/week.
16
Female pet owners spent 18% more on grooming than males in 2023.
17
42% of pet owners used subscription models for walking services.
18
Average pet sitting fee $25/hour in U.S. suburbs 2023.
19
35% of owners splurged on luxury spa services costing $150+ per visit.
20
Multi-pet households spent 40% more on services annually.
21
50% of urban dwellers paid premium for mobile grooming $100+.
22
Pet insurance holders spent 22% more on elective services.
23
Average hydrotherapy session for pets $75in 2023 U.S.
24
28% of owners budgeted specifically for training $500/year average.
25
Remote workers increased daycare spending by 30% in 2023.
Interpretation
Consumer Spending & Habits Interpretation
Consumer spending habits show clear momentum as 68% of U.S. pet owners paid for grooming in 2023 and pet care spend skews higher for younger buyers with millennials spending 25% more than baby boomers.
02 · Category
Industry Employment & Operations25 stats
01
18,500 pet grooming businesses employed 145,000 workers in U.S. 2023.
02
Pet services industry added 25,000 jobs in U.S. from 2022-2023.
03
Average pet groomer salary $38,500annually in 2023.
04
12,000 pet daycare centers operate in U.S. with 90,000 staff.
05
Dog trainers median wage $45,000per year 2023 BLS data.
06
Pet sitting workforce grew 15% to 450,000 independent sitters.
07
7,200 pet boarding kennels employ 65,000 in U.S.
08
Franchised pet services like Camp Bow Wow have 250 locations, 5,000 employees.
09
Mobile groomers number 8,500 vehicles servicing 2 million pets yearly.
10
Pet waste removal employs 12,000 scoopers full-time equivalent.
11
Training certification holders reached 35,000 CPDT-KA in 2023.
12
Average daycare staff-to-dog ratio 1:10 nationally.
13
22% of pet service workers are certified in CPR/first aid.
14
U.S. pet services businesses total 45,000 establishments in 2023.
15
Walker turnover rate 28% annually in app-based services.
16
Grooming salon staff averages 5 employees per location.
17
60% of pet service businesses family-owned or small biz.
18
Pet sitter insurance coverage 75% of independents.
19
Daycare managers earn average $52,000salary 2023.
20
3,200 agility training facilities with 10,000 instructors.
21
Boarding facilities average 50 kennels, 20 staff members.
22
Exotic pet service specialists 2,500 licensed pros.
23
Service industry labor costs 35% of total revenue average.
24
85% of groomers trained via apprenticeships or vet tech programs.
25
Pet services projected to add 50,000 jobs by 2028 U.S.
Interpretation
Industry Employment & Operations Interpretation
In 2023, the Industry Employment and Operations segment showed strong expansion and staffing growth with 18,500 pet grooming businesses employing 145,000 workers and the broader pet services industry adding 25,000 jobs from 2022 to 2023.
03 · Category
Market Size & Revenue30 stats
01
The U.S. pet services industry generated $12.4 billion in revenue in 2023, marking a 7.2% increase from 2022.
02
Global pet grooming services market was valued at $2.8 billion in 2022 and expected to grow at a CAGR of 5.9% from 2023 to 2030.
03
Pet boarding and daycare services in the U.S. reached $8.1 billion in 2023.
04
The pet training services segment accounted for 22% of total pet services revenue in North America in 2023.
05
U.S. dog walking services market size was $1.2 billion in 2023, up 8% year-over-year.
06
Pet sitting services in Europe generated €3.5 billion in 2022.
07
The overall pet services industry in the U.S. is projected to reach $15.6 billion by 2028.
08
Mobile pet grooming services market grew to $1.1 billion globally in 2023.
09
U.S. pet daycare revenue hit $4.7 billion in 2023.
10
Pet hotel services in Asia-Pacific valued at $2.3 billion in 2023.
11
Canadian pet services industry revenue was CAD 2.8 billion in 2023.
12
U.S. pet walking and sitting services combined for $2.9 billion in 2022.
13
Global pet behavior training market size reached $1.5 billion in 2023.
14
Pet grooming market in the UK was £1.2 billion in 2023.
15
U.S. luxury pet services segment generated $3.4 billion in 2023.
16
Pet daycare services in Australia reached AUD 1.1 billion in 2023.
17
Global pet sitting app-based services market valued at $800 million in 2023.
18
U.S. pet boarding facilities revenue grew 9.5% to $5.2 billion in 2023.
19
Pet training e-learning platforms market hit $450 million worldwide in 2023.
20
Brazil pet services industry revenue was BRL 4.5 billion in 2023.
21
U.S. pet grooming salons numbered over 15,000 in 2023 with $6.8 billion revenue.
22
Pet waste removal services market in U.S. reached $650 million in 2023.
23
Global pet spa services market valued at $1.9 billion in 2023.
24
Pet obedience training services in U.S. generated $900 million in 2023.
25
Europe pet daycare market size was €2.1 billion in 2023.
26
U.S. mobile pet sitting services revenue up 12% to $750 million in 2023.
27
Pet hydrotherapy services market globally $350 million in 2023.
28
India pet grooming market reached INR 15 billion in 2023.
29
U.S. pet services industry CAGR projected at 6.8% from 2023-2028.
30
Pet agility training market in North America $250 million in 2023.
Interpretation
Market Size & Revenue Interpretation
For the Market Size & Revenue view, U.S. pet services reached $12.4 billion in 2023 with a 7.2% year over year rise while key subcategories like U.S. boarding and daycare at $8.1 billion and Europe pet sitting at €3.5 billion show strong, expanding demand across regions.
More related reading
report visual · Projection
U.S. Pet Services Industry Revenue Growth (2019–2024)
U.S. pet services industry revenue rises year over year, led by 2024 as the highest level, with sustained growth across the 2019–2024 period.
7.2 USD billions
Start
+13.06%
CAGR · 5y
13.3 USD billions
Projected
20192024
source-verifiedfreedoniagroup.com2024
04 · Category
Pet Ownership Trends20 stats
01
67% of U.S. households own pets, with 86 million pet-owning households in 2023.
02
Dogs are owned by 65 million U.S. households, cats by 46 million in 2023.
03
70% of millennials own pets, highest rate among generations in 2023.
04
Pet ownership grew 5% post-pandemic, reaching 90.5 million households.
05
23% of U.S. households own both dogs and cats in 2023.
06
Senior citizens' pet ownership rate at 62% in 2023 U.S. survey.
07
Exotic pet ownership rose 15% to 12 million birds/reptiles in 2023.
08
Urban pet ownership density 55% vs. rural 75% in 2023.
09
Single-person households pet ownership at 58% in 2023.
10
Hispanic households pet ownership increased to 49% in 2023.
11
38% of pet owners have small dogs under 20 lbs in 2023.
12
Cat ownership per household averages 2.1 cats in multi-cat homes.
13
Pet ownership among Gen Z reached 36% in 2023.
14
15 million U.S. households adopted pets during 2020-2023.
15
Female-headed households own pets at 72% rate vs. 65% male.
16
Apartment dwellers own 40% dogs, 60% cats predominantly.
17
Pet ownership correlates with 80% of families with children under 6.
18
Bird ownership steady at 7.5 million households in 2023.
19
25% increase in senior dog ownership among 55+ in 2023.
20
Multi-generational homes pet ownership at 82% in 2023.
Interpretation
Pet Ownership Trends Interpretation
Pet ownership remains broadly entrenched in the Pet Ownership Trends story, with 67% of U.S. households owning pets and the count rising 5% post-pandemic to 90.5 million households, while millennials lead the way at 70% ownership in 2023.
05 · Category
Service Utilization24 stats
01
62% of pet daycare users have working pet parents daily.
02
75% of dog owners groom professionally 4-6 times/year.
03
Pet boarding occupancy rates averaged 85% during holidays 2023.
04
40% of pet owners use walking services 3+ times/week.
05
Training classes attendance up 20% for puppies in 2023.
06
Mobile grooming booked 55% of total grooming appointments urban.
07
28% of cats receive annual grooming services professionally.
08
Daycare utilization peaks at 12-3pm for 70% of clients.
09
Pet sitting requests doubled for overnight stays post-2022.
10
65% of large breed dogs in obedience training programs.
11
Waste removal services used by 22% weekly in suburbs.
12
Hydrotherapy utilized by 15% of senior pets annually.
13
App-based services account for 60% of walking bookings.
14
Boarding facilities report 92% satisfaction for luxury options.
15
Puppy socialization classes 80% enrollment rate new owners.
16
35% of exotic pet owners use specialized care services.
17
Group daycare preferred by 70% over individual play.
18
Grooming wait times average 2 weeks in peak seasons.
19
48% use training for behavioral issues primarily.
20
Overnight pet sitting 45% of total sitting gigs.
21
Spa add-ons chosen in 55% of grooming visits.
22
Agility training classes 25% growth in participation.
23
52% of services now offer webcam monitoring.
24
Drop-in walking services 30% of total walks.
Interpretation
Service Utilization Interpretation
Within service utilization, the strongest signal is that high levels of repeat engagement are common, with 75% of dog owners grooming 4 to 6 times per year and 40% using walking services 3 or more times weekly, while boarding also stays busy at an 85% holiday occupancy rate.
Reference
Cite This Report
This report is designed to be cited. We maintain stable URLs and versioned verification dates. Copy the format appropriate for your publication below.
APA
Thomas Lindqvist. (2026, February 13). Pet Services Industry Statistics. Gitnux. https://gitnux.org/pet-services-industry-statistics
MLA
Thomas Lindqvist. "Pet Services Industry Statistics." Gitnux, 13 Feb 2026, https://gitnux.org/pet-services-industry-statistics.
Chicago
Thomas Lindqvist. 2026. "Pet Services Industry Statistics." Gitnux. https://gitnux.org/pet-services-industry-statistics.
Sources & references
1 datasets cited across this report · attribution is report-level