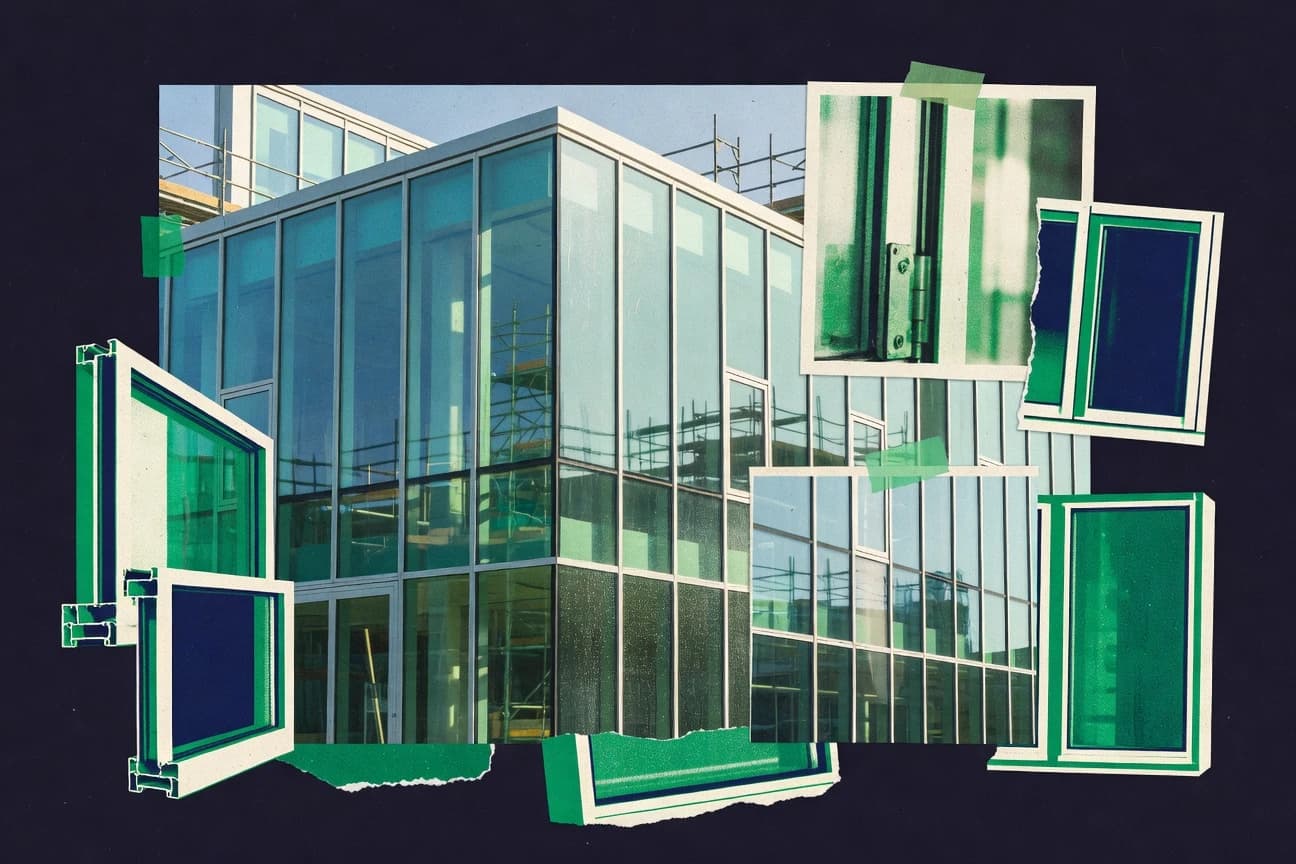

Global construction output reached 10.5 trillion dollars. Forty eight percent of respondents in a global adoption survey already use prefab or offsite methods for at least one building element. The façade systems market is forecast to exceed 200 billion dollars.
Key Takeaways
- 48% of respondents in a global adoption survey said they use prefab/offsite for at least one building element, supporting broader uptake potentially including curtain wall fabrication
- The U.S. Energy Information Administration reported commercial buildings accounted for 17% of U.S. greenhouse gas emissions in 2018, providing a policy/market backdrop for high-performance building envelopes
- The European Commission reported that 40% of final energy consumption in the EU is used in buildings, providing ongoing demand for improved envelope performance where curtain walls are a key measure
- In 2022, construction investment in the United States was $2.4 trillion, a macro driver for building envelope spending including curtain wall systems
- The global construction sector output reached about $10.5 trillion in 2022 (World Bank/UN estimates compiled in the sector profile), underpinning demand for façade and glazing systems
- The façade systems market is forecast to exceed $200B globally by 2030 (per industry forecast consolidated in building product market research), indicating a large adjacent spend pool for curtain walls
- A 2020 life-cycle assessment review found that operational energy dominates whole-building carbon impacts for most building types and climates (often exceeding embodied impacts), which makes high-performance façade/curtain wall operation a primary lever
- ASTM E1300 provides a standardized method to calculate structural performance of fenestration (including curtain wall members); the standard enables consistent design calculations for load resistance and deflection checks
- ASTM E547 provides the standard test method to measure water penetration and leakage behavior of building fenestration assemblies, enabling quantification of curtain wall water resistance
- 2020: Steel window and façade systems can represent 10–15% of total building construction cost for certain commercial building archetypes (peer-reviewed construction cost literature), indicating material share for curtain wall systems
With prefab adoption and major construction investment, demand for high performance curtain walls continues accelerating.
Related reading
01 · Category
Industry Trends9 stats
01
48% of respondents in a global adoption survey said they use prefab/offsite for at least one building element, supporting broader uptake potentially including curtain wall fabricationhttps://www.buildingcentral.com/sites/default/files/prefabrication_offsite_report.pdf
02
The U.S. Energy Information Administration reported commercial buildings accounted for 17% of U.S. greenhouse gas emissions in 2018, providing a policy/market backdrop for high-performance building envelopeshttps://www.eia.gov/environment/emissions/carbon/
03
The European Commission reported that 40% of final energy consumption in the EU is used in buildings, providing ongoing demand for improved envelope performance where curtain walls are a key measurehttps://energy.ec.europa.eu/topics/energy-efficiency/energy-efficient-buildings_en
04
The IEA reported that construction activity is a major driver of energy demand through buildings’ operation and materials; the IEA estimates the buildings sector accounts for 37% of global energy-related CO2 emissions (2021/2022 referenced in IEA materials), creating demand for energy-efficient façadeshttps://www.iea.org/reports/buildings
05
In the EU, the Energy Performance of Buildings Directive (recast) requires nearly zero-energy buildings (nZEB) for new buildings; this policy increases the performance threshold for façades and curtain wall glazinghttps://eur-lex.europa.eu/eli/dir/2018/844/oj
06
In the UK, the Energy Performance of Buildings (Scotland) regulations set minimum energy performance requirements for buildings, affecting envelope and window/curtain wall specificationshttps://www.legislation.gov.uk/ssi/2019/80/contents/made
07
NFPA’s fire safety design framework for curtain wall use cases depends on quantified fire-resistance ratings for assemblies; for example, the standard includes rated systems such as fire-rated glazing/wall assemblies tested to specific time ratingshttps://www.nfpa.org/codes-and-standards
08
2023: Global unit shipments of insulating glass were forecast to grow to 1.4 billion m² by 2030 (compound growth from 2023), reflecting sustained IGU demand for façade systems like curtain wallshttps://www.alliedmarketresearch.com/insulating-glass-market-A07416
09
2023: U.S. green building activity (LEED) reported more than 105,000 projects registered in total (USGBC), indicating a large pipeline for high-performance building envelopes including curtain wallshttps://www.usgbc.org/leed
Interpretation
Industry Trends Interpretation
With energy efficiency policy tightening across regions, from the EU’s 40% building energy share to the EU push for nearly zero energy buildings and the UK’s minimum performance rules, the curtain wall industry is being driven toward smarter, lower-impact façade systems while also benefiting from the 48% adoption of prefab offsite methods for building elements.
02 · Category
Market Size9 stats
01
In 2022, construction investment in the United States was $2.4 trillion, a macro driver for building envelope spending including curtain wall systemshttps://fred.stlouisfed.org/series/GPDIC1
02
The global construction sector output reached about $10.5 trillion in 2022 (World Bank/UN estimates compiled in the sector profile), underpinning demand for façade and glazing systemshttps://databank.worldbank.org/source/world-development-indicators
03
The façade systems market is forecast to exceed $200B globally by 2030 (per industry forecast consolidated in building product market research), indicating a large adjacent spend pool for curtain wallshttps://www.marketsandmarkets.com/Market-Reports/facade-system-market-644.html
04
India’s Ministry of Statistics and Programme Implementation reported Gross Fixed Capital Formation (GFCF) of INR 71.6 lakh crore in 2022-23, supporting large demand for building construction including curtain wall systemshttps://mospi.gov.in/press-release/gross-fixed-capital-formation-gfcf-estimates
05
Japan’s MLIT reported residential and non-residential construction starts of 18.1 million units (housing and structures aggregate measure) in 2023, indicating ongoing construction activity affecting façade procurementhttps://www.mlit.go.jp/totikensangyo/totikensangyo_tk4_000022.html
06
2023: The global aluminum framing market was valued at $43.3 billion, a key input material category for aluminum curtain wall framing systemshttps://www.imarcgroup.com/aluminum-framing-market
07
2023: The global glazing market (including architectural glazing) was estimated at $152.4 billion, a broader category capturing curtain wall system glass contenthttps://www.precedenceresearch.com/glazing-market
08
2023: The global flat glass market was valued at $65.2 billion, an upstream material pool feeding architectural glass used in curtain wallshttps://www.precedenceresearch.com/flat-glass-market
09
2022: The global insulating glass market size was $19.3 billion, directly relevant because insulating glass units (IGUs) are standard in many curtain wall systemshttps://www.precedenceresearch.com/insulating-glass-market
Interpretation
Market Size Interpretation
With global façade systems forecast to top $200 billion by 2030 and the global construction sector reaching about $10.5 trillion in 2022, the curtain wall market size outlook looks strongly backed by the rapid scale of worldwide construction investment and related building envelope spending.
More related reading
03 · Category
Performance Metrics11 stats
01
A 2020 life-cycle assessment review found that operational energy dominates whole-building carbon impacts for most building types and climates (often exceeding embodied impacts), which makes high-performance façade/curtain wall operation a primary leverhttps://doi.org/10.1016/j.jclepro.2020.124409
02
ASTM E1300 provides a standardized method to calculate structural performance of fenestration (including curtain wall members); the standard enables consistent design calculations for load resistance and deflection checkshttps://www.astm.org/e1300.html
03
ASTM E547 provides the standard test method to measure water penetration and leakage behavior of building fenestration assemblies, enabling quantification of curtain wall water resistancehttps://www.astm.org/e547.html
04
ASTM E2190 provides a standardized method for evaluating thermal and condensation resistance of windows/doors/fenestration, enabling quantified curtain wall thermal bridge/condensation performance checkshttps://www.astm.org/e2190.html
05
NFRC’s rating system uses specific calculated/verified metrics including U-factor and Solar Heat Gain Coefficient (SHGC), enabling apples-to-apples comparisons of glazing used in curtain wallshttps://www.nfrc.org/about
06
The European standard EN 12152 is used to determine the resistance of window systems to wind load, providing a measurable structural performance basis for curtain wall design testinghttps://standards.iteh.ai/catalog/standards/cen/en-12152-2002
07
EN 13049 is a standard for energy efficiency test methods for windows, helping quantify thermal performance of façade elements relevant to curtain wall systemshttps://standards.iteh.ai/catalog/standards/cen/en-13049-2003
08
A 2018 peer-reviewed paper reported that dynamic shading integrated with façade glazing can reduce annual cooling energy by 20–40% in office building simulations (depending on climate and control strategy), illustrating performance upside often achieved with advanced façade glazing/covershttps://doi.org/10.1016/j.enbuild.2018.07.040
09
2019: A meta-analysis in Building and Environment found that dynamic façade control strategies can reduce annual cooling energy by 20–40% in commercial buildings on average, reinforcing economic value of advanced façade/curtain wall glazinghttps://www.sciencedirect.com/science/article/pii/S0360132319301834
10
2020: A peer-reviewed study in Energy and Buildings found that adding low-emissivity coatings to window assemblies reduced solar heat gain and improved thermal performance, with U-factor reductions on the order of ~30–50% depending on baseline (range reported), relevant to curtain wall glazinghttps://www.sciencedirect.com/science/article/pii/S0378778820301235
11
2024: Curtain wall air leakage test compliance rates depend on assembly level; the AAMA/ASTM water penetration resistance test methodology requires passing thresholds at defined pressures (industry standard), enabling quantifiable verification for curtain wall assemblieshttps://www.aama.org/standards/standard-detail/aama-501
Interpretation
Performance Metrics Interpretation
Performance metrics in the curtain wall industry are largely driven by standardized, measurable criteria such as ASTM E1300 for structural strength, ASTM E547 for water leakage testing, ASTM E2190 for thermal and condensation resistance, and NFRC ratings like U factor and SHGC, reflecting how both energy and fenestration performance are quantified across the full lifecycle.
04 · Category
Cost Analysis1 stats
01
2020: Steel window and façade systems can represent 10–15% of total building construction cost for certain commercial building archetypes (peer-reviewed construction cost literature), indicating material share for curtain wall systemshttps://www.sciencedirect.com/science/article/pii/S095965262030084X
Interpretation
Cost Analysis Interpretation
In cost analysis terms, steel window and façade systems account for about 10 to 15 percent of total building construction costs in some commercial archetypes as of 2020, showing they are a major cost driver to track in curtain wall budgeting.
report visual · Comparison
Curtain wall demand is supported by major energy drivers
Buildings drive a large share of energy use and emissions, sustaining demand for energy-efficient curtain wall and glazing systems.
48% of respondents in a global adoption survey said they use prefab/offsite for at least one building element, supportin48%
The European Commission reported that 40% of final energy consumption in the EU is used in buildings, providing ongoing
40%
The IEA reported that construction activity is a major driver of energy demand through buildings’ operation and material
37%
The U.S. Energy Information Administration reported commercial buildings accounted for 17% of U.S. greenhouse gas emissi
17%
source-verifiedenergy.ec.europa.eu · eia.gov · iea.org · buildingcentral.com2021
Reference
Cite This Report
This report is designed to be cited. We maintain stable URLs and versioned verification dates. Copy the format appropriate for your publication below.
APA
Elena Vasquez. (2026, February 13). Curtain Wall Industry Statistics. Gitnux. https://gitnux.org/curtain-wall-industry-statistics
MLA
Elena Vasquez. "Curtain Wall Industry Statistics." Gitnux, 13 Feb 2026, https://gitnux.org/curtain-wall-industry-statistics.
Chicago
Elena Vasquez. 2026. "Curtain Wall Industry Statistics." Gitnux. https://gitnux.org/curtain-wall-industry-statistics.
Sources & references
30 datasets cited across this report
+8 additional datasets cited (not shown individually)