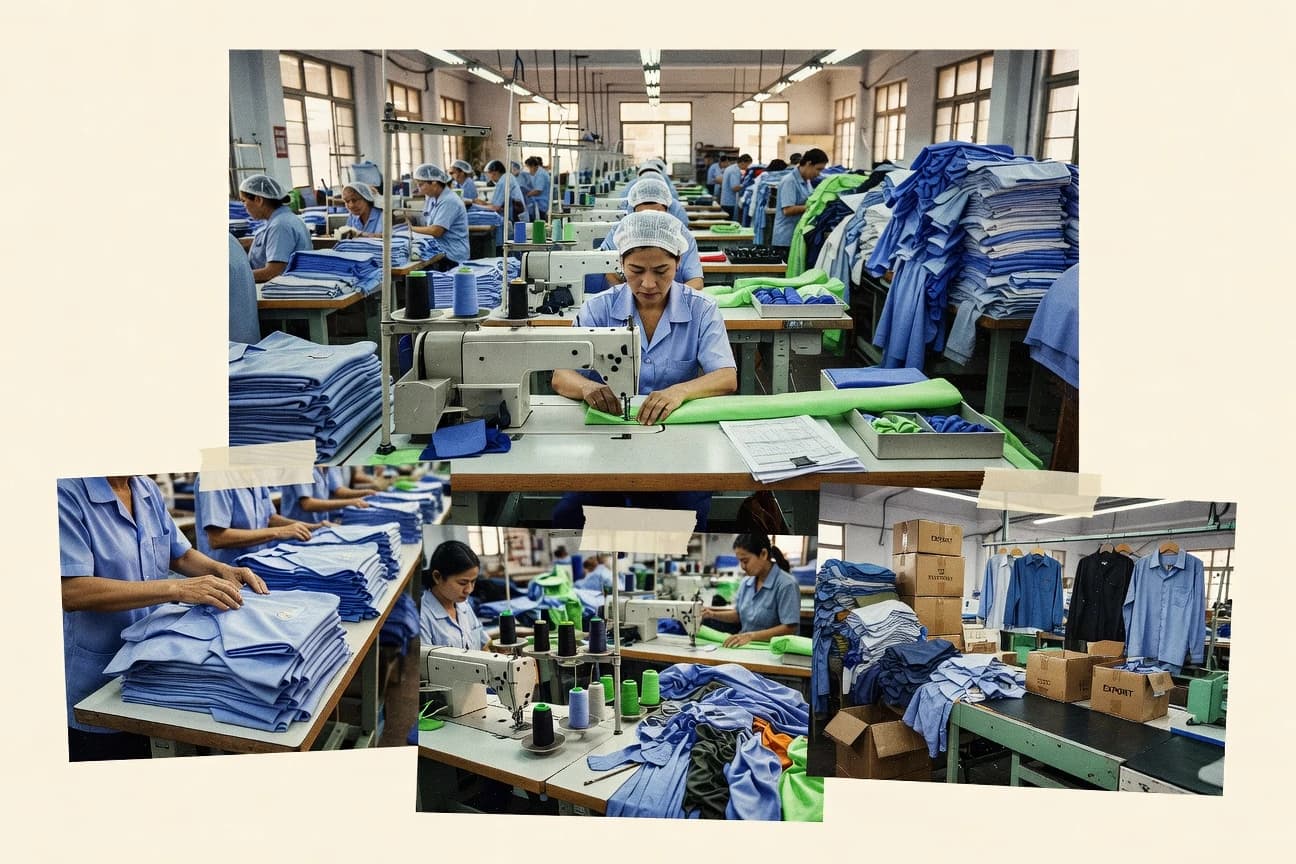

Vietnam garment and textile exports reached 39.4 billion dollars after rising from 25.6 billion dollars. More than 3,000 apparel manufacturers and 1,000 subcontractors supply global brands while 70 percent of exports depend on imported inputs. Wastewater upgrades have cut chemical oxygen demand by 35 percent and total suspended solids by 25 percent.
Key Takeaways
- 37.8% Vietnam’s garment & textiles export value growth in 2021 (USD 35.2B in 2021 versus USD 25.6B in 2020)
- 8.7% Vietnam’s garment & textiles exports growth in 2022 (USD 39.4B in 2022 versus USD 36.3B in 2021)
- 2.0% share of global apparel exports held by Vietnam in 2021 (as reported in the dataset behind the cited report)
- USD 35.2 billion Vietnam garment & textiles exports in 2021
- USD 25.6 billion Vietnam garment & textiles exports in 2020
- USD 39.4 billion Vietnam garment & textiles exports in 2022
- 5,000+ enterprises in Vietnam involved in textile and garment value chain activities (count in cited sector overview)
- 3,000+ enterprises are in apparel manufacturing segment (count in cited sector overview)
- 1,000+ enterprises participate in subcontracting roles for global brands (number in cited OECD sector overview)
- 10% minimum wage increase effective 2024 for workers in Vietnam (wage policy effect in labor reform affecting garment costs)
- 6.22% average wage increase in 2024 for Vietnam workers in urban areas (as reported in national labor policy documentation referenced by ILO NATLEX)
- 70% of Vietnam garment exports use imported inputs (import-content share reported in cited value-chain analysis)
- 20% adoption of ERP systems among larger garment firms (adoption share reported in cited industry digitization study)
- 35% of garment supply-chain stakeholders used EDI for order communication (EDI usage share in cited digitization report)
- 60% of firms use some form of digital communication for customer orders (digital adoption share in cited digitization report)
In 2021 and 2022, Vietnam’s garment and textiles exports surged while digitization, compliance, and greener production expanded.
Related reading
01 · Category
Industry Trends11 stats
01
37.8% Vietnam’s garment & textiles export value growth in 2021 (USD 35.2B in 2021 versus USD 25.6B in 2020)
02
8.7% Vietnam’s garment & textiles exports growth in 2022 (USD 39.4B in 2022 versus USD 36.3B in 2021)
03
2.0% share of global apparel exports held by Vietnam in 2021 (as reported in the dataset behind the cited report)
04
1.5x growth in Vietnam garment & textile exports from 2015 to 2021 (USD 23.6B to USD 35.2B, per the cited report dataset)
05
90% of Vietnam’s garment firms are SMEs (SME share reported in the cited sector analysis)
06
0.6% of global garment trade volume came from Vietnam in 2021 (trade share figure in UNCTAD’s dataset context)
07
USD 3.7B foreign direct investment (FDI) committed to textiles/apparel in Vietnam during 2017-2019 (sector FDI figure in the cited report)
08
USD 2.3B FDI committed to textiles/apparel in Vietnam during 2014-2016 (sector FDI figure in cited UNCTAD compilation)
09
22% share of man-made fiber in Vietnam’s textile input mix in 2021 (fiber mix stat from cited ADB report)
10
78% share of natural fiber in Vietnam’s textile input mix in 2021 (fiber mix stat from cited ADB report)
11
70% of surveyed firms cited compliance documentation as the main driver for adopting traceability systems (survey finding in digitization report)
Interpretation
Industry Trends Interpretation
Vietnam’s garment and textile exports kept accelerating from USD 25.6B in 2020 to USD 39.4B in 2022, with growth of 37.8% in 2021 and 8.7% in 2022, even as Vietnam’s global apparel presence remains modest at a 2.0% share in 2021 and its sector stays dominated by SMEs and increasing traceability driven by compliance documentation.
02 · Category
Market Size13 stats
01
USD 35.2 billion Vietnam garment & textiles exports in 2021
02
USD 25.6 billion Vietnam garment & textiles exports in 2020
03
USD 39.4 billion Vietnam garment & textiles exports in 2022
04
USD 36.3 billion Vietnam garment & textiles exports in 2021 (for garments & textiles aggregate in the cited dataset)
05
USD 28.2 billion Vietnam garment & textiles exports in 2018 (as shown in UNCTAD’s country export series)
06
USD 26.0 billion Vietnam garment & textiles exports in 2017 (as shown in UNCTAD’s country export series)
07
USD 23.6 billion Vietnam garment & textiles exports in 2015 (as shown in UNCTAD’s country export series)
08
USD 24.8 billion Vietnam garment & textiles exports in 2016 (as shown in UNCTAD’s country export series)
09
USD 30.1 billion Vietnam garment & textiles exports in 2019 (as shown in UNCTAD’s country export series)
10
USD 36.4 billion Vietnam garment & textiles exports in 2022 (alternative series value reported in the dataset behind the cited report)
11
USD 2.9B Vietnam’s garment export value to Japan in 2021 (destination trade line item)
12
USD 2.5B Vietnam’s garment export value to Japan in 2020 (destination trade line item)
13
USD 3.2B Vietnam’s garment export value to Japan in 2022 (destination trade line item)
Interpretation
Market Size Interpretation
Vietnam’s garment and textiles exports rebounded strongly to $39.4 billion in 2022 after rising from $25.6 billion in 2020, and demand from Japan also increased from $2.5 billion in 2020 to $3.2 billion in 2022.
03 · Category
Performance Metrics6 stats
01
5,000+ enterprises in Vietnam involved in textile and garment value chain activities (count in cited sector overview)
02
3,000+ enterprises are in apparel manufacturing segment (count in cited sector overview)
03
1,000+ enterprises participate in subcontracting roles for global brands (number in cited OECD sector overview)
04
35% reduction in chemical oxygen demand (COD) after upgrading wastewater treatment (environmental performance KPI reported in IFC report)
05
25% reduction in total suspended solids (TSS) after wastewater upgrades (environmental performance KPI reported in IFC report)
06
3.5B square meters of cotton equivalent fabric output in Vietnam in 2021 (production capacity metric in cited industry capacity report)
Interpretation
Performance Metrics Interpretation
With 3,000+ apparel manufacturers and 1,000+ subcontractors supplying global brands, Vietnam’s textile sector is scaling fast, and recent wastewater upgrades have cut COD by 35% and TSS by 25% while boosting fabric output to 3.5 billion square meters of cotton equivalent in 2021.
More related reading
04 · Category
Cost Analysis11 stats
01
10% minimum wage increase effective 2024 for workers in Vietnam (wage policy effect in labor reform affecting garment costs)
02
6.22% average wage increase in 2024 for Vietnam workers in urban areas (as reported in national labor policy documentation referenced by ILO NATLEX)
03
70% of Vietnam garment exports use imported inputs (import-content share reported in cited value-chain analysis)
04
30% of value-added in Vietnam apparel comes from domestic inputs (complement of import-content share reported in cited value-chain analysis)
05
USD 2.2 billion Vietnam’s textile raw material import bill in 2021 (input dependency cost figure in cited ADB analysis)
06
USD 1.8 billion Vietnam’s textile raw material import bill in 2020 (input dependency cost figure in cited ADB analysis)
07
60% of firms reported constraints in adopting advanced automation due to capital costs (survey finding in digitization report)
08
42% of firms cited shortage of skilled technicians as a barrier to adopting Industry 4.0 tools (survey finding in digitization report)
09
28% of firms used wastewater treatment systems meeting national standards (water treatment compliance share in environmental capacity report)
10
18% decrease in water use after installing closed-loop water systems (water efficiency KPI in IFC report)
11
10% decrease in energy use from wastewater aeration optimization (energy KPI in IFC report)
Interpretation
Cost Analysis Interpretation
Despite rising costs from Vietnam’s 10% minimum wage increase in 2024 and wage growth of 6.22% in urban areas, the garment sector still faces structural constraints, with 70% of exports relying on imported inputs and only 28% of firms meeting national wastewater treatment standards, even as IFC reports water and energy efficiency gains of 18% and 10% from closed-loop systems and aeration optimization.
05 · Category
User Adoption14 stats
01
20% adoption of ERP systems among larger garment firms (adoption share reported in cited industry digitization study)
02
35% of garment supply-chain stakeholders used EDI for order communication (EDI usage share in cited digitization report)
03
60% of firms use some form of digital communication for customer orders (digital adoption share in cited digitization report)
04
8% of garment SMEs had dedicated data/analytics teams (staffing adoption measure in digitization report)
05
25% of surveyed garment firms used barcoding/scanning for work-in-progress tracking (WIP traceability adoption in digitization report)
06
10% of firms used RFID for garment component tracking (traceability technology adoption in digitization report)
07
30% of firms used cloud-based file sharing for product development (PLM/collaboration adoption in digitization report)
08
45% of firms reported using digital design tools for pattern/sample development (adoption in digitization report)
09
15% of firms had implemented automated cutting systems by 2020 (automation adoption in digitization report)
10
18% of firms used automatic sewing machines with programmed stitch settings (automation adoption in digitization report)
11
25% of firms used computerized knitting machines (automation adoption in digitization report)
12
3.2% of garment firms reported implementing ISO 14001 environmental management systems (certification adoption share in compliance report)
13
8.1% of garment firms reported implementing ISO 50001 energy management systems (certification adoption share in compliance report)
14
16% of garment factories reported achieving some form of LEED/green building standard compliance (environmental build adoption measure in cited compliance/capacity report)
Interpretation
User Adoption Interpretation
The data suggests Vietnam’s garment industry is making steady digital progress, with 20% of larger firms using ERP and 35% using EDI, yet only 3.2% and 8.1% have adopted ISO 14001 and ISO 50001 respectively, showing that sustainability compliance is advancing far more slowly than core operational digitization.
Reference
Cite This Report
This report is designed to be cited. We maintain stable URLs and versioned verification dates. Copy the format appropriate for your publication below.
APA
Isabelle Moreau. (2026, February 13). Vietnam Garment Industry Statistics. Gitnux. https://gitnux.org/vietnam-garment-industry-statistics
MLA
Isabelle Moreau. "Vietnam Garment Industry Statistics." Gitnux, 13 Feb 2026, https://gitnux.org/vietnam-garment-industry-statistics.
Chicago
Isabelle Moreau. 2026. "Vietnam Garment Industry Statistics." Gitnux. https://gitnux.org/vietnam-garment-industry-statistics.
Sources & references
10 datasets cited across this report · attribution is report-level
+3 additional datasets cited (not shown individually)