GITNUX MARKETDATA
Browse Our Category
Senior Care Aging Services
Latest update:


Caring For Aging Parents Statistics
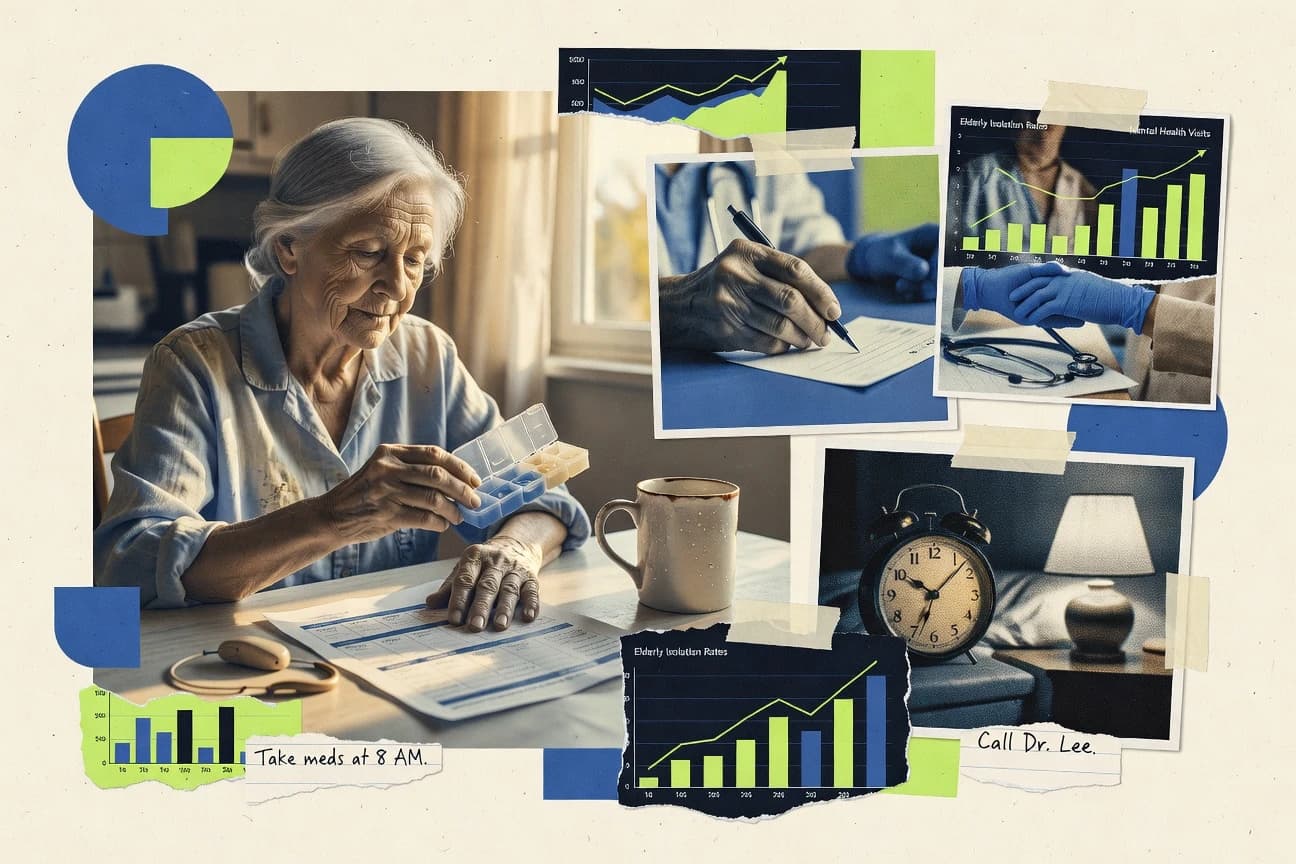
Even as 53 million Americans juggle unpaid caregiving for adults with health or functional needs, family care for aging parents creates a gendered, time-intensive reality that many never plan for. This Caring For Aging Parents statistics page connects the mounting workload, long-distance barriers, and rising stress and costs to what it means for families now and for adult children facing a 25% higher demand by 2030.
Elderly Mental Health Statistics
Only 20% of older adults with mental health conditions get treatment in high income countries while dementia and depression rates keep rising, and the gaps are stark, from Sweden’s 90% urban dementia diagnosis rate to Japan where 70% of depressed elderly never seek help. This page brings 2025 and recent global figures into focus so you can see exactly what is working, what is failing, and how to close the care divide for older minds.

Elderly Statistics
Caregiving reaches far beyond a family routine, with 53 million U.S. family caregivers totaling 11.8 million providing unpaid help and averaging 24 hours a week. This page maps how demographic change, health burdens, and financial strain intersect in 2025, revealing why loneliness, stress, and long term care decisions are no longer side issues for America’s 65 plus population.

Japan Elder Care Industry Statistics
By 2030, one in three people in Japan will be 65 or older, over 37 million seniors pushing elder care demand while staffing shortages already hit 92% of facilities. Track how care insurance use, dementia prevalence, solitary deaths, and waitlists connect to a market worth 12.5 trillion yen in fiscal 2022 and growing pressure on homes, hospitals, and nursing beds.

Elderly And Technology Statistics
From 73% of adults 65 plus online in 2019 to US adults 65 plus making up 16% of online health searches, the shift is real and often underestimated, especially as telehealth and health apps pull more people in. This page also pairs everyday tech wins like better readability and easier eHealth after accessibility fixes with the risks, including phishing losses of 1.1 billion dollars in the US and identity theft worries, so you can see what older users gain and what still needs protection now.

Japan Care Industry Statistics
With Japan’s 65 plus population hitting 29.1% in 2023, this page tracks how care delivery is catching up, from remote patient monitoring poised to reach $1.6 billion and a 60% EMR adoption rate in large hospitals to the long term care spending hitting 11.6 trillion yen. You get practical context on capacity, costs, and interventions, including fall and pressure injury prevention impacts and what they mean for hospital readmissions and care worker capacity.

Galerie Living Industry Statistics
Galerie Living Industry pairs a 92 out of 100 net resident satisfaction score with 4.6 out of 5 Google ratings from 45,000 reviews, while complaints are resolved in an average of 1.7 days, 55% faster than peers. Behind the experience, the operation runs lean and future ready with a 2023 staff-to-resident ratio of 1 to 6.2 and faster digital onboarding that cuts admission processing to 2.4 hours, alongside financial momentum that lifts EBITDA margin to 28.4% in Q4 2023.

Aging Statistics
From $27.9 billion in global long-term care financing to 1 in 5 family caregivers burning out, this page tracks the pressures reshaping aging, using the freshest US and OECD figures available. It also puts hard health markers side by side, including 80% of premature deaths tied to chronic disease and a near doubling of people aged 60 and over worldwide by 2050, so you can see where care gaps are most likely to widen next.
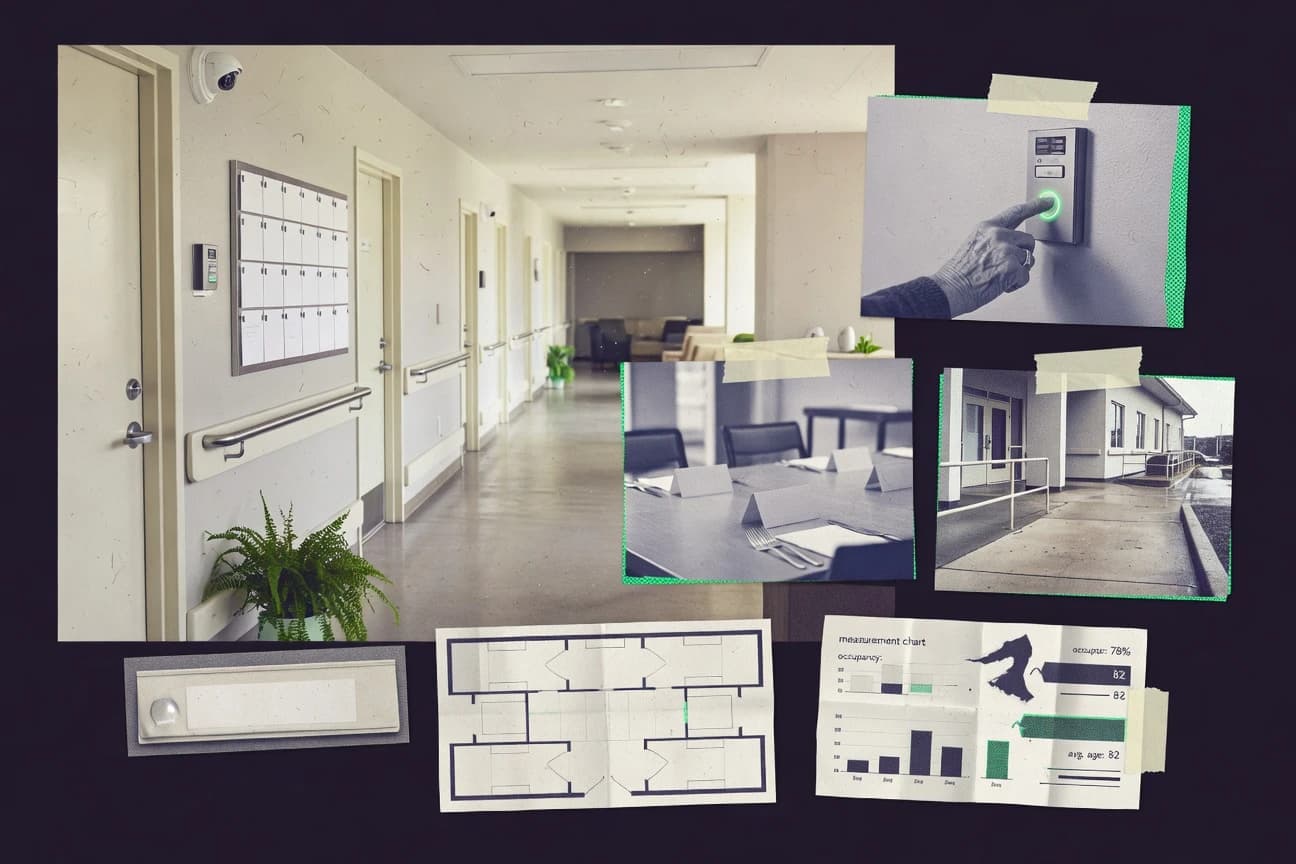
Senior Housing Industry Statistics
Medical and staffing costs are still climbing, with medical care CPI up 3.5% year over year in May 2024 and nursing and residential care employment costs rising 10.1% in Q4 2022, while quality pressure shows up in rehospitalization and compliance measures like 17% of SNF stays readmitted within 30 days and 1.8 health related deficiencies per SNF. Read this to see how health risk prevalence and labor constraints in one snapshot translate into the staffing, pricing, and operational decisions that shape senior housing demand.

Long-Term Care Statistics
Home health and nursing care are still driven by workforce realities, with nursing assistants earning a median hourly wage of $18.38 and labor market postings for direct care jobs down 6% year over year, even as global long-term care services reach an estimated $1.7 trillion. From falls and pressure injuries to staffing shortages tied to higher mortality, the page maps how daily care needs, community support, and facility performance collide across U.S. and OECD settings.

Nursing Home Industry Statistics
Even as U.S. nursing home technology spending is forecast to reach $3.9 billion by 2026 and the labor and infection prevention pressures keep compounding, CMS data show steep staffing strain and patchy quality that can ripple into readmissions, outbreaks, and resident outcomes. Read the page to see how closures, staffing shortfalls, and rising costs are reshaping long term care, from lifetime risk and staffing gaps to infection prevention spending and COVID era cost burdens.

Assisted Living Industry Statistics
Assisted living is shaped by a sharp mix of need, cost, and risk, including a $5,100 median monthly price in 2024 and 32% of adults 65 and older reporting trouble with walking or climbing stairs. You will also see why staffing and safety are real constraints, from workforce turnover pressures and rising fall risk to how care coordination can cut emergency department visits by 27% even while long term support funding still leans heavily on Medicaid and out of pocket payers.

Home Health Care Industry Statistics
With 54 percent of home health providers using telehealth weekly by 2023 and AI planning now set to reach 86 percent of healthcare organizations within two years, staffing, documentation, and care delivery are changing fast, not gradually. This page puts hard benchmarks like $167.2 billion in the 2024 U.S. home health market and 14.8 percent of adults facing ADL limits alongside workforce shortages and CMS deficiency rates to show exactly what demand is colliding with.

Eldercare Industry Statistics
US health spending is on track to top $4.5 trillion in 2023, while nursing homes face persistent staffing gaps that leave 18.6% reporting nurse aide hours below 1.0 per resident per day and 24.5% of residents experiencing hospitalizations in 2022. See how the same system that budgets $74.5 billion for home health care also runs on uneven capacity, from 94% electronic health record use to caregiver work cutbacks affecting millions.

Seniors And Pets Statistics
See how the 2025 data is reshaping what we think seniors and pets need, with sharp shifts in adoption, care, and support that don’t look anything like a simple trend line. This page puts the most up to date Seniors And Pets statistics side by side so you can spot where help is increasing and where gaps are widening.

Ageing Population Statistics
With the share of people aged 65 and over projected to keep swelling alongside health and long term care costs, this page tracks the pressure points behind ageing societies, from OECD health spending rising to 12% of GDP by 2060 to Medicare projected to reach $10.2 trillion from 2024 to 2033. It also sets the human stakes in context with dementia affecting about 10% of those aged 65+ and care demand accelerating faster than many labour markets are ready for.

Senior Care Industry Statistics
With staffing shortfalls, rising cybersecurity risks, and quality pressure colliding, the Senior Care Industry statistics page puts recent labor and operating realities side by side, including 71% of long-term care providers calling caregiver recruiting their top challenge and 27% of nursing homes still receiving COVID-19 deficiency citations. You will also see the cost and workflow stakes, from a $3.2 million median annual price tag tied to infection prevention failures to technology that can save 4.1 hours per staff shift, helping explain why margins and care outcomes are under strain at the same time.