GITNUX MARKETDATA
Browse Our Category
Safety Accidents
Latest update:


Cruise Accidents Statistics
From engine failures that trigger high stakes rescues like Viking Sky in 2019 to pier and grounding incidents that leave passengers shaken but sometimes surprisingly uninjured, these Cruise Accidents statistics track how quickly risk can shift from routine sailing to emergency. Tucked alongside headline catastrophes are the injury counts and infectious disease outbreaks, including the CDC reporting 12 norovirus outbreaks affecting 1,200 plus passengers, making clear why both mechanical breakdown and public health can turn one voyage into a crisis.
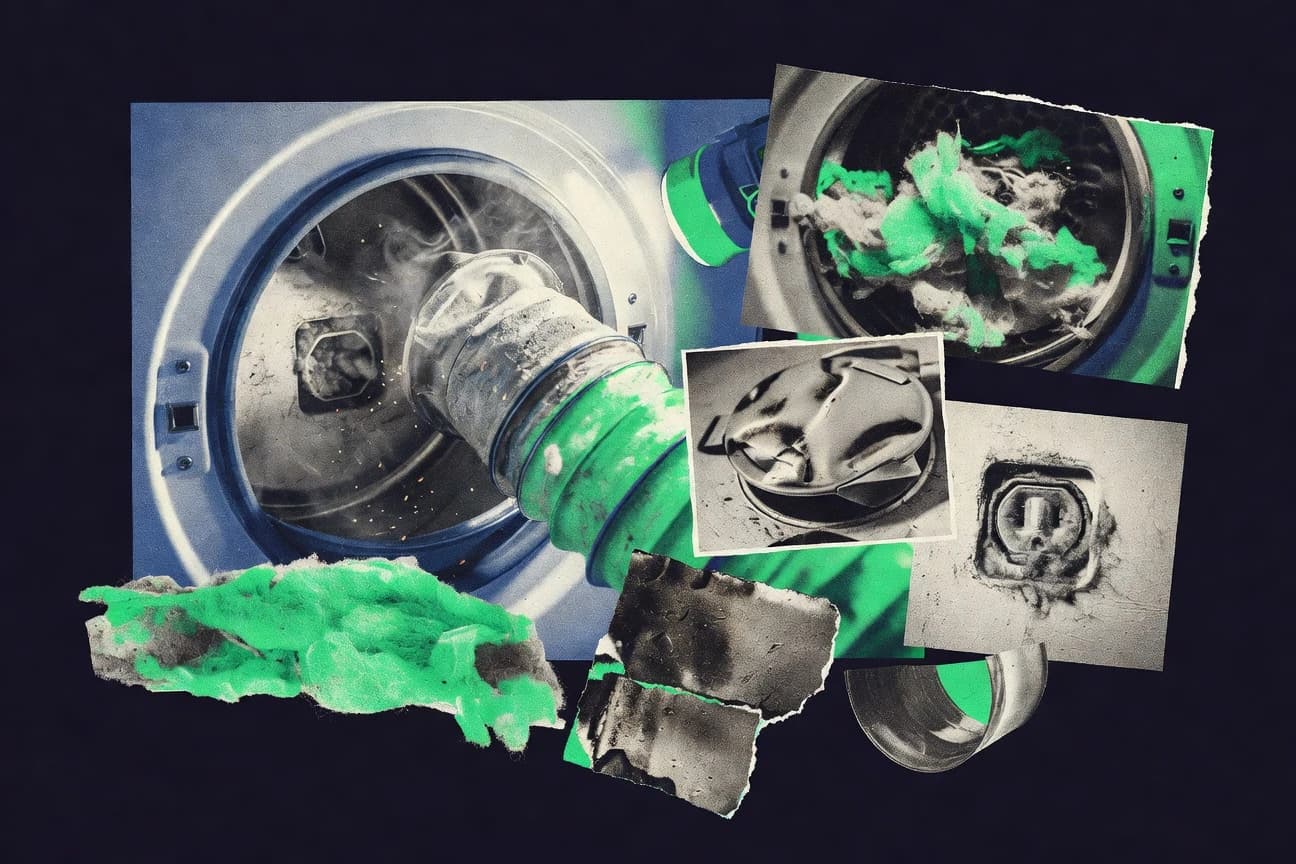
Dryer Vent Fire Statistics
Every year from 2014 to 2018, US fire departments responded to about 15,500 dryer vent fires, and the average property damage climbed to $13,000 per incident, yet a large share is driven by preventable lint and vent failures that annual cleaning can cut dramatically. See how costs surge from state to state and why the risk is not just bigger claims, it is also faster, deadlier smoke and hidden home hazards that hit worst in real routines.
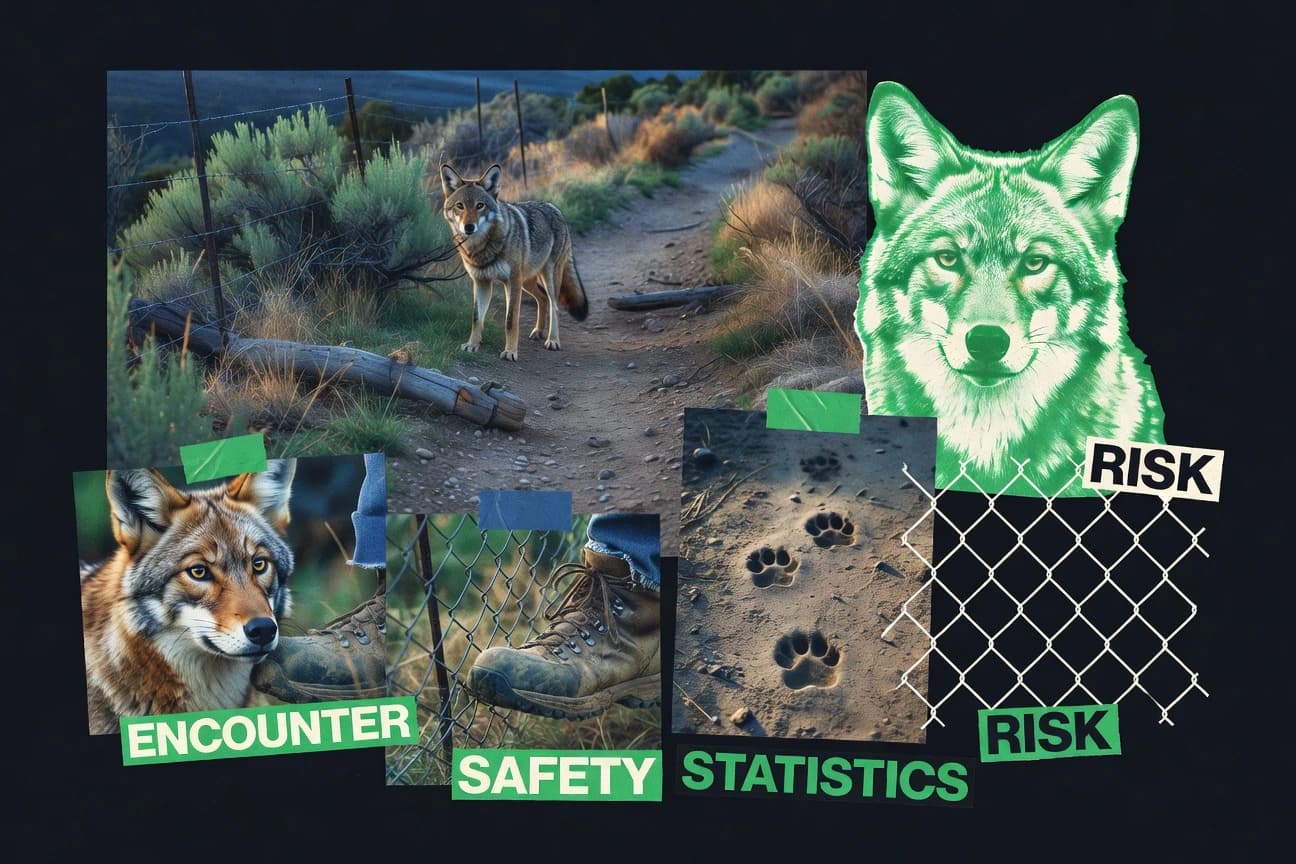
Coyote Attacks On Humans Statistics
New 2025 projections estimate about 300 coyote bites nationwide, but the most urgent pattern is happening right now in urban backyards and parks, where lacerations to hands and legs drive most injuries and children make up the largest share of victims. This page maps the sharp local swings, from Los Angeles area contact surges to prevention efforts that cut repeat problems, so you can see where risk concentrates and what actually reduces it.

Construction Site Accident Statistics
Falls still dominate construction fatalities at 38.6 percent from 2011 to 2018, but the page also spotlights how electrocutions and struck by incidents climb in the most preventable moments, with improper grounding tied to 42 percent of construction electrocutions and backing related vehicle deaths driving 45 percent of vehicle fatalities. Updated with 2025 framed safety takeaways and the latest cost pressures, it connects what is killing workers with what insurers and OSHA cite most often, so you can see exactly where prevention is most likely to pay off.
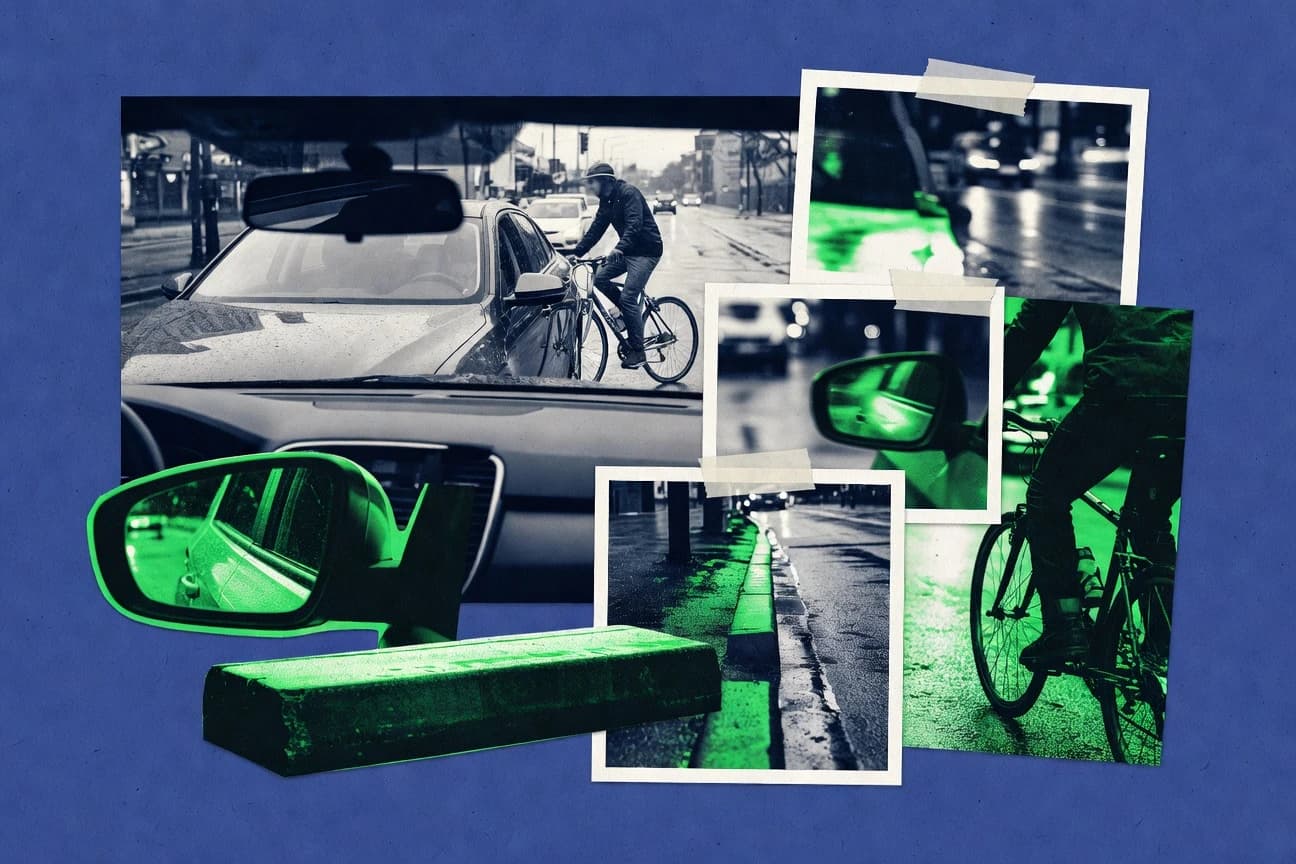
Blind Spot Accident Statistics
See how a simple head check can cut blind spot crash risk by 40 percent, even as phone distraction and night driving push likelihood sharply higher. From 15,500 severe injuries in 2022 and $150 billion in annual economic cost to the practical fixes that reduce unreported incidents, this page turns blind spot myths into numbers you can act on.
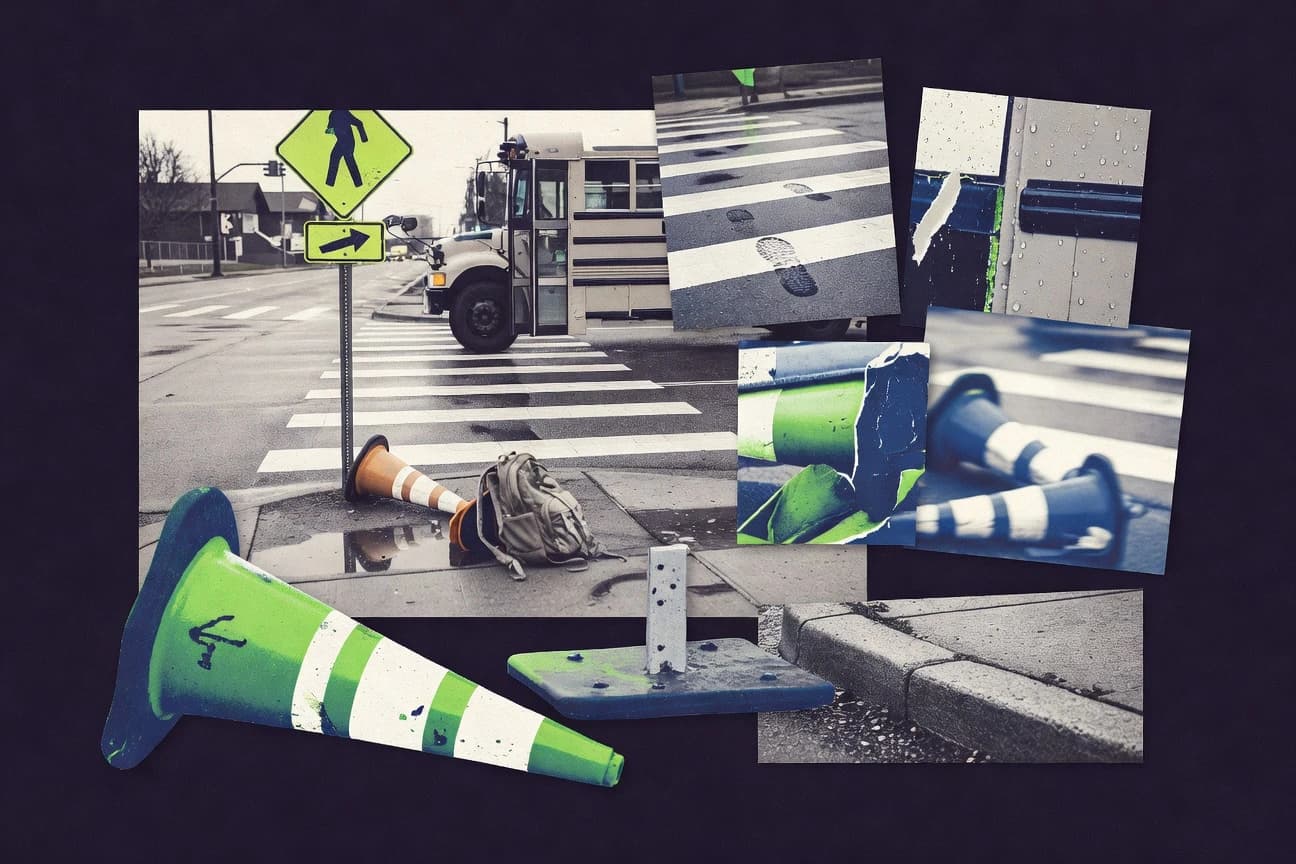
School Zone Accident Statistics
School Zone Accident is built around 2022 findings that still feel urgent, from speeding driving 78% of fatal school zone crashes to distracted driving contributing to 34% of incidents. You will also see where risk clusters by time and behavior, including 1,234 child injuries linked to UK 20 mph enforcement changes and NYC’s 78% of crashes happening at dismissal, so you can separate fear from actionable patterns.

Lithium-Ion Battery Fire Statistics
Short circuits and overcharging can kick off lithium ion thermal runaway with startling efficiency, with manufacturing defects driving 28 percent of fires and overcharging behind 35 percent of initiations. You will also see why heat, damage, and propagation matter in practice, including Sandia’s finding that once one cell runs away it can spread to 80 percent of a pack within 60 seconds at 300°C, and how real world incidents and suppression limits translate those mechanisms into injuries, losses, and prevention.

Motorcycle Danger Statistics
Motorcycle danger is not just higher risk, it is concentrated. In 2021, 83% of crashes left the rider hurt or dead and nighttime crashes were 3 times deadlier per mile, while alcohol-impaired riders and intersection collisions quietly drove a large share of fatal outcomes.
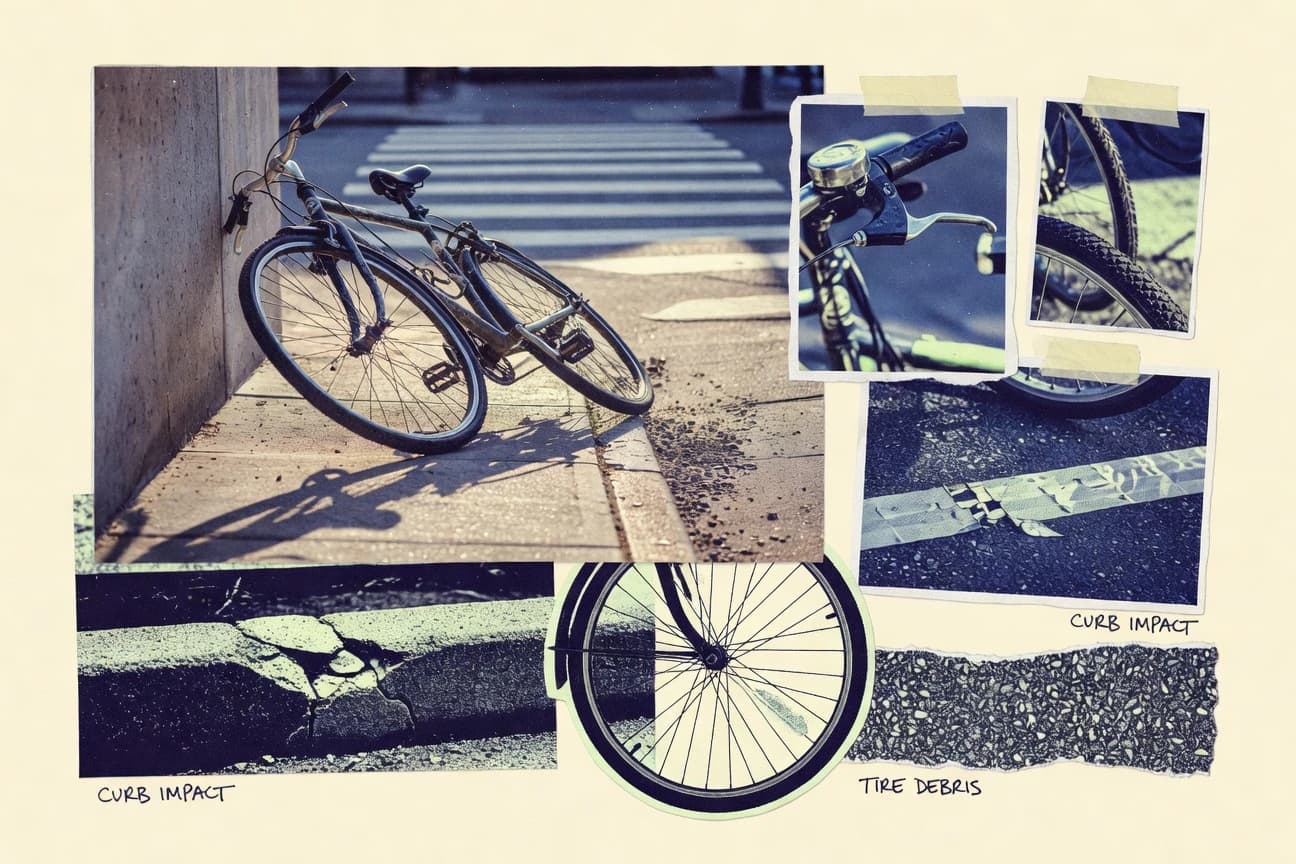
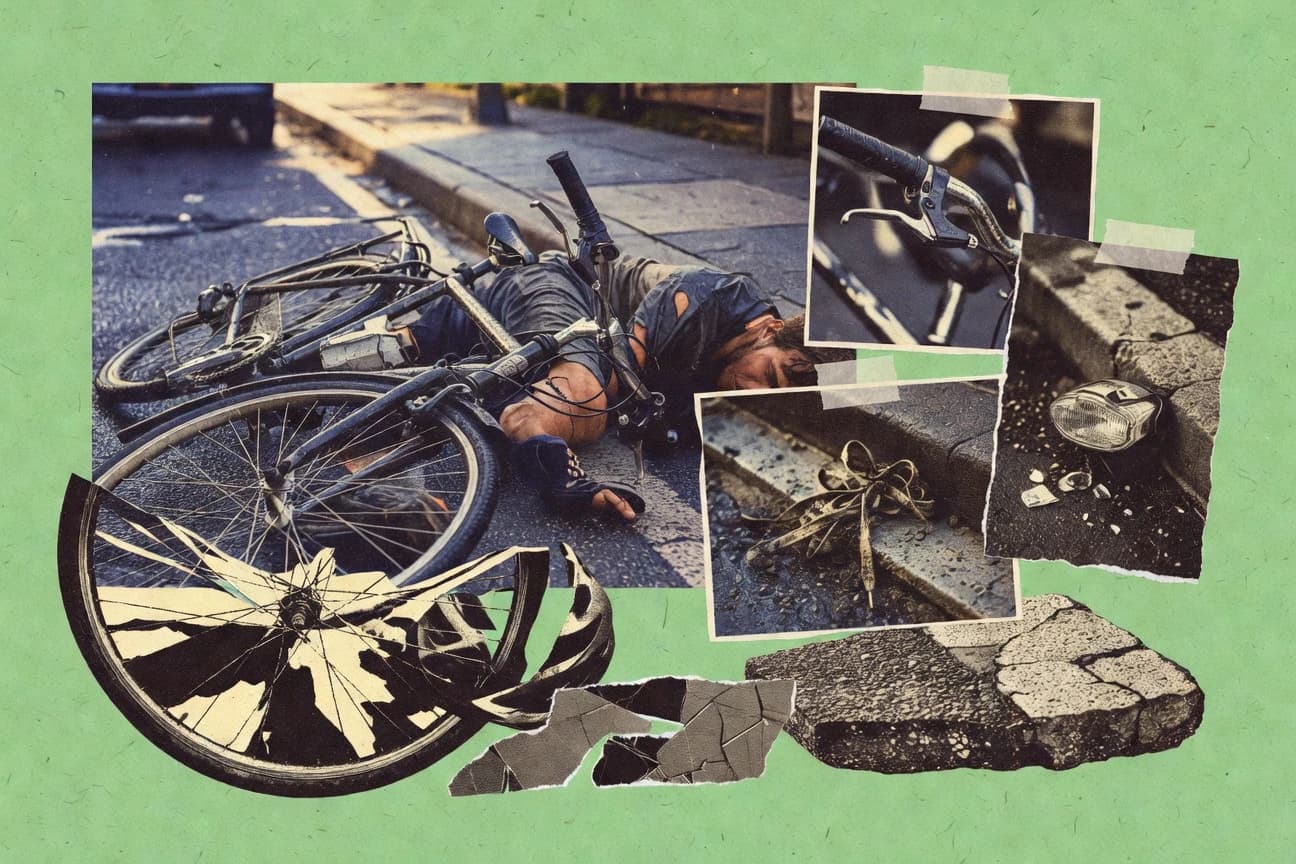
Bicycle Accident Statistics
Night after dark drives a disproportionate share of harm, from no lights or reflectors in 60% of dark-condition fatalities to nighttime conditions contributing to 40% of US cyclist deaths. At the same time, the crash pattern shifts fast once vehicles enter the story, with intersection left turns behind 40% of US cyclist fatalities and driver failure to yield driving 52% of bike motor vehicle crashes, plus newer safety countermeasures like protected intersections cutting crashes by 28% and cycle tracks reducing fatality risk by 89% compared with parallel roads.
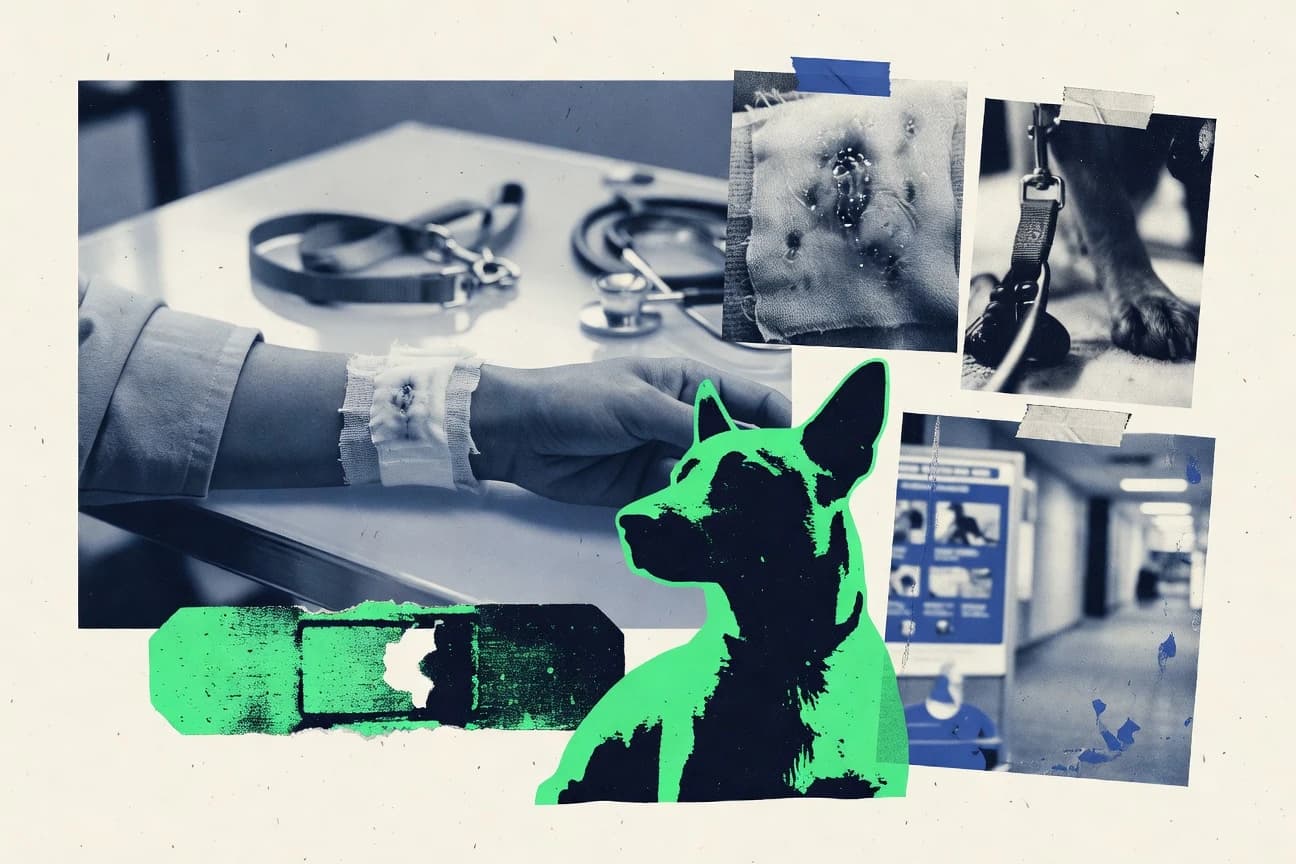
Dog Bite Injury Statistics
US emergency departments treated 393,000-plus dog bite injuries and the US incidence rate sits at 12.9 per 10,000 people each year, yet one in ten of those seeking medical attention ends up hospitalized. The page also traces how rabies risk, seasonal spikes, and breed and community factors shape outcomes worldwide so you can understand what drives serious harm and what reduces it.

Escalator Injuries Statistics
Phone distraction and sudden stops are only part of the picture, because slips and falls drove 65% of US escalator injuries in the most recent U.S. reporting. You will also see the surprising mismatch between what causes the most incidents and what leads to the most serious outcomes, plus global cost and hospitalization figures from recent WHO and regional data.
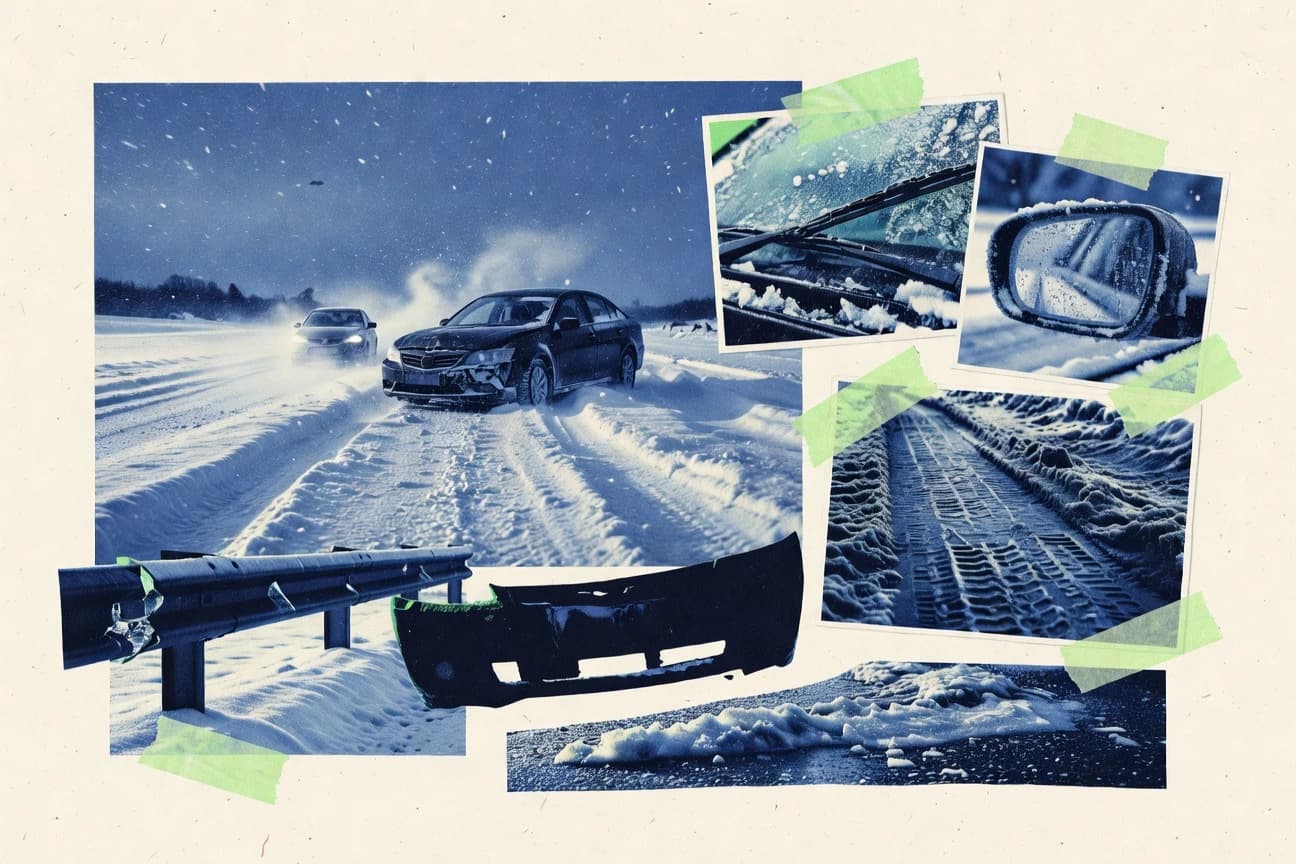
Winter Driving Accident Statistics
Speeding on ice and freezing conditions are showing up in stark, measurable ways, from 542,000 US crashes tied to icy roads in 2021 to 2022 winters to 18% of Canadian winter injuries linked to loss of control on slippery surfaces. If you think weather is the whole story, these pages also track how factors like tires, salting, vehicle setup, and driver risk shift outcomes across the US, Canada, UK, Germany, Scandinavia, Australia, and Japan.

Natural Gas Explosion Statistics
PHMSA analysis links excavation line-location mistakes to 32% of distribution explosions each year and corrosions to 22% in underground pipelines, while third-party construction damage drives 41% of transmission pipeline explosions. Follow the chain of causes that can scale from a small leaking service line to billion-dollar disasters, including $3.4 billion in property damage from incidents since 2010 through 2020.
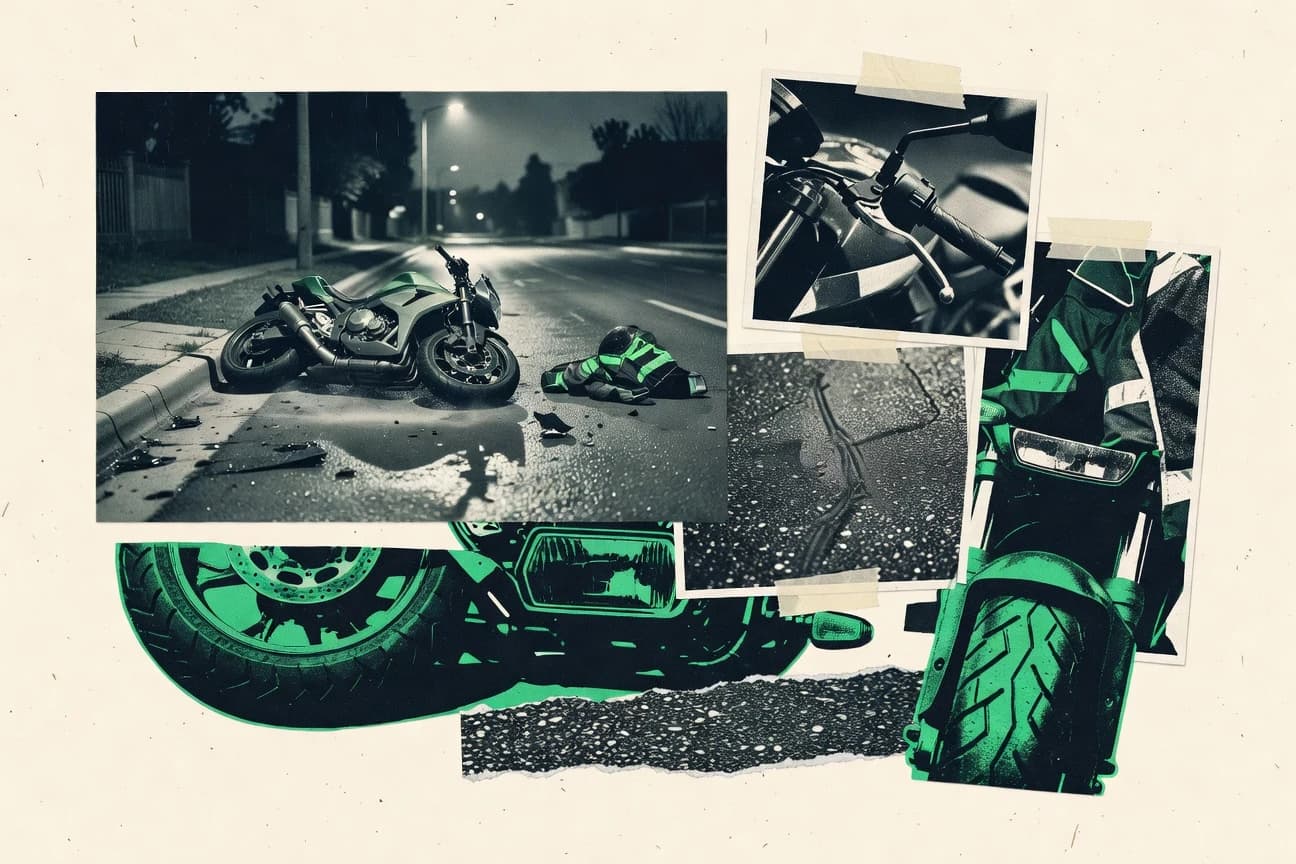
Motorcycle Accident Statistics
Even when speeds and road conditions look “normal,” motorcycles are still disproportionately vulnerable, with 33% of fatal rider deaths tied to excessive speed and 30% of rider fatalities involving alcohol impairment in 2021. You will also see how helmet use and everyday interactions behind the wheel change outcomes, including 82% of riders killed in 2020 being unhelmeted and left turns by other drivers driving 27% of multi vehicle crashes.

Teen Driving Statistics
Distracted teen driving still claims lives at a staggering pace, including 30% of teen fatal crashes in 2021 and cases where texting or phone use shows up in 94% of those deadly distracted crashes. Then there is the other half of the pattern you may not expect, with enforcement, GDL, and hands free laws shown to reduce fatal risk while teens still report frequent phone and social media distraction every week.
Bike Accident Statistics
Even as US helmet use reaches 43% among injured cyclists in 2022, the risk drivers stay stubbornly specific, from alcohol impairment tied to 28% of cyclist deaths to nighttime riding behind 50% of fatalities on just 15% of trips. This page stitches together how intersection turns, distracted driving, and infrastructure gaps like missing bike lanes shape outcomes across the US, Europe, and beyond, so you can see what actually changes safety and what still keeps the odds stacked.

Electric Scooter Safety Statistics
Even with helmet laws and better infrastructure, 1 in 100 e-scooter trips still ends in a crash that needs medical attention, while 97% of injured riders report never wearing a helmet consistently. You will see why the risk spikes around real-world hazards like potholes, poor lighting, and speeding, plus what protections actually cut injuries and how congestion, parking design, and rider behavior stack up city by city.

Grill Brush Injury Statistics
Despite a 55% reduction in injuries after the 2015 CPSC awareness push, grill brush bristles still drove 1,120 coded injuries in NEISS 2021, and the underlying U.S. toll reaches 10,000 plus cases annually when underreporting is accounted for. This page pulls together the sharp peaks, migration related complications, and the real-world shifts toward bristle free tools so you can see exactly what changed and what still puts people at risk.

Bus Accident Statistics
With driver error driving 42% of US bus crashes in 2021 and speeding linked to 30% of global bus fatalities per WHO 2023, the page puts responsibility and risk side by side. It also tracks how injuries and deaths shift by age and setting, with females making up 55% of pedestrian related bus injuries in South Africa 2021, so you can see which warning signs matter most and where enforcement can change outcomes fast.
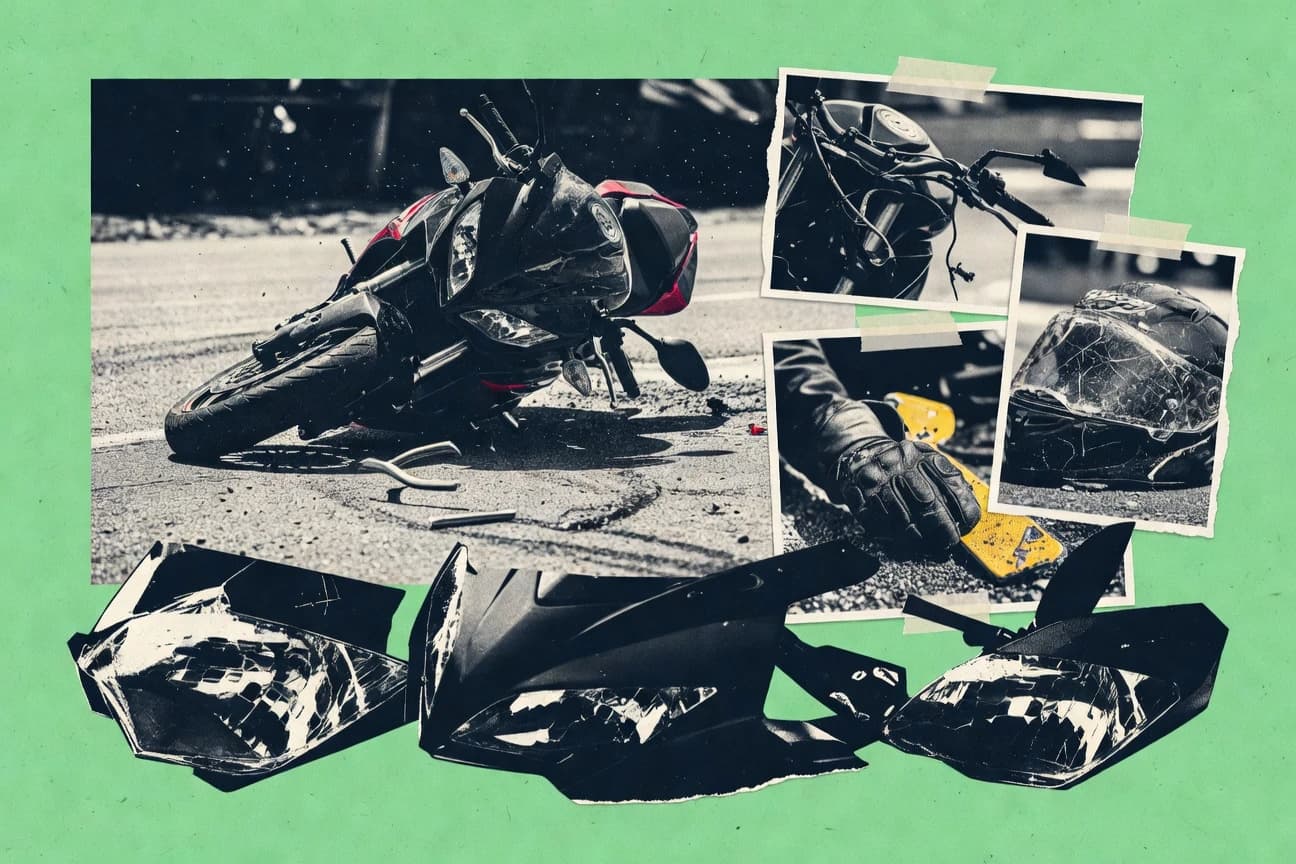
Motorcycle Wreck Statistics
Last year, 5,932 motorcyclists were killed on U.S. roads, and the risk gap is brutal, with motorcycle death rates per mile 25.12 times higher than passenger car occupants in 2021. From left turning errors driving 42 percent of multi vehicle collisions to rider behavior like speeding at 33 percent in 2021 and helmet nonuse still linked to preventable deaths, this page pinpoints what is most likely to go wrong so you can spot the patterns before they hit.