GITNUX MARKETDATA
Browse Our Category
Mental Health Psychology
Latest update:


Mental Health In College Students Statistics
Newer findings paint a stark tradeoff between mental health and academics, where anxious or depressed students are far more likely to fall behind, miss class, or risk dropping out, and therapy access starts to move the GPA needle. This page connects campus reality with concrete rates, from 44% screening positive for moderate to severe depression to 65% reporting they delay getting help until it is close to a crisis, so you can see what is driving outcomes and what could realistically change them.

Ems Mental Health Statistics
While 7.8% of U.S. adults reported a major depressive episode in 2021, today 82.8 million people in the United States are already using teletherapy and mental health apps, and 40% of outpatient behavioral health visits still happen through telehealth. This Ems Mental Health page connects the clinical need with the operational and adoption metrics, from first response times in crisis texting to the global scale of mental disorders and the cost burden behind it all.

Adolescent Suicide Statistics
One in four adolescents who attempt suicide will repeat within a year, even though crisis pathways like the 988 Suicide and Crisis Lifeline logged over 5 million contacts in 2023. This page connects the dots across sexual violence, loneliness, treatment gaps, and evidence based prevention so you can see where support works and where it still falls short.

Stress In Students Statistics
Student stress is now a mainstream experience, with 70.0% of first-year university students reporting they felt stressed during the term, yet the same research base shows huge gaps in relief, from 52% of students struggling to access support to high needs that do not reliably turn into treatment. This page brings those tensions together across school, university, and clinical training, so you can see what stress really looks like, what drives it, and where systems leave students exposed.

Mental Health In Children Statistics
Despite up to 1 in 8 children and young people in England having a mental health disorder in 2022, many families still hit the same wall when they try to get help. This page brings together the most recent U.S., England, and international benchmarks, including who is affected, what care is used or missed, and why long waits and workforce gaps continue to shape outcomes.

Anorexia Nervosa Statistics
Anorexia Nervosa is tied to a mortality rate of 5.9% per decade and an SMR of 5.86, with cardiac arrest responsible for 59% of deaths and suicide driving 20 to 25% of mortality, so the page clarifies why “just” weight loss can become lethal. You will also see the clinical contradictions clinicians watch for, from refeeding syndrome killing 5 to 20% when unmanaged to partial brain gray matter loss around 10% that can improve, alongside long term risks like relapse mortality rising by about 50% and bone damage that can remain irreversible.

Adolescent Substance Use Statistics
One in 5 U.S. adolescents who drank alcohol in the past year reported binge drinking in the past month, while only 23% of teens who needed substance use disorder treatment actually received it in 2021. This page puts risk factors like bullying, depression, and low parental monitoring side by side with the scale of emergency visits and treatment gaps, so you can see both how use starts and why help so often falls short.

Teen Anxiety Statistics
Anxiety can hit quietly but intensely, affecting 8.3% of US adolescents aged 12 to 17 who reported anxiety symptoms in the past week and driving serious functional impairment for 25.1% of youth in the same age group who have a mental health condition. Even with treatment options like CBT and telehealth gaining ground, 57% of teens who need care do not get it and 65% report barriers such as cost and not having nearby providers, leaving a gap that feels bigger than the symptoms themselves.

Aces Statistics
With 2025 grade clarity, this Aces statistics page lays out how 4+ ACEs can multiply risk across health, work, and life, from 7.4 times higher alcoholism odds and 10 times injection drug use risk to 2.8 times emergency department visits and 2 times homelessness. It also turns the cost needle for the U.S., estimating $748 billion in yearly total burden, so the personal trauma link becomes impossible to ignore.

Alcohol Use Disorder Statistics
Alcohol use disorders drive 4.5% of the global burden among young adults 15 to 49, yet in the U.S. about 70% of people with AUD do not receive specialty treatment. You will also see how treatment gaps collide with outcomes, including U.S. alcohol related emergency department visits of 1,260 per 100,000 population and medication results like naltrexone abstinence gains of roughly 17 to 26% across trials.

Panic Statistics
Panic disorder lands in real life fast, with 3% of adults affected over a lifetime in the US and 1.0% reporting it in the past 12 months, yet treatment gaps and misdiagnosis in primary care often delay the specialty care that can cut downstream use. You will see why CBT and SSRIs can change outcomes, alongside the cost and disability signals such as anxiety linked to 2.3% of US disability burden and millions of DALYs worldwide.

Teen Eating Disorder Statistics
What starts as “healthy discipline” can become a relentless routine fast, from 78% of teens with anorexia nervosa exercising excessively each week to ED teens checking their bodies 25.6 times a day on average. This 2025 updated statistics page connects the everyday behaviors behind eating disorders with clear treatment benchmarks, including 50% achieving full recovery within 5 years with care, so you can see both the hidden pressure and the realistic path back.

Stress In Teens Statistics
More than half of U.S. teens say stress hits most days, and when stress rises, anxiety and depression follow at noticeably higher rates, including 1.8 times greater odds of depressive symptoms for students with high stress. This page connects those pressures to real outcomes, from major depressive episodes and dating violence to treatment access and what school based programs can actually move.

Suicide Prevention Statistics
With 988 handling 500,000+ contacts in 2023, you can see in real time how crisis response scales when minutes matter, alongside evidence that follow up contact after discharge can cut suicide attempts. This page links the hardest outcomes to what works, from firearm related shares and youth risk to safety planning and DBT results, so you can spot the patterns that prevent tragedy rather than only measure it.

Student Mental Health Statistics
Nearly 43% of U.S. college students who needed mental health care did not get treatment in the past year, even as crisis services and digital tools are expanding fast. Use the page to spot where access breaks down most, from cost and not knowing where to go to the measurable impact of school pathways, tele-mental health, and campus interventions on anxiety, stress, and getting students help.
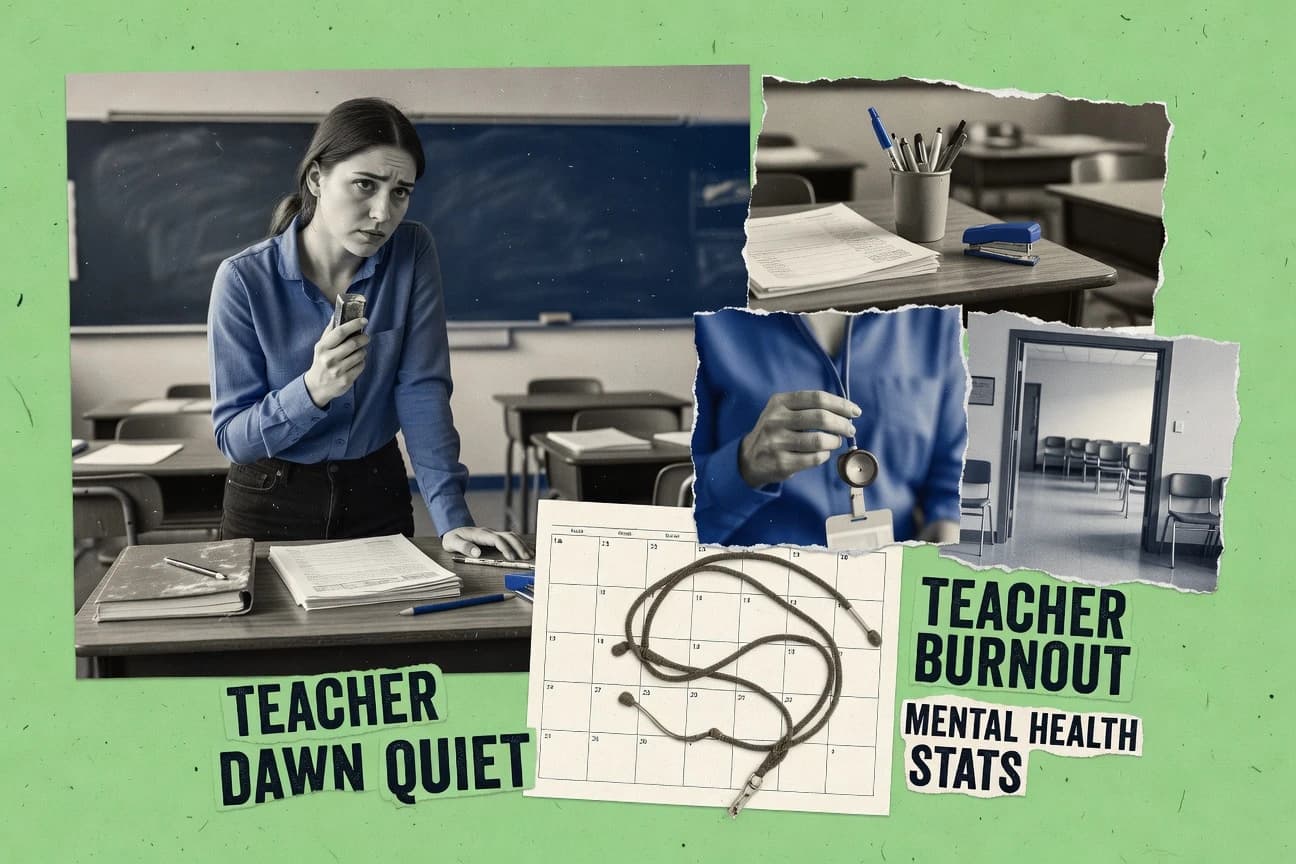
Teachers Mental Health Statistics
Almost half of teachers still report burnout symptoms, while 2025 relevant surveys and studies point to an edge teachers can actually feel right away, from unpaid after-hours work and a 40% jump in digital workload during remote and hybrid teaching to 78% saying students’ mental health needs have risen. This page connects those pressure points to real outcomes such as leave likelihood, turnover intention, and which workplace supports like coaching, peer communities, and CBT informed programs are linked with measurable relief.

Add And Suicide Statistics
ADHD is not just about attention. Suicide death is doubled to nearly 2 times higher in a meta-analysis of 12 studies and completed suicide was 5.79 times higher in a Swedish cohort, while ideation and attempts spike sharply when depression, anxiety, bipolar disorder, substance use, trauma, or untreated symptoms are in the mix.

Comparing Yourself To Others On Social Media Statistics
With 56.4% of the globe using social media in 2024 and 34% of US adults reporting a negative mental health impact, this page zeroes in on how visible metrics like likes and follower counts, plus recommendation algorithms, turn everyday scrolling into upward comparison. You will also see why 1 in 3 users posts mainly for likes or comments and what happens when 13% hide view counts to reduce the pressure.
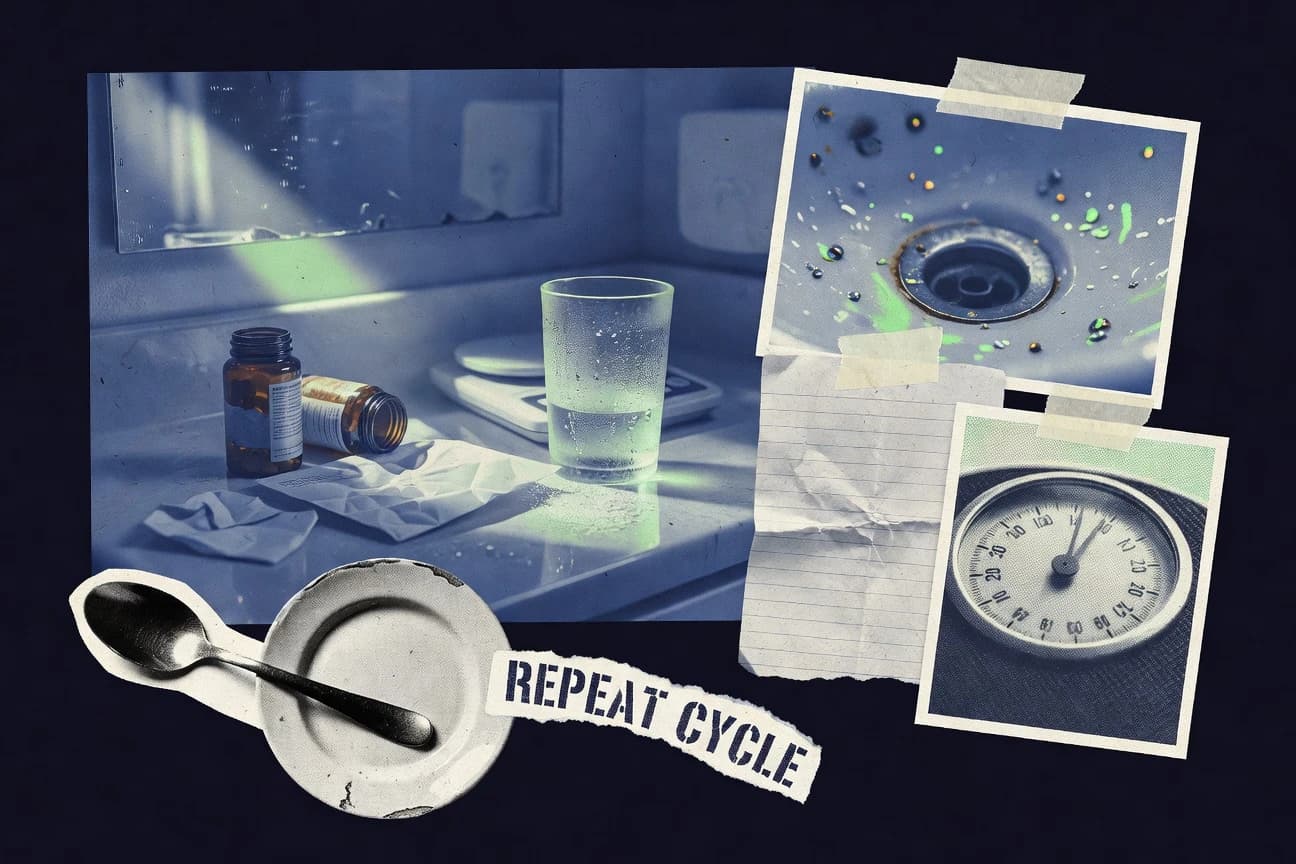
Bulimia Nervosa Statistics
Bulimia nervosa affects about 1.5% of people across their lifetime, but the risk is far from evenly spread, peaking at ages 15 to 24 and appearing in diagnostic thresholds that require binge eating plus compensatory behaviors at least weekly. You will also see why purging is not just a symptom, with clinical episode data showing hypokalemia in 5% of measured episodes, while evidence-based care like CBT can cut binge purge frequency and drive remission in roughly half of patients.

Inner Monologue Statistics
With GPT style systems moving from chat to reflection fast, 52% of workers who use AI do it at least weekly, and 67% of companies are already implementing or planning generative AI use cases. This page connects productivity gains and healthcare and customer service adoption to the hard parts of inner monologue style reliability and safety, from hallucinations and prompt injection to the rules that shape what can be shown.