GITNUX MARKETDATA
Browse Our Category
Equipment Rental Leasing
Latest update:


Korea Rental Car Industry Statistics
See how Korea’s rental car market is shifting fast, with 2025 and 2026 figures that reveal what demand is doing right now, not what it did last year. The page also puts pricing and usage in the same frame, so you can spot where affordability and utilization are moving in opposite directions.
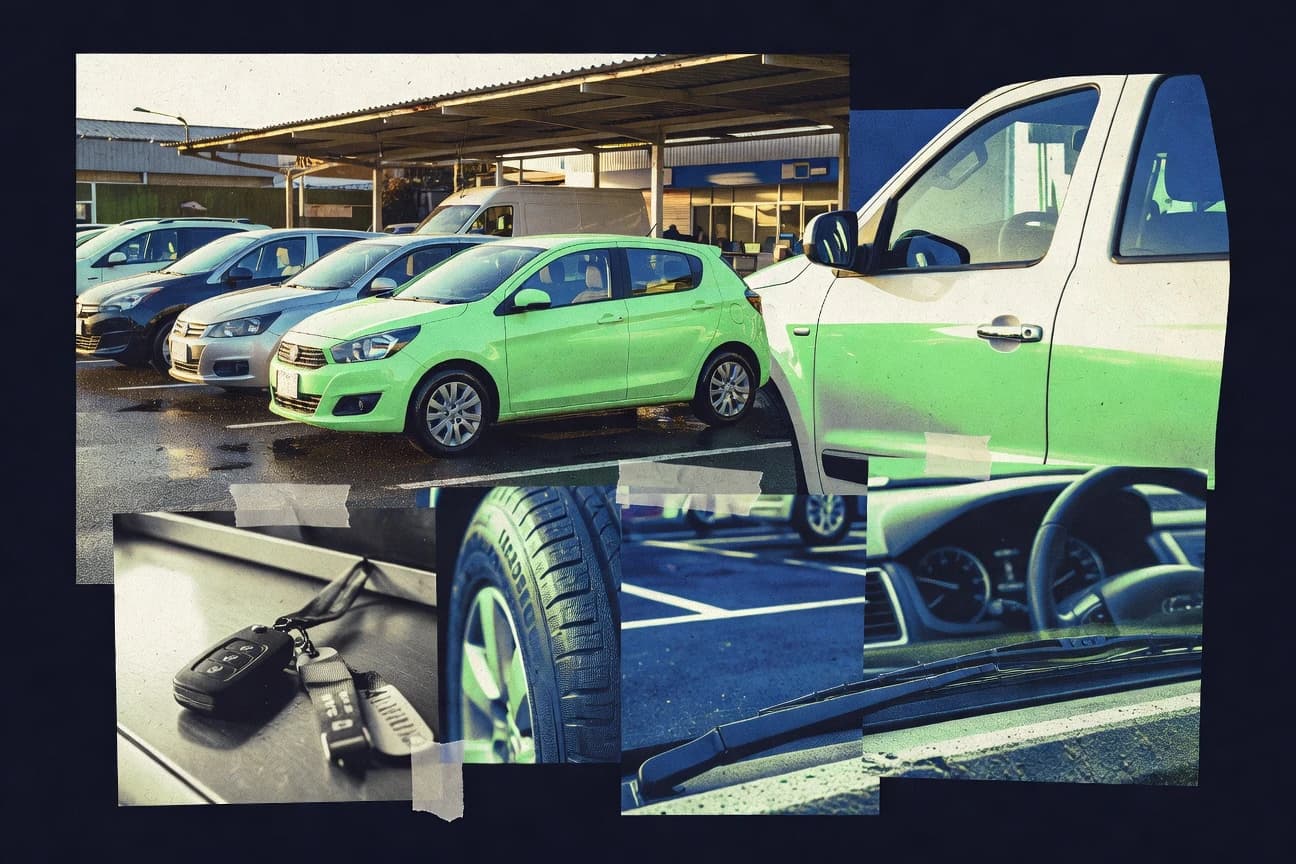
Vehicle Rental Industry Statistics
Pricing pressure hits while demand stays resilient, with the U.S. rental car ADR down 2.4% in Q2 2024 versus Q2 2023, even as 79% of customers still name easy booking as a top satisfaction driver. Track how operators fund growth and risk control, from Enterprise’s $37.9 billion asset base and $14.6 billion in 2023 fleet capex to 2.7 times more fraud attempts blocked through identity verification, plus where EV charging, software upgrades, and repair cost spikes are reshaping the next rental cycle.
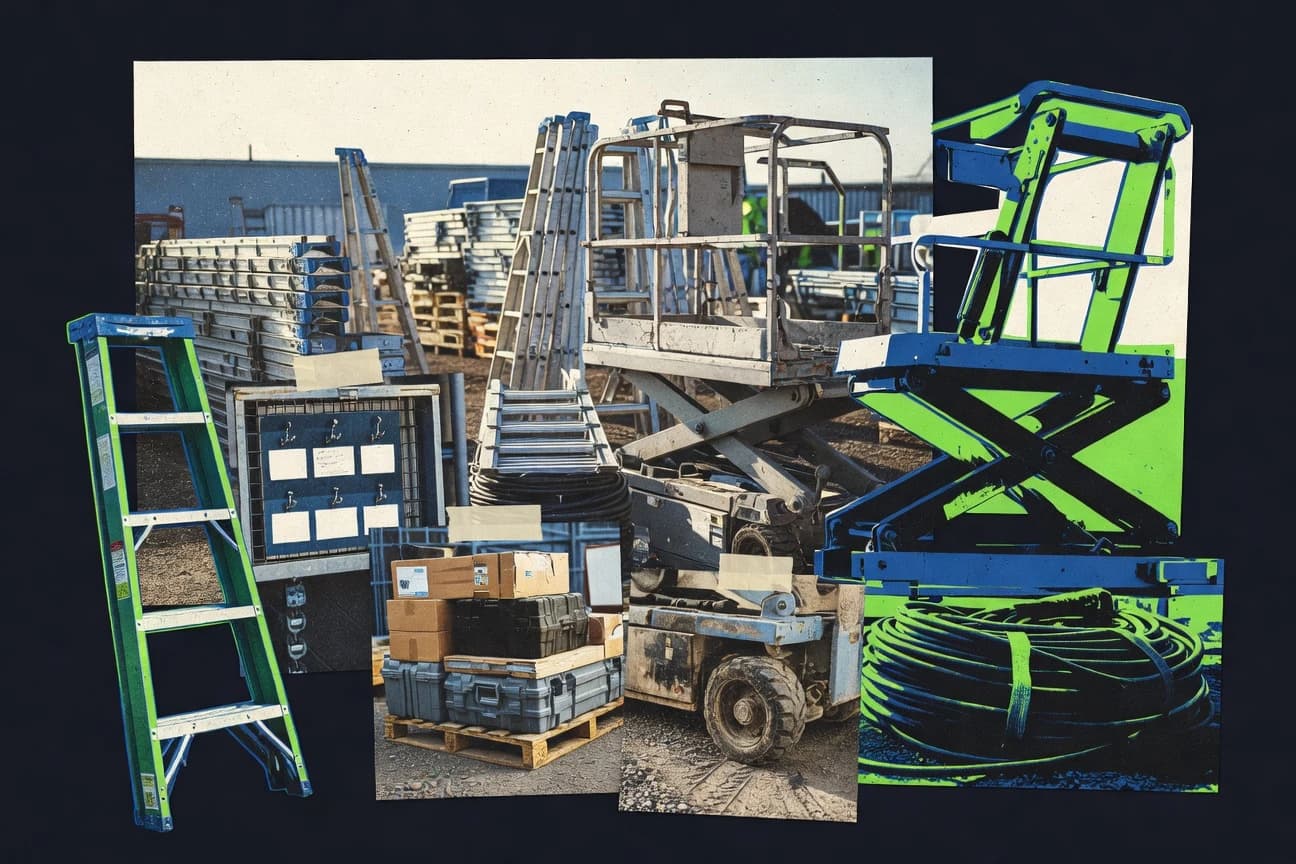
Rental Equipment Industry Statistics
A 2024 to 2032 outlook of 11.0% CAGR for global construction equipment rental growth sits beside a 9.8% jump in US construction spending from 2022 to 2023, so the demand tailwind is clear while cost pressure is not. You will see exactly what keeps rental fleets from running smoother, from insurance at about 5% of operating costs and maintenance and repair as the top expense, to how telematics can cut idle time by 29% and parts tracking can reduce warranty claims by 20%.
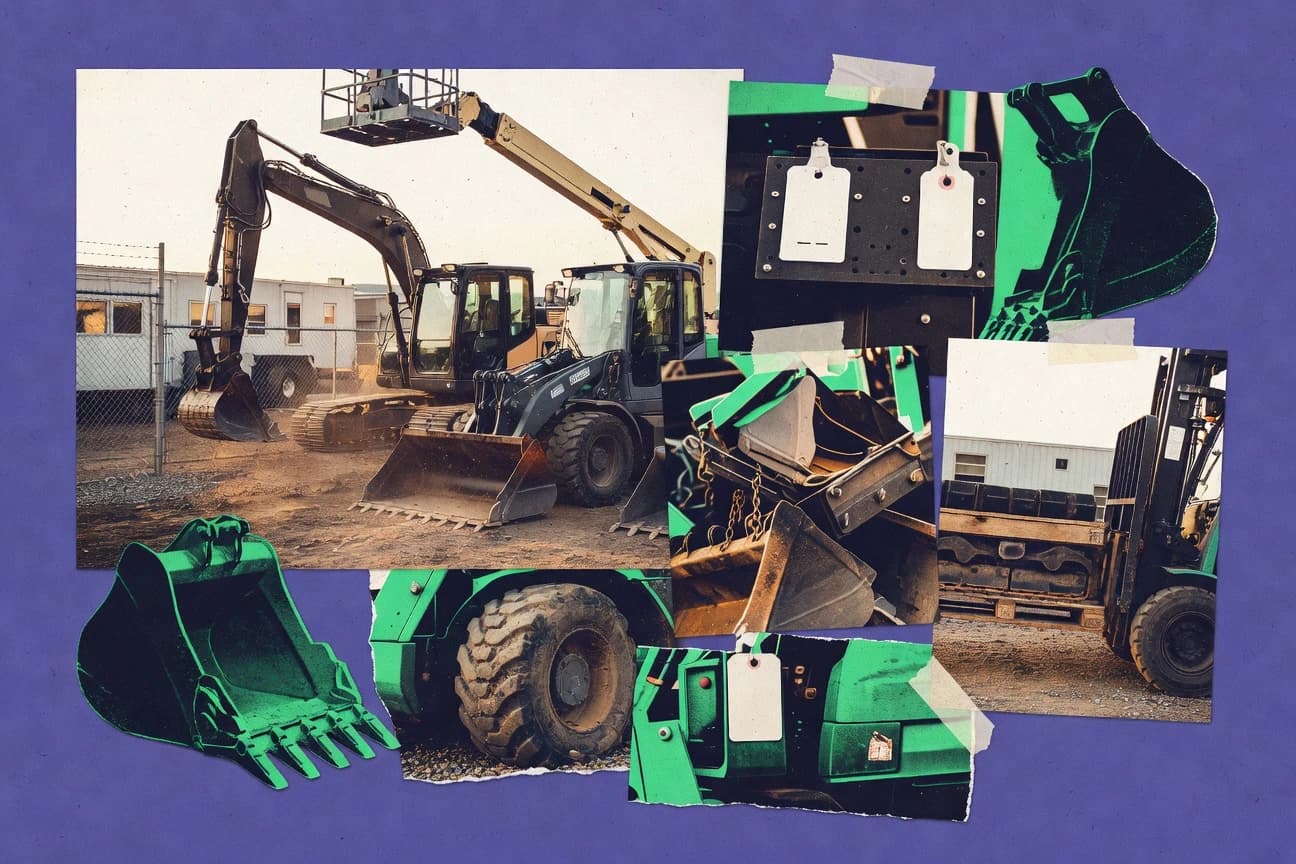
Construction Equipment Rental Industry Statistics
With the US equipment rental and leasing market forecast to reach about $82.5 billion by 2028 and construction spending topping $2.0 trillion in 2024, the page shows how demand, costs, and financing pressure shape rental pricing and margins. It also highlights why telematics and predictive maintenance are turning downtime, lost hours, and uptime percent into measurable profit levers, from fuel driven operating cost swings to the safety and labor constraints that keep fleets ready.
Rental Industry Statistics
With the U.S. average rent up to $1,721 per month in 2023 and the vacancy picture tightening, this page explains why renters are moving less, but paying more, and how trends like pet ownership at 59% and app based payments at 62% are reshaping leasing decisions. You will also see what happens next, from forecasted 3.1% annual rent growth through 2027 to PropTech investment heading toward $25 billion by 2025.

Rental Truck Industry Statistics
One part do it yourself moving culture and one part business logistics, today’s rental truck demand still leans heavily household moves at 62 percent even as corporate repeat usage stacks up, with commercial clients averaging 15 rentals per year. If you want the most actionable tension, the same market that books 70 percent online also depends on a shrinking share of older renters, while operational benchmarks like 72 percent U S truck utilization and a 92 percent JD Power satisfaction score show what separates everyday demand from top performing operators.
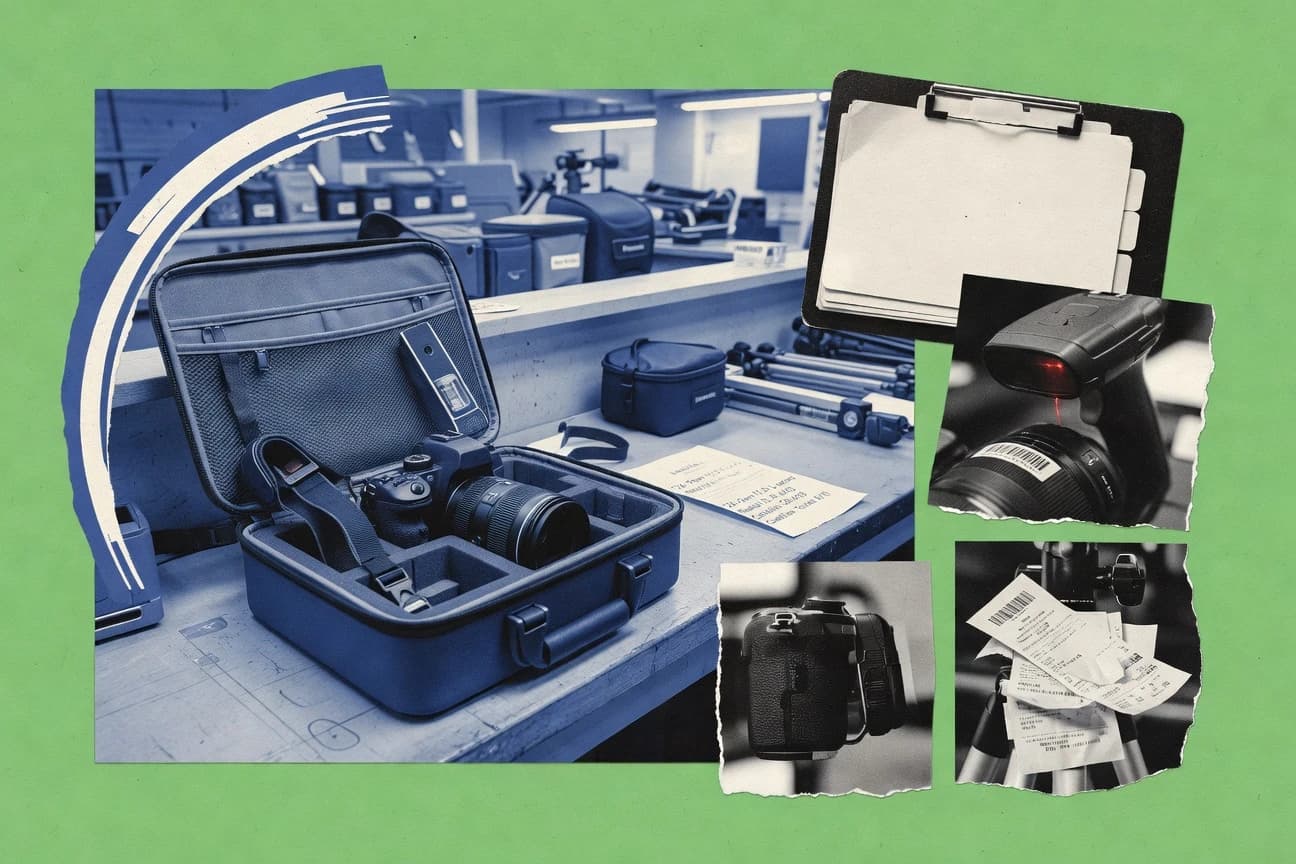
Camera Rental Industry Statistics
What drives demand for high end gear is shifting fast, with online platforms already capturing 55% of global market share and loyalty members averaging 7 rentals a year versus 2 for non members. You will also see where value is truly created across regions and segments, including the U.S. generating about $450 million in revenue and the camera rental market forecast to reach $3.2 billion by 2028.

Vacuum Truck Industry Statistics
With the global vacuum trucks market forecast at $1.5 billion for 2024 and wastewater and industrial services projected to keep expanding, this page links demand drivers like sanitation and odor reducing transfer methods to the real compliance and safety constraints fleets face under OSHA confined space rules and hazardous waste manifest requirements. You will also see how cost pressures like diesel volatility and measurable performance gains from optimized suction and enclosed transfer translate into practical planning for field teams.
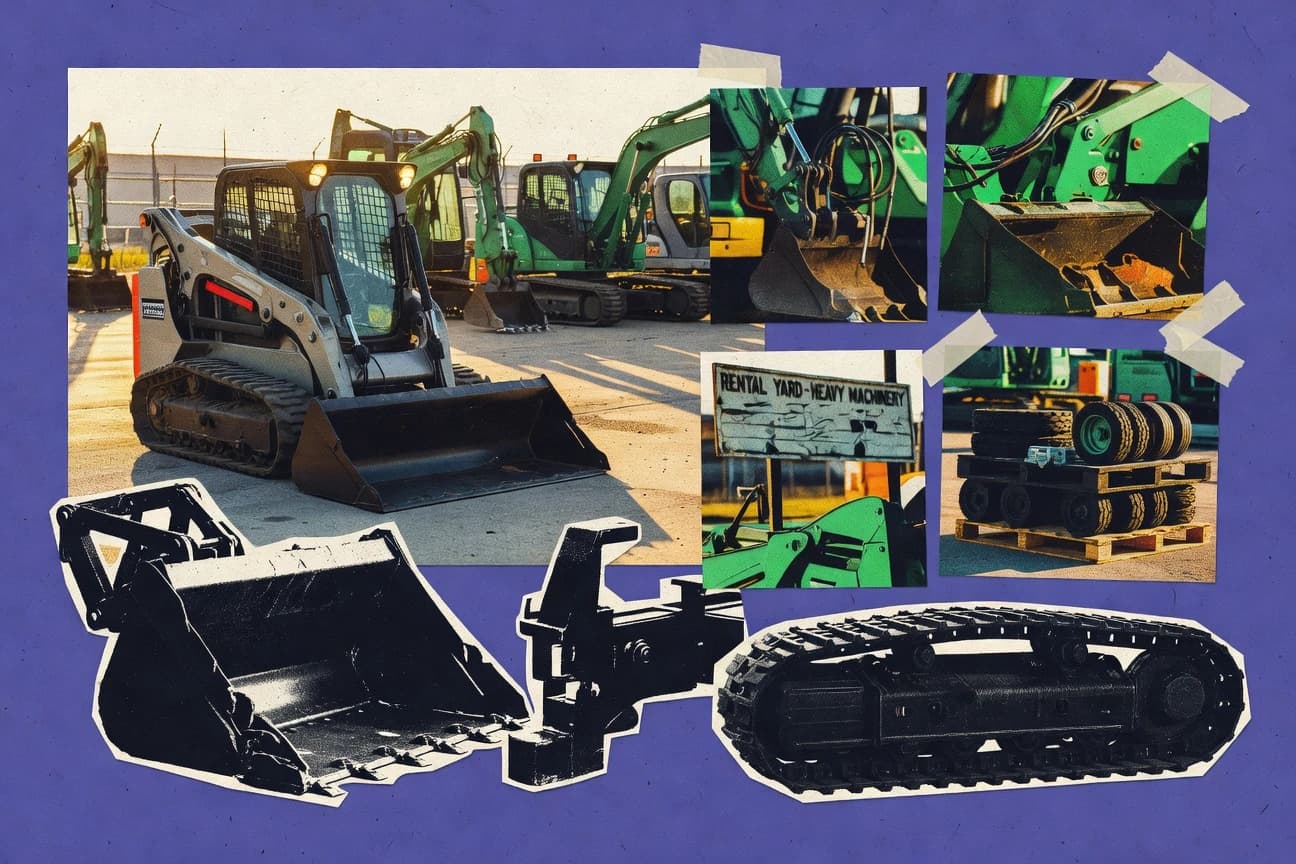
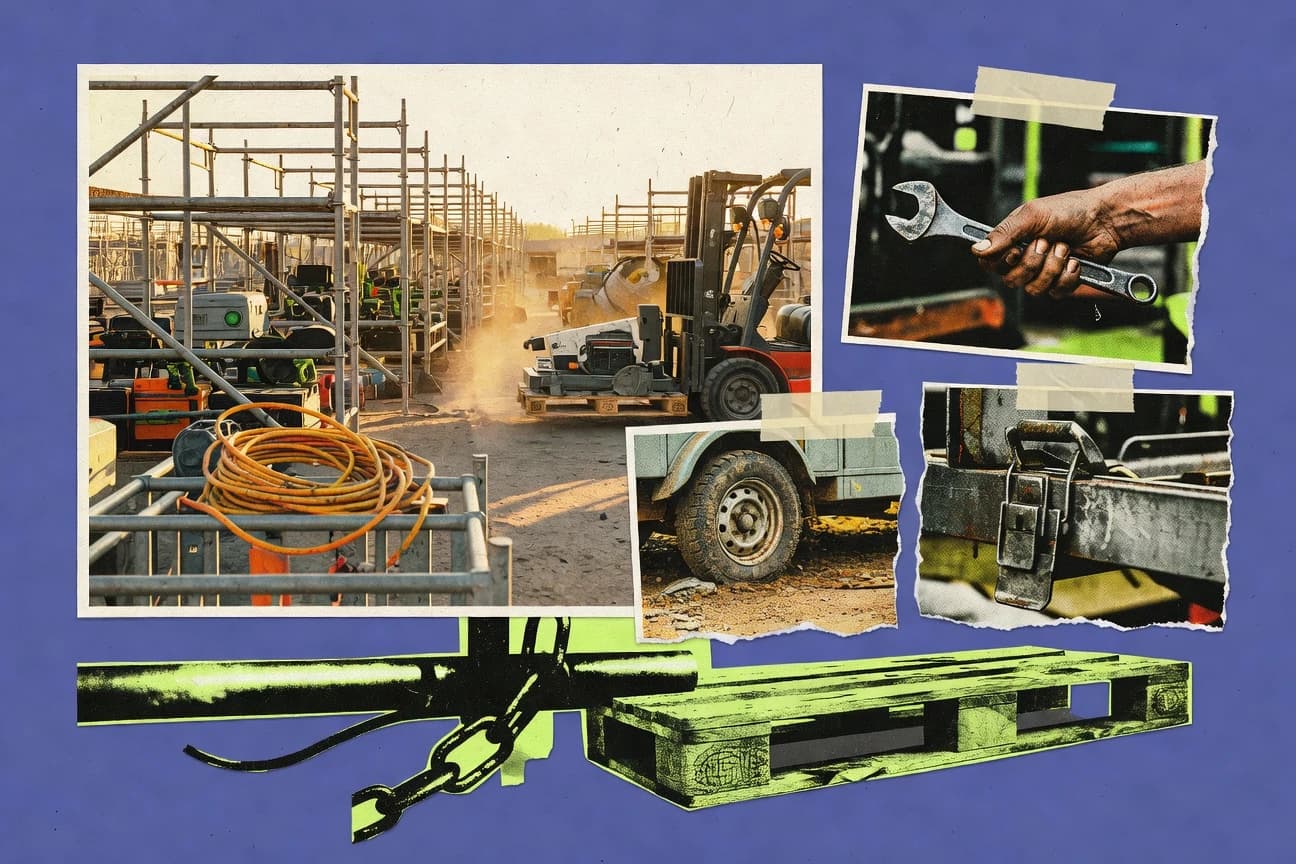
Heavy Equipment Rental Industry Statistics
With 8.3% projected global growth in the construction equipment rental market from 2024 to 2032, the page connects that demand with the cost squeeze renters feel firsthand through 10.2% diesel fuel price jumps in 2024 and the 7.3% machinery rental price index rise. It also quantifies how fleet uptime improvements, telematics, and safety performance can turn pressure into profit, including 1.8x faster onboarding and the practical benchmark of 98.5% on time delivery.
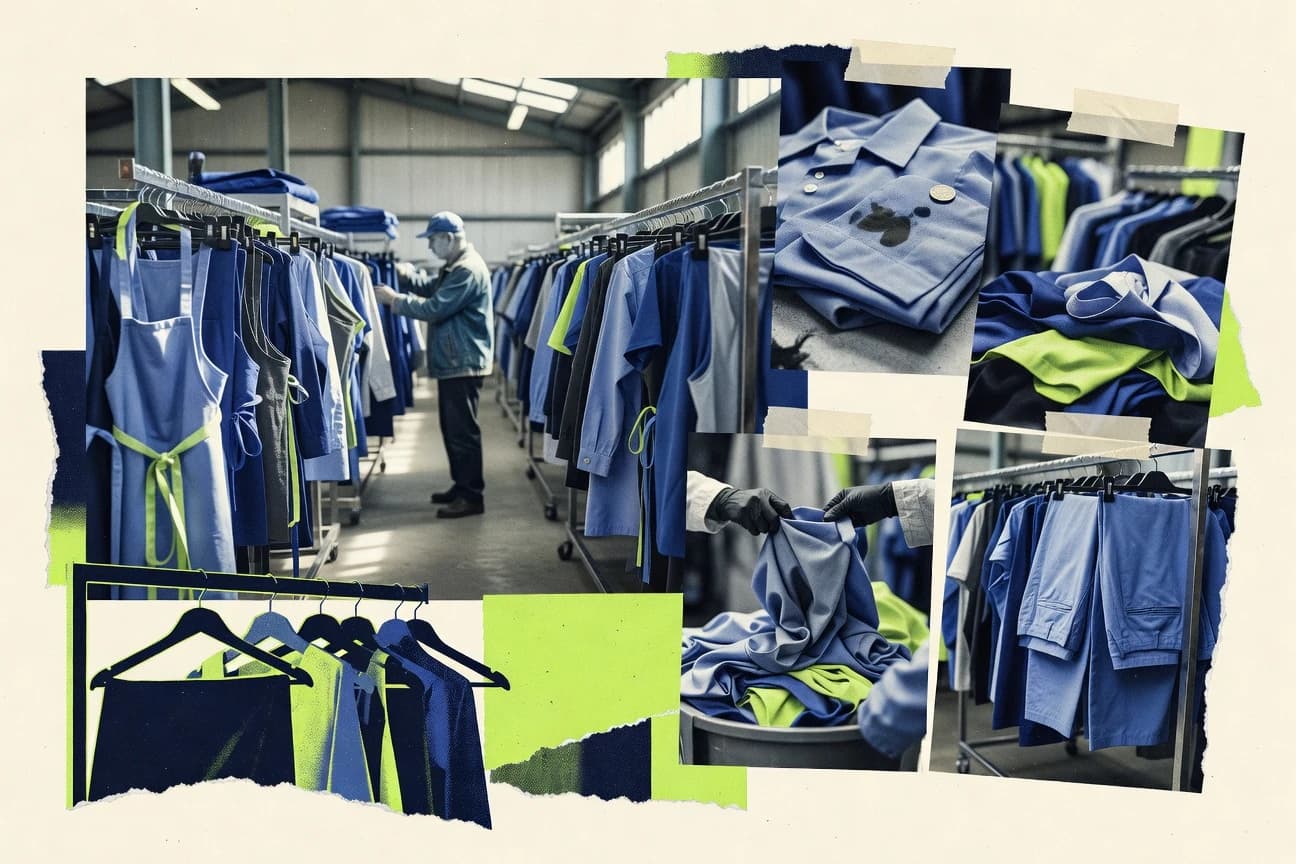
Uniform Rental Industry Statistics
Even with 2024 inflation averaging 3.4 percent and higher producer prices for transportation and warehousing, the uniform and industrial laundry rental ecosystem still drives measurable scale, with $1.2 billion in industrial uniforms rental revenue in 2023 and global industrial laundry services projected to grow 3.2 percent annually from 2024 to 2030. What’s more, 51 percent of organizations have adopted AI and 38 percent use RFID for asset visibility, creating a sharp contrast between tighter operating costs and the push for smarter tracking, hygiene performance testing, and durability that keeps rental garments in circulation.
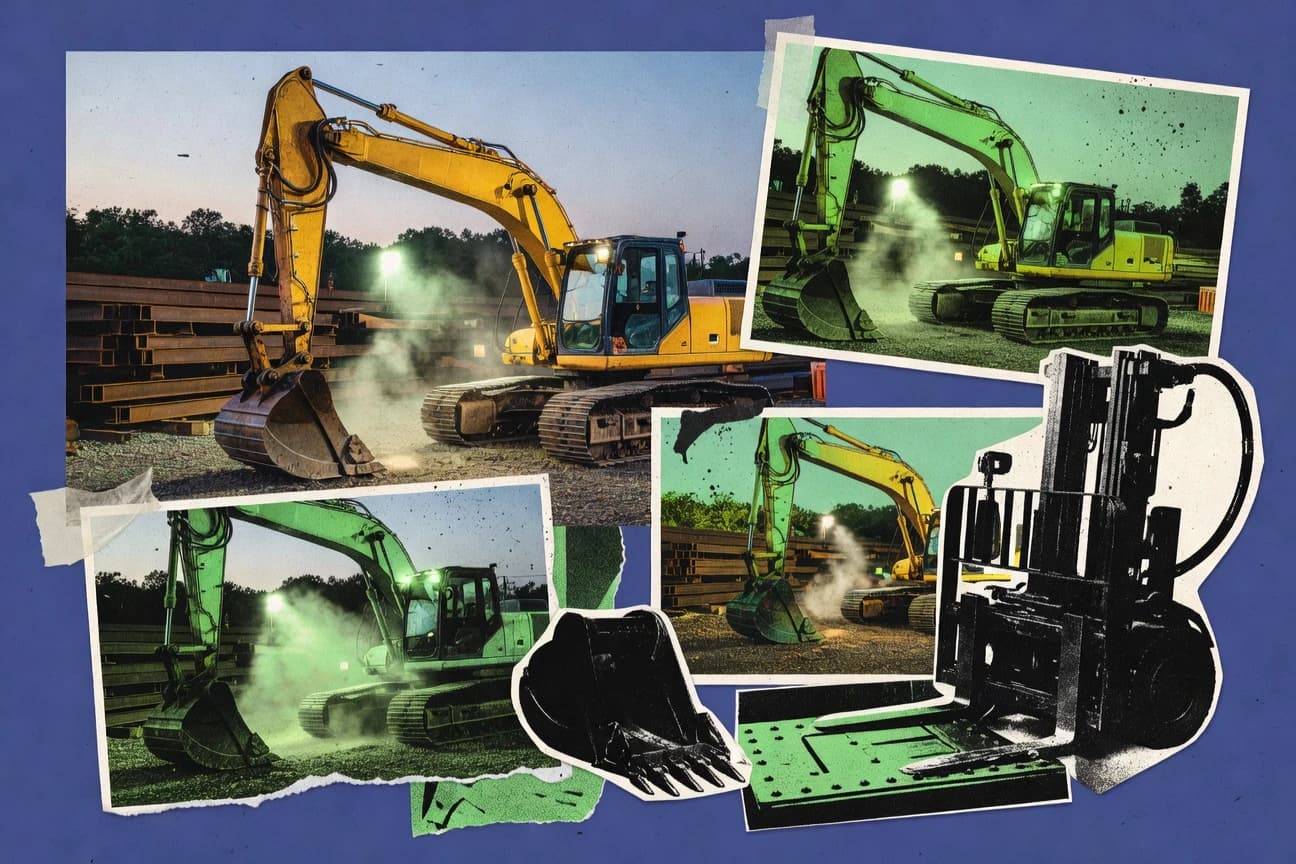
Heavy Equipment Industry Statistics
Construction spending is surging with $1.85 trillion in the US for 2024, yet equipment buyers are still battling cost swings driven by steel and fuel plus real downtime losses tied to maintenance, all while the market is projected to grow to $239.5 billion for construction equipment by 2030 and push electrification and cleaner emissions under Stage V and EU nonroad rules. This page connects those pressure points with concrete benchmarks like 18% of manufacturer exports going to the US and predictive maintenance cutting costs by 20 to 40 percent, so you can see where margins and machine uptime are most likely to get squeezed or protected.

Crane Rental Industry Statistics
Get the latest crane rental industry numbers showing how demand and pricing are shifting in 2025, including where big projects are tightening schedules and where operators are seeing faster turnaround pay off. It is a useful read for anyone who needs to forecast rental costs and availability without guessing what changed last year.
Equipment Rental Industry Statistics
Equipment rental is getting reshaped by 2025 cost and utilization pressures, and the gap between what fleets spend and what jobs actually need is widening in ways operators can’t ignore. This page pulls the most current signals on demand, pricing, and capacity so you can spot where the next rental opportunity or margin squeeze will hit first.

Linen Rental Industry Statistics
See how linen rental pricing, demand, and cost pressures are shifting in 2025 and why 2026 forecasts suggest a faster turnover than many operators planned for. If you run or support rentals, this page turns the latest performance figures into practical signals for forecasting, staffing, and supplier decisions.

Party Rental Industry Statistics
See how party rental demand is holding steady as 2025 forecasting points to continued growth, even while service costs and labor pressure quietly reshape what customers actually book. If you run events or supply rentals, these Party Rental Industry statistics will help you spot where budgets are tightening and where customers are still splurging.
Tool Rental Industry Statistics
Rental operators face a double edge right now: construction is still pulling 12.4% higher versus last year, yet the cost stack is tightening with 3.8% construction material inflation, 2.3% higher diesel, and 9.2% jumps in equipment sales plus 5.0% used equipment price pressure, which helps explain why 58% rely on telematics and 30 to 40% cut inspection time with digital checklists. This page connects demand, pricing, and fleet management with benchmarks like 2.2 million construction trades self employed and the 30 to 40% invoice disputes tied to billing, so you can see where utilization wins and margin leaks are most likely.

Japan Rental Car Industry Statistics
Japan is forecasting a 2.0% inflation rate in 2025 that could reshape rental demand, pricing, and labor costs, while an aging society with 29.1% of people aged 65+ in 2023 reshifts what travelers expect from access and vehicles. At the same time, a fragmented market of 9,000+ registered rental companies meets a fast mobile booking shift where 1.5x growth from 2020 to 2023 in travel mobile share and 60.0% smartphone booking habits make digital rentals and self drive demand far harder to ignore, especially as electrified cars are rising through 24.5% of new sales and supply readiness with 2.7 million EVs on the road by late 2023.
Leasing Industry Statistics
Leasing Industry numbers for 2026 set a sharper bar than the last cycle, with fleet demand and financing behavior shifting in ways that change what deals look like on paper. Get the key statistics that explain where lessees are leaning now and why the next wave of pricing and approvals may not mirror the past.
Trailer Rental Industry Statistics
See how Trailer Rental Industry demand is reshaping in 2025, with day rates and occupancy moving in opposite directions that can surprise even seasoned renters. This page breaks down the latest pricing pressure and utilization trends so you can spot where value is rising fast and where it is quietly slipping.
Truck Rental Industry Statistics
See how truck rental demand and pricing pressures are shifting fast, including a 2026 snapshot that highlights what fleets and independent renters are paying attention to right now. You will also find the contrast between utilization and cost signals so you can spot when “more trucks” no longer means “better deals.”