GITNUX MARKETDATA
Browse Our Category
Electronics And Gadgets
Latest update:


Audio Hi-Fi Industry Statistics
Audio Hi Fi Industry numbers are shifting in 2025, with key market and consumer signals that look very different from the patterns most people still expect. Read the page to see where demand and adoption moved and what that change suggests for the next wave of Hi Fi product decisions.

Professional Audio Industry Statistics
With live sound projected to grow at an 8.4% CAGR and public address systems climbing at a 12.0% CAGR, this page puts the fastest category momentum next to the everyday engineering reality of low latency, synchronization targets, and loudness standards that keep mixes consistent across delivery. You will also see why 38% of pro audio users are pushing for low latency monitoring and how measurement and compliance requirements from IEEE 1588 to IEC 61672 shape what performers hear and what companies can ship.

Silicon Carbide Industry Statistics
Track how Silicon Carbide industry momentum is moving from early-stage adoption to measurable industrial scale, with the latest 2025 and 2026 benchmarks that separate hype from hardware reality. You will see where growth is accelerating and where bottlenecks are still pinching supply, capacity, and downstream demand.

Audio Gear Industry Statistics
What changed fast enough to reshuffle today’s audio gear buying decisions, and where the money actually went? Audio Gear Industry statistics for 2025 and 2026 reveal the sharp contrast between rising demand and shifting price points, so you can separate real momentum from hype before your next purchase or lineup decision.

Wafer Industry Statistics
Wafer Industry keeps its finger on the pulse with 2026 momentum, showing how leading demand is reshaping capacity plans and pricing pressure at the wafer edge. If you think wafer production is steady, these next figures will change your assumption by highlighting where growth is accelerating and where margins are tightening.

Keyboard Industry Statistics
Keyboard Industry numbers keep shifting fast, and the 2026 snapshot is where you see the rebound and the friction points at the same time. Get the key stats behind what’s selling, what’s stalling, and why buyers are changing their buying patterns.

Pro Lighting Industry Statistics
Pro Lighting Industry statistics reveal how smart lighting adoption is shifting from “nice to have” to a mainstream buying driver, with 2026 forecast demand climbing alongside rapid fixture and controls upgrades. See the figures that explain why budgets are moving faster than expected and what that means for manufacturers, integrators, and installers.

Gps Tracking Industry Statistics
With GPS tracking market growth forecast at 30.2% CAGR from 2024 to 2032 and connected vehicles nearing 1.2 billion by 2030, this page weighs the upside of real time location gains against the hardening push from regulators as GNSS jamming, spoofing, and cybersecurity requirements move from edge cases to everyday risk. You will also see how telematics, fleet management, and asset tracking forecasts stack up, while studies link GPS enabled systems to faster lost asset recovery, better inventory and delivery performance, and even measurable emission cuts.
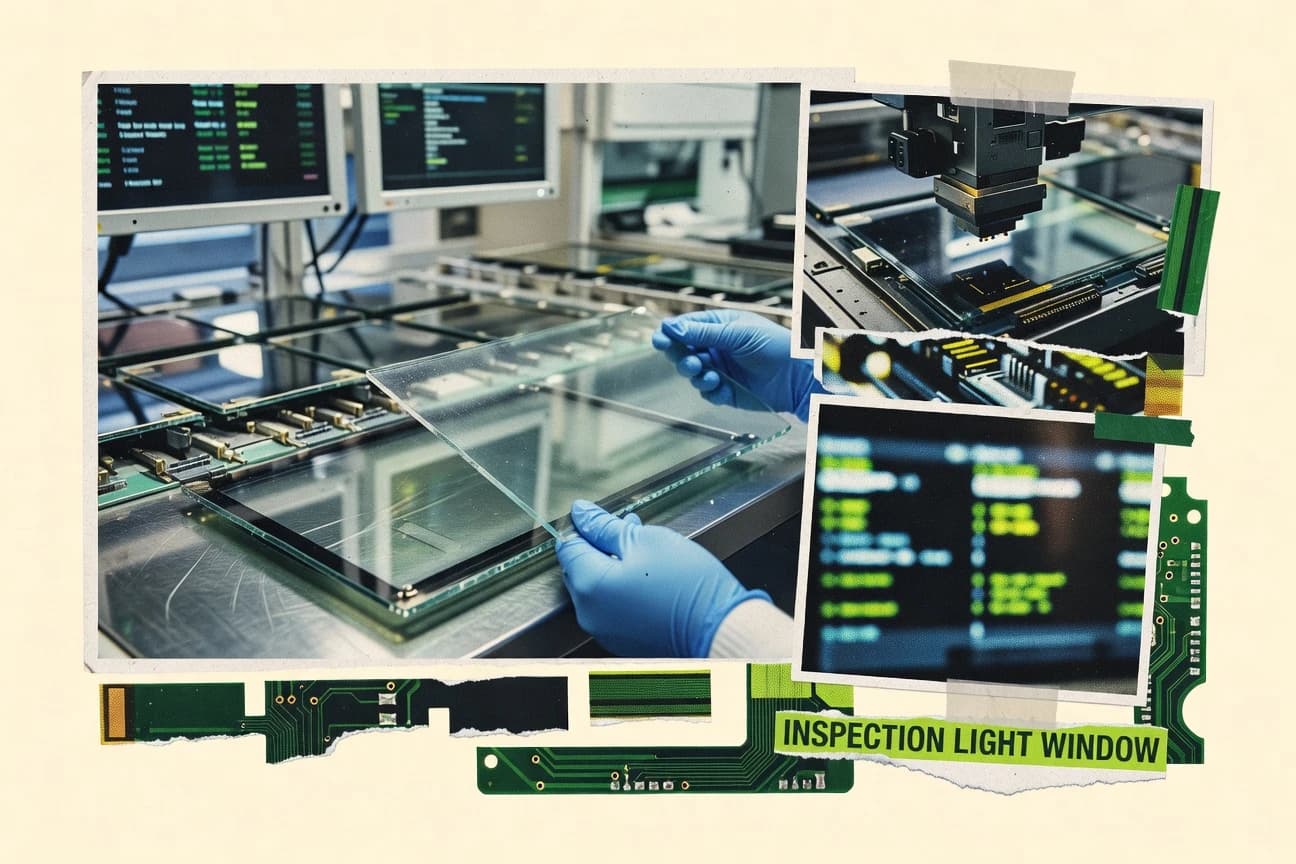
Display Panel Industry Statistics
Display Panel Industry demand in 2025 is moving fast enough to change what manufacturers prioritize, with output and shipments shifting in ways many supply plans are not built for. If you want to understand where market momentum actually landed and what that means for pricing, inventories, and capacity decisions, this page puts the current numbers side by side.

Night Vision Industry Statistics
Projected to reach US$6.2 billion by 2032 while digital night vision and thermal solutions are steadily reshaping adoption, this page pairs performance metrics like 2× to 4× signal to noise gains and stabilized tracking improvements with real procurement signals across defense and law enforcement. You will see how faster helmet mounted growth, rising infrared and night vision contract flow, and lower lifecycle sustainment costs are colliding to push night vision from niche capability to routine operating standard.

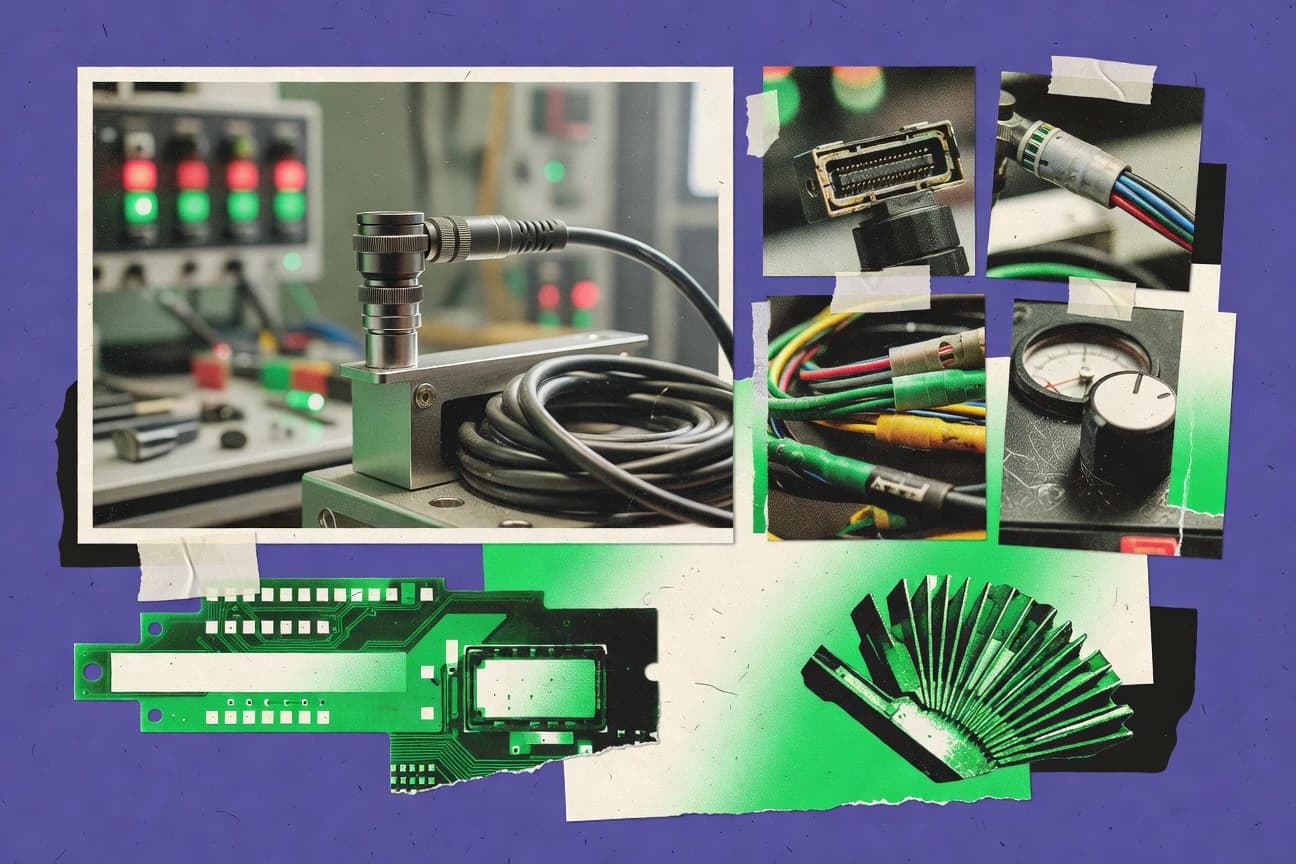
Connector Industry Statistics
Connector Industry charts how demand keeps compounding even as requirements tighten from cybersecurity and IP ratings to data center power and next gen bandwidth, with fiber optic connectors projected to grow at a 6.3 percent CAGR through 2032 and the global connector market at 7.2 percent from 2024 to 2032. You will also see why a 2.5x jump in annual connector production since 2012 to 2020 is only the setup, not the finish, as IoT adoption reaches 44 percent of enterprises in 2022 and higher speed standards like USB4 and PCIe 5.0 raise the bar for every mating cycle.
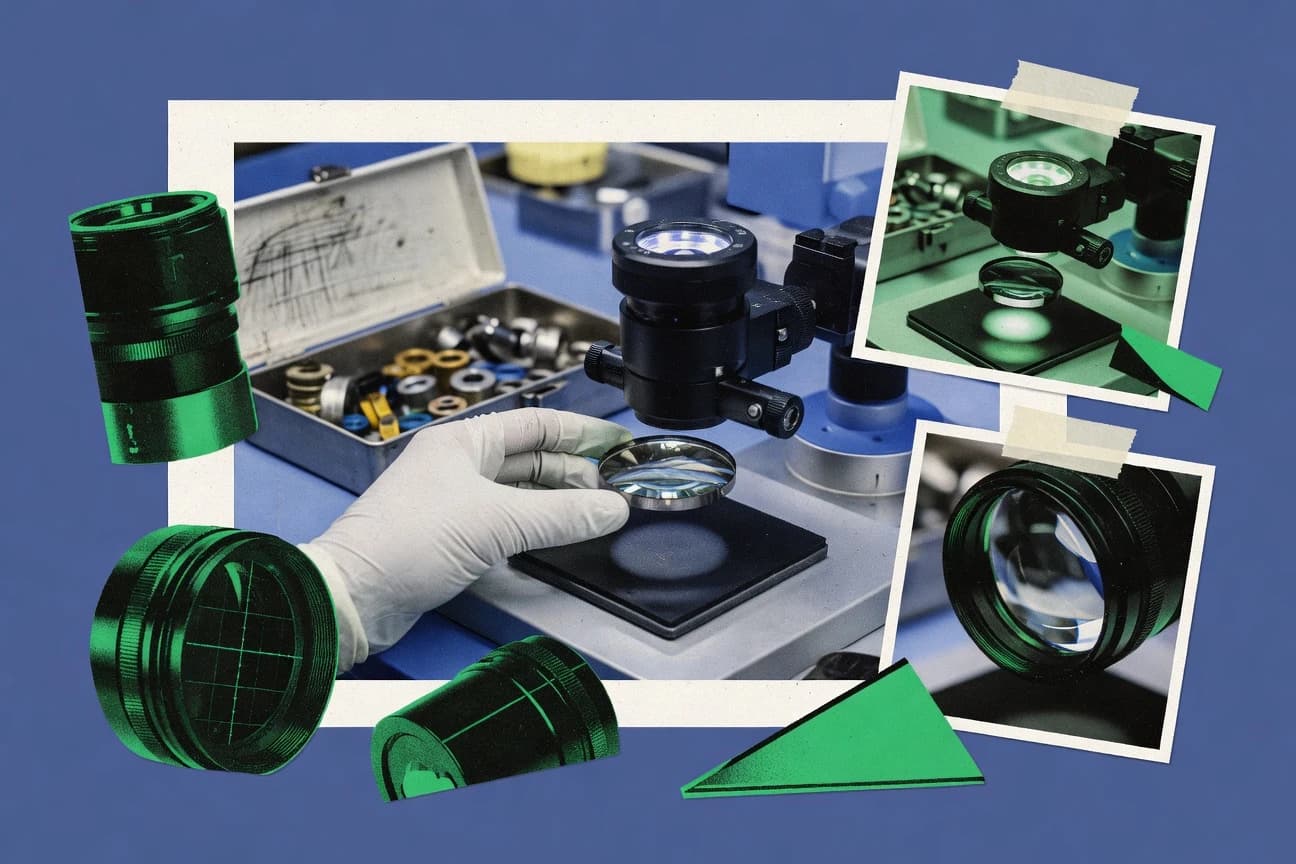
Optical Components Industry Statistics
Optical Components Industry metrics are pointing to a sharper split between demand and supply, with 2026 outlook figures suggesting momentum is shifting faster than production capacity can easily follow. Get the key 2025 to 2026 numbers that explain what is driving prices, throughput, and investment decisions across lens, sensor, and photonics suppliers.
Sensors Industry Statistics
From 2,700 plus ZVEI member companies to air quality and industrial cybersecurity demands shaped by EU rules and AI Act milestones, this page connects the dots between sensors, trusted analytics, and real-world impact. It also highlights why priorities are shifting fast, with 40% of organizations ranking predictive maintenance as a top IoT program focus, smart connected product data expected to grow in importance for 65% of companies, and a 2023 data breach cost averaging USD 4.45 million putting OT and sensor security into immediate board level territory.
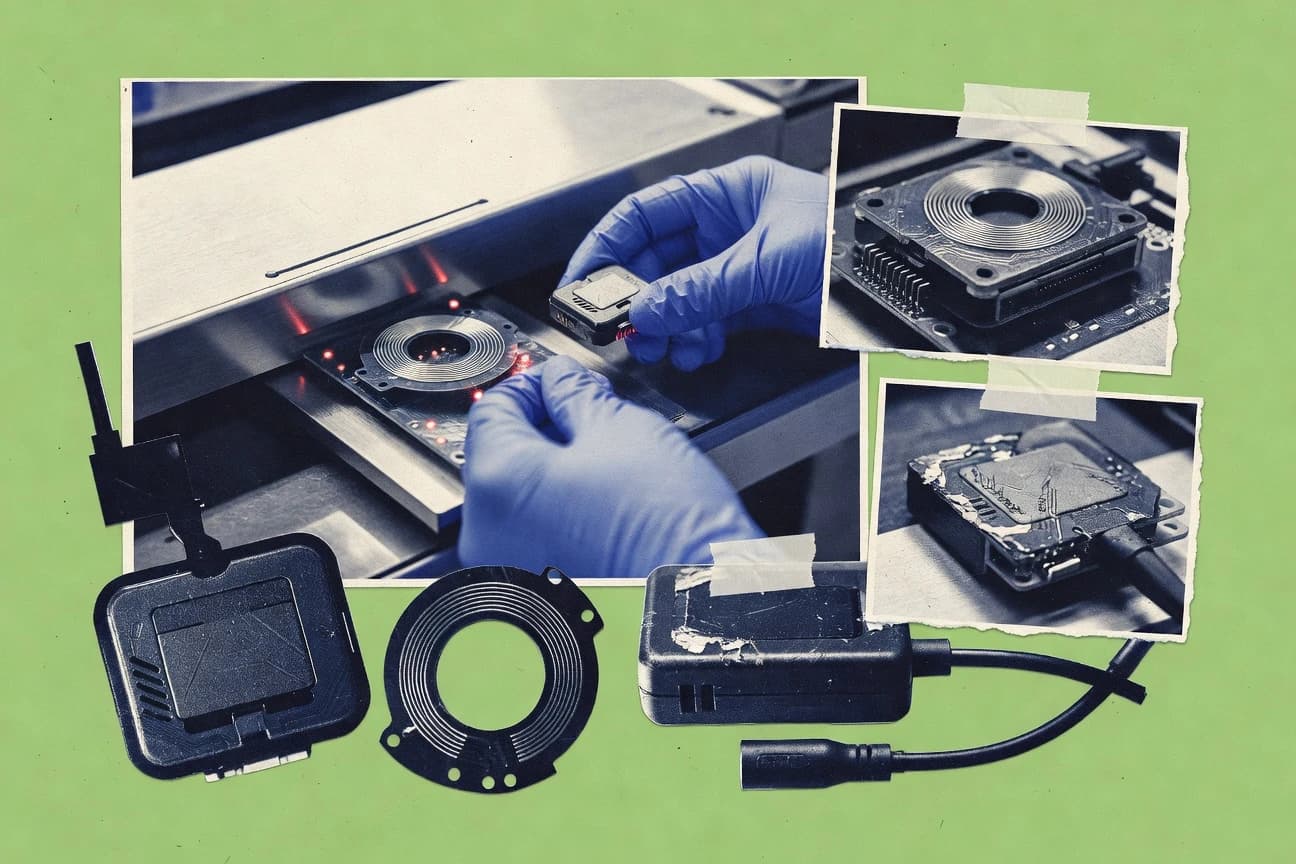
Rfid Industry Statistics
RFID demand is set to jump sharply, with forecasts pointing from a 2024 value of $14.1 billion to $34.2 billion by 2032, while accuracy gains in real warehouse and retail trials can reach double digit improvements over manual scanning. Add standards and performance context such as ISO/IEC 18046-3 read measurement methods and EPC Gen2 anti collision behavior, and you get the practical why behind the business case, not just market noise.

Radar Industry Statistics
Radar sales are set to jump from $33.7 billion in 2023 to $62.1 billion by 2030, with North America climbing from $12.8 billion to $23.7 billion and Europe from $8.9 billion to $16.6 billion. Automotive radar alone is expected to more than double from $7.2 billion in 2023 to $15.4 billion by 2032, as defense, maritime, and weather radar markets also expand, reshaping where the next budgets and deployments will land.
Uwb Industry Statistics
UWB shipments are projected to surge from 406.9 million units in 2025 to 1.08 billion by 2030, while market revenue climbs from $4.3B in 2025 to $13.4B in 2030, for a 33.5 percent CAGR that is hard to ignore. Read this page to connect those growth curves to the real battlegrounds behind them including centimeter level positioning limits, IEEE 802.15.4z coexistence upgrades, and the regulatory rules that shape what devices can actually do.

South Korea Chip Industry Statistics
South Korea is still exporting semiconductors at a scale that reached $142.0 billion in 2023, while the input side tightens with lower equipment and materials imports than the prior year, forcing a closer look at how capacity and supply chain pressure move together. The page pairs trade and market shares with manufacturing realities such as a 1.77% GDP R and D intensity, sustainability shifts like 42% less water use per wafer, and a sector that ties into global memory dominance held by Samsung Electronics and SK hynix.

Semiconductor Chip Industry Statistics
Semiconductor sales are forecast to rise to $611.9 billion in 2025, yet equipment demand is also tightening with SEMI billings projected at $73.7 billion for Q4 2024, a contrast that helps explain where new capacity will actually come from. Track the market split by region, application, and patent momentum, plus the path toward revenue reaching $1 trillion by 2029, all from the sources shaping WSTS, Gartner, SIA, and SEMI outlooks.
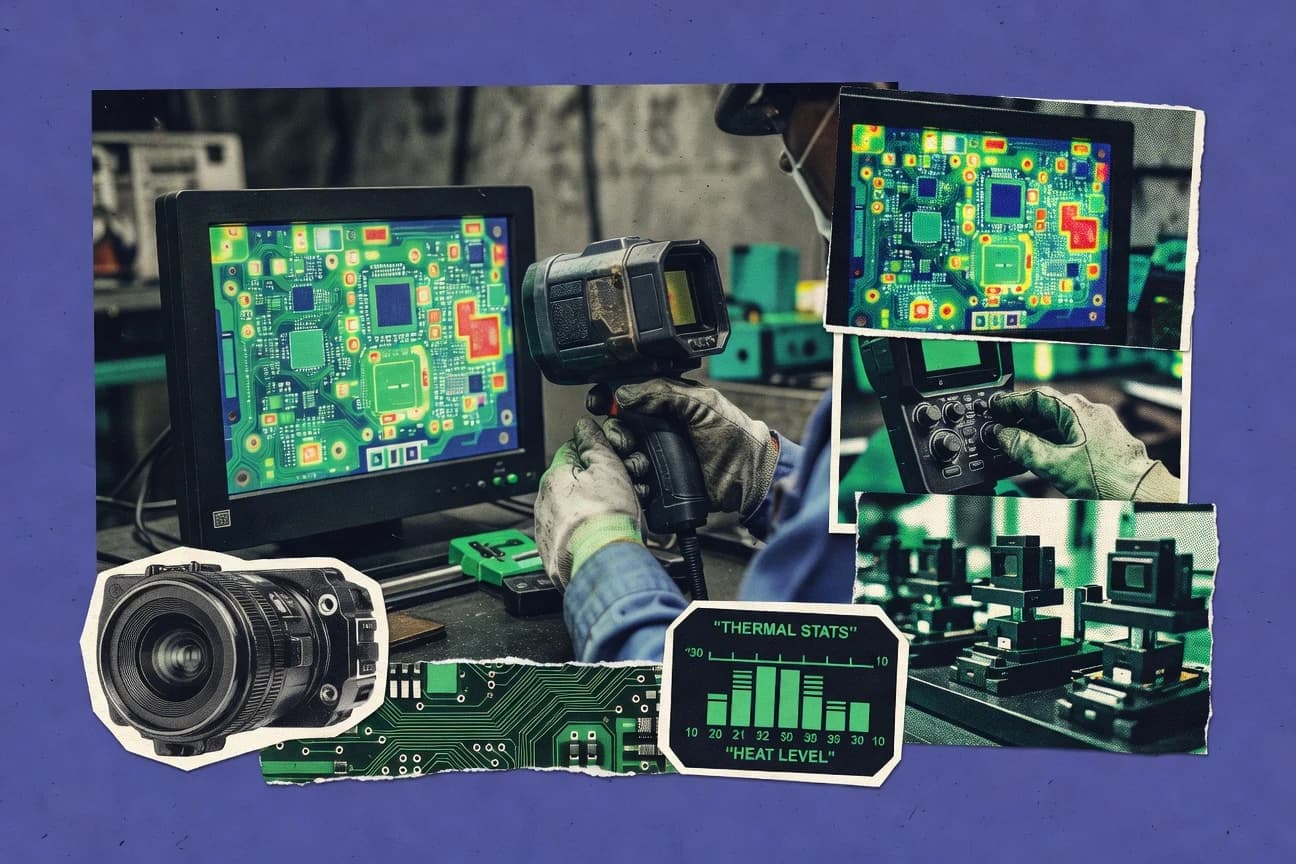
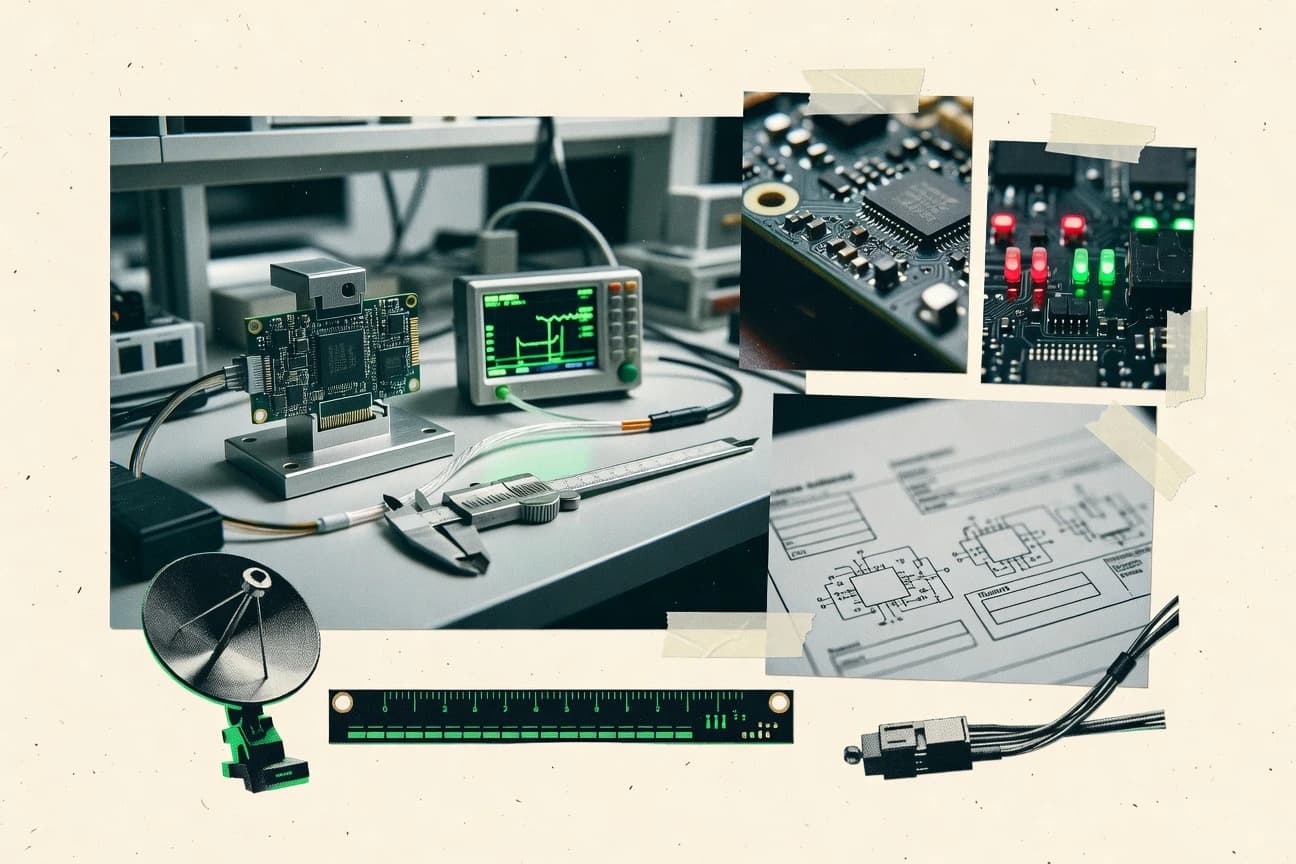
Thermal Camera Industry Statistics
Thermal cameras are scaling fast, with the global market projected to rise from 6.93 billion USD in 2023 to 15.55 billion USD by 2030 and the wider thermal imaging market climbing toward 19.2 billion USD by 2028. This page connects those surging forecasts to where demand is actually concentrating, from North America’s current revenue lead to Asia Pacific’s highest growth and the practical pull of predictive maintenance, construction energy audits, and industrial inspection.
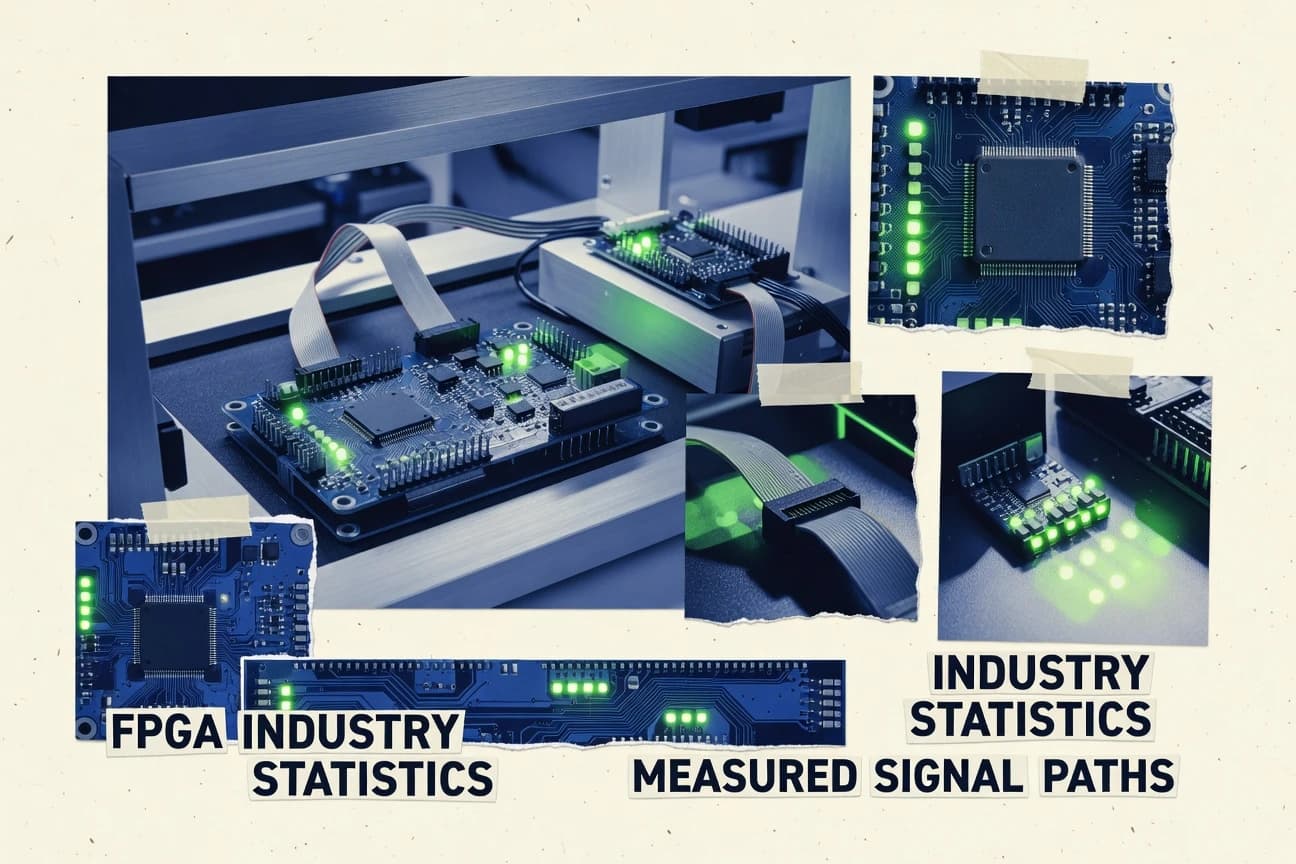
Fpga Industry Statistics
FPGA demand is surging from a 2023 market value of USD 2.32 billion toward USD 6.52 billion by 2032 at a 12.4% CAGR, while the silicon behind it keeps getting denser, faster, and more specialized. Expect a stats snapshot that connects ecosystem signals like PCIe 6.0 lane rates, 3GPP NR frame timing, and leading vendor scale to the business side, including AMD Xilinx revenue of $22.67 billion and a $35 billion acquisition that is still reshaping the competitive map.