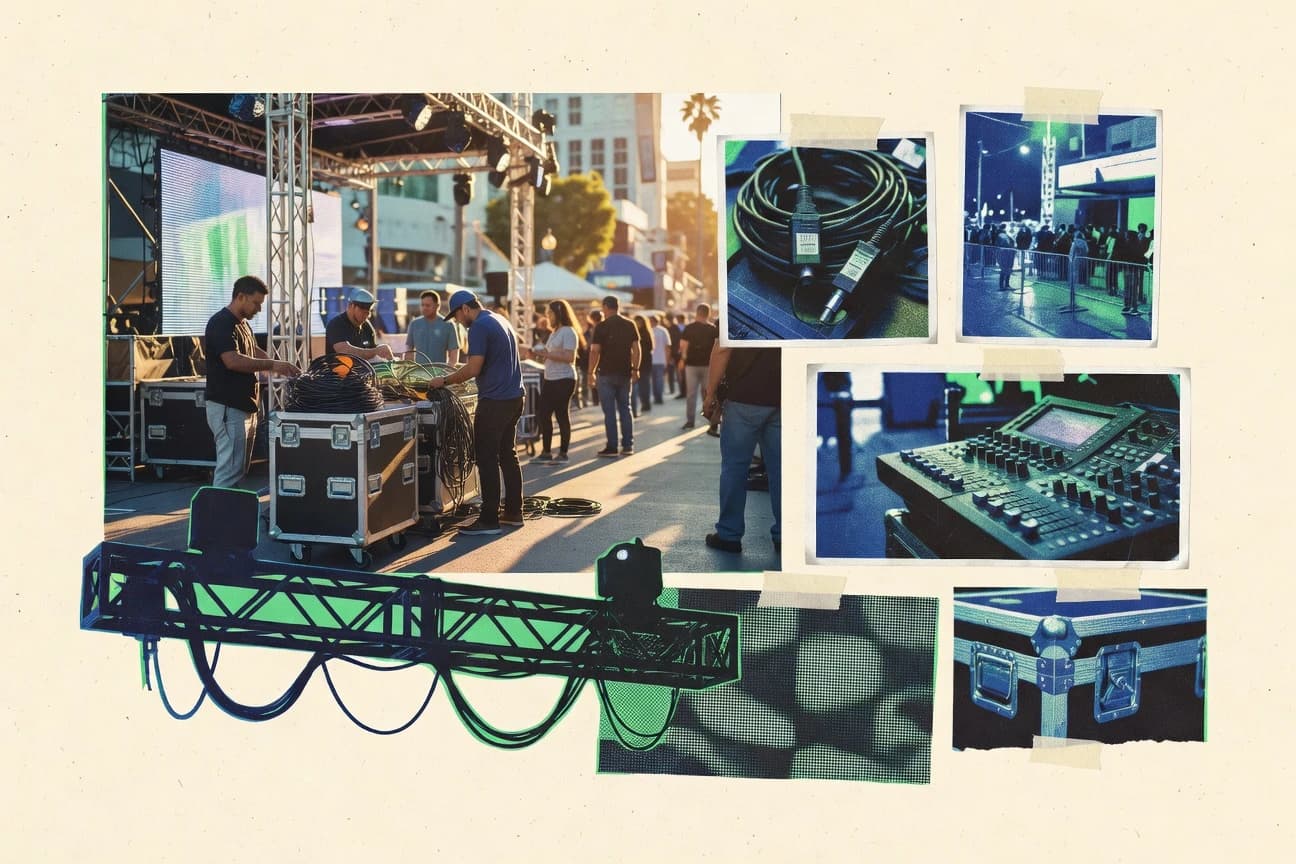

Los Angeles’ event industry is built on a layered workforce, from general live entertainment staff to meeting and convention planners. Hospitality capacity and performance—like downtown hotel rooms and meeting-linked hotel revenue—help sustain attendance seasons. The city’s major visitor flows via air travel and large venue networks shape staffing needs, while recent entertainment employment volatility highlights the planning trade-offs across the market.
Key Takeaways
- 27,000 live entertainment and events workers in the Los Angeles-Long Beach-Anaheim metro area (part of the broader arts & entertainment employment base supporting event operations).
- 1,900 conventions and trade show event planners employed in the Los Angeles area (reflecting a specialized workforce segment tied to meetings and events).
- 8.4% projected employment growth for meeting, convention, and event planners from 2022 to 2032 in the U.S. (context for staffing demand in large-event markets like Los Angeles).
- 6,165-room hotel inventory in downtown Los Angeles (lodging capacity that supports high attendance events).
- 3,500-seat capacity for the Microsoft Theater (event hosting venue capacity benchmark).
- 3.4% of Los Angeles County hotel revenue in 2023 derived from meetings and conventions (share supporting event-linked hospitality).
- 3.0% year-over-year decline in California entertainment and recreation employment in early 2024 (indicator for volatility affecting event scheduling and staffing).
- Los Angeles hosted 22 major conventions (top 100 U.S. meetings by attendance) in 2019 per Meetings & Conventions’ venue/convention coverage, indicating pre-pandemic event volume
- 1,862,000 total room nights sold in Los Angeles (2019), indicating the scale of lodging demand that events help drive
- Los Angeles County hotel occupancy averaged 72.6% in 2023 (STR/industry reporting via a hotel market review), supporting stable lodging demand for event seasons
- Los Angeles hotel RevPAR averaged $146.42 in 2023 (STR/industry reporting via market review), indicating improved performance supporting event demand
- 3.2% of Los Angeles County jobs are directly in arts, entertainment, and recreation (2022), forming a labor base that supports live event supply
- 18.6 million international visitors arrived in the U.S. in 2023 (UNWTO estimate compiled by U.S. government tourism data), supporting national demand for Los Angeles events
- Los Angeles World Airports recorded 88.4 million passengers handled in 2019 at LAX, providing airport throughput scale relevant to major event travel
- LAX passenger volume reached 87.5 million in 2023, near pre-pandemic levels and supporting large event travel demand
Los Angeles events are supported by strong hospitality and growing planner demand, with major venues and steady hotel performance.
Related reading
01 · Category
Workforce7 stats
01
27,000 live entertainment and events workers in the Los Angeles-Long Beach-Anaheim metro area (part of the broader arts & entertainment employment base supporting event operations).https://www.bls.gov/oes/current/oes419011.htm
02
1,900 conventions and trade show event planners employed in the Los Angeles area (reflecting a specialized workforce segment tied to meetings and events).https://data.bls.gov/oes/
03
8.4% projected employment growth for meeting, convention, and event planners from 2022 to 2032 in the U.S. (context for staffing demand in large-event markets like Los Angeles).https://www.bls.gov/ooh/business-and-financial/meeting-convention-and-event-planners.htm
04
2.1% annual growth in accommodation and food services employment in Los Angeles County from 2019 to 2023 (hospitality labor base supporting event attendees).https://data.bls.gov/timeseries/SMU06000004141450601
05
19.0% of Los Angeles County workforce is employed in accommodation and food services (industry employment share affecting event supply capacity).https://www.bls.gov/cew/data.htm
06
31.4% of event production and labor positions are reported as temporary or contract roles in the U.S. (event staffing pattern influencing Los Angeles vendor ecosystems).https://www.bls.gov/news.release/conemp.t09.htm
07
$69,000median annual wage for meeting, convention, and event planners in 2023 in the U.S. (labor cost benchmark for event staffing).https://www.bls.gov/oes/current/oes272012.htm
Interpretation
Workforce Interpretation
With Los Angeles employing 27,000 live entertainment and events workers and a specialized workforce of about 1,900 conventions and trade show planners, the event industry’s staffing needs are being reinforced by faster hospitality labor growth of 2.1% annually in Los Angeles County and an expected 8.4% national increase in meeting and event planner jobs from 2022 to 2032, even as 31.4% of event production and labor roles remain temporary or contract.
02 · Category
Industry Trends3 stats
01
3.4% of Los Angeles County hotel revenue in 2023 derived from meetings and conventions (share supporting event-linked hospitality).https://www.visitla.com/media/Content/Research/HotelMarketReport2023.pdf
02
3.0% year-over-year decline in California entertainment and recreation employment in early 2024 (indicator for volatility affecting event scheduling and staffing).https://data.bls.gov/timeseries/CES4254550002
03
Los Angeles hosted 22 major conventions (top 100 U.S. meetings by attendance) in 2019 per Meetings & Conventions’ venue/convention coverage, indicating pre-pandemic event volumehttps://www.meetings-conventions.com/business/industry-news/meetings-conventions-2019-top-100
Interpretation
Industry Trends Interpretation
With 3.4% of Los Angeles County’s 2023 hotel revenue linked to meetings and conventions and major convention hosting totaling 22 top U.S. events in 2019, the industry trend suggests a meaningful but relatively niche share of hospitality tied to events while early 2024 saw a 3.0% year over year employment decline in entertainment and recreation, pointing to emerging volatility in the event ecosystem.
03 · Category
Lodging & Capacity9 stats
01
1,862,000 total room nights sold in Los Angeles (2019), indicating the scale of lodging demand that events help drivehttps://www.cbpp.org/research/housing/room-tax-tops-1-billion-in-l-a
02
Los Angeles County hotel occupancy averaged 72.6% in 2023 (STR/industry reporting via a hotel market review), supporting stable lodging demand for event seasonshttps://www.jll.com/en/trends/hospitality/los-angeles-hotel-market-report
03
Los Angeles hotel RevPAR averaged $146.42in 2023 (STR/industry reporting via market review), indicating improved performance supporting event demandhttps://www.hvs.com/research/2024/los-angeles-hotel-market-report-2024
04
70.4% hotel occupancy in 2019 for the Los Angeles hotel market (occupancy rate).https://www.costar.com/products/str-benchmark
05
66.6% hotel occupancy in 2020 for the Los Angeles hotel market (occupancy rate).https://www.costar.com/products/str-benchmark
06
63.7% hotel occupancy in 2021 for the Los Angeles hotel market (occupancy rate).https://www.costar.com/products/str-benchmark
07
68.7% hotel occupancy in 2022 for the Los Angeles hotel market (occupancy rate).https://www.costar.com/products/str-benchmark
08
72.6% hotel occupancy in 2023 for the Los Angeles hotel market (occupancy rate).https://www.costar.com/products/str-benchmark
09
74.0% hotel occupancy in 2018 for the Los Angeles hotel market (occupancy rate).https://www.costar.com/products/str-benchmark
Interpretation
Lodging & Capacity Interpretation
In 2019 Los Angeles generated 1,862,000 total room nights from lodging demand tied to events, and by 2023 hotel occupancy held steady at 72.6% with RevPAR up to $146.42, showing strong capacity performance for the city’s event-driven lodging segment.
More related reading
report visual · Projection
Los Angeles Hotel Occupancy Rate (2018–2023)
Hotel occupancy in the Los Angeles hotel market fluctuated year to year, dropping from the 2018 peak to the 2021 low, then rebounding to the strongest level in 2023.
74 percent
Start
-0.38%
CAGR · 5y
72.6 percent
Projected
20182023
source-verifiedcostar.com2023
04 · Category
Visitor Demand3 stats
01
18.6 million international visitors arrived in the U.S. in 2023 (UNWTO estimate compiled by U.S. government tourism data), supporting national demand for Los Angeles eventshttps://travel.trade.gov/research-reports/international-travel/2023-international-travel-data
02
Los Angeles World Airports recorded 88.4 million passengers handled in 2019 at LAX, providing airport throughput scale relevant to major event travelhttps://www.lawa.org/-/media/lawa-web/documents/business/annual-reports/lax-2019-annual-report.pdf
03
LAX passenger volume reached 87.5 million in 2023, near pre-pandemic levels and supporting large event travel demandhttps://www.lawa.org/-/media/lawa-web/documents/business/annual-reports/lax-2023-annual-report.pdf
Interpretation
Visitor Demand Interpretation
With LAX handling 87.5 million passengers in 2023 and Los Angeles World Airports reaching 88.4 million in 2019, the city shows strong visitor demand that closely matches pre pandemic travel levels and aligns with the broader US inflow of 18.6 million international visitors in 2023.
05 · Category
Venues & Capacity2 stats
01
6,165-room hotel inventory in downtown Los Angeles (lodging capacity that supports high attendance events).https://www.visitla.com/media/Content/Research/HotelFactsheetDowntownLA.pdf
02
3,500-seat capacity for the Microsoft Theater (event hosting venue capacity benchmark).https://www.livenation.com/venue/KovZpZAEwK4A/microsoft-theater-los-angeles-tickets
Interpretation
Venues & Capacity Interpretation
Downtown Los Angeles offers 6,165 hotel rooms to support high attendance, and with venues like the Microsoft Theater seating 3,500 people, the city’s venue and lodging capacity is strong enough to host large events at scale.
06 · Category
Overview3 stats
01
3.2% of Los Angeles County jobs are directly in arts, entertainment, and recreation (2022), forming a labor base that supports live event supplyhttps://lao.ca.gov/reports/2023/finance/arts-and-recreation-032423.pdf
02
Dodger Stadium capacity is 56,000, and regular-season games plus major events drive recurring audience demand in the LA markethttps://www.mlb.com/dodgers/ballpark/information
03
The U.S. destination management services market was valued at $9.1B in 2023 (industry analyst estimate), reflecting the scale of agencies commonly engaged for LA eventshttps://www.marketwatch.com/press-release/destination-management-services-market-to-grow-at-a-cagr-of-8-4-to-reach-usd-14-5-billion-by-2030-2024-01-29
Interpretation
Industry Overview Interpretation
In Los Angeles County, 3.2% of jobs are directly in arts, entertainment, and recreation, and that dedicated labor base, combined with major venues like Dodger Stadium’s 56,000-seat draw, helps sustain the recurring live event demand that also aligns with the broader growth of the $9.1B destination management services market.
Reference
Cite This Report
This report is designed to be cited. We maintain stable URLs and versioned verification dates. Copy the format appropriate for your publication below.
APA
Marie Larsen. (2026, February 13). Los Angeles Event Industry Statistics. Gitnux. https://gitnux.org/los-angeles-event-industry-statistics
MLA
Marie Larsen. "Los Angeles Event Industry Statistics." Gitnux, 13 Feb 2026, https://gitnux.org/los-angeles-event-industry-statistics.
Chicago
Marie Larsen. 2026. "Los Angeles Event Industry Statistics." Gitnux. https://gitnux.org/los-angeles-event-industry-statistics.
Sources & references
22 datasets cited across this report
+8 additional datasets cited (not shown individually)