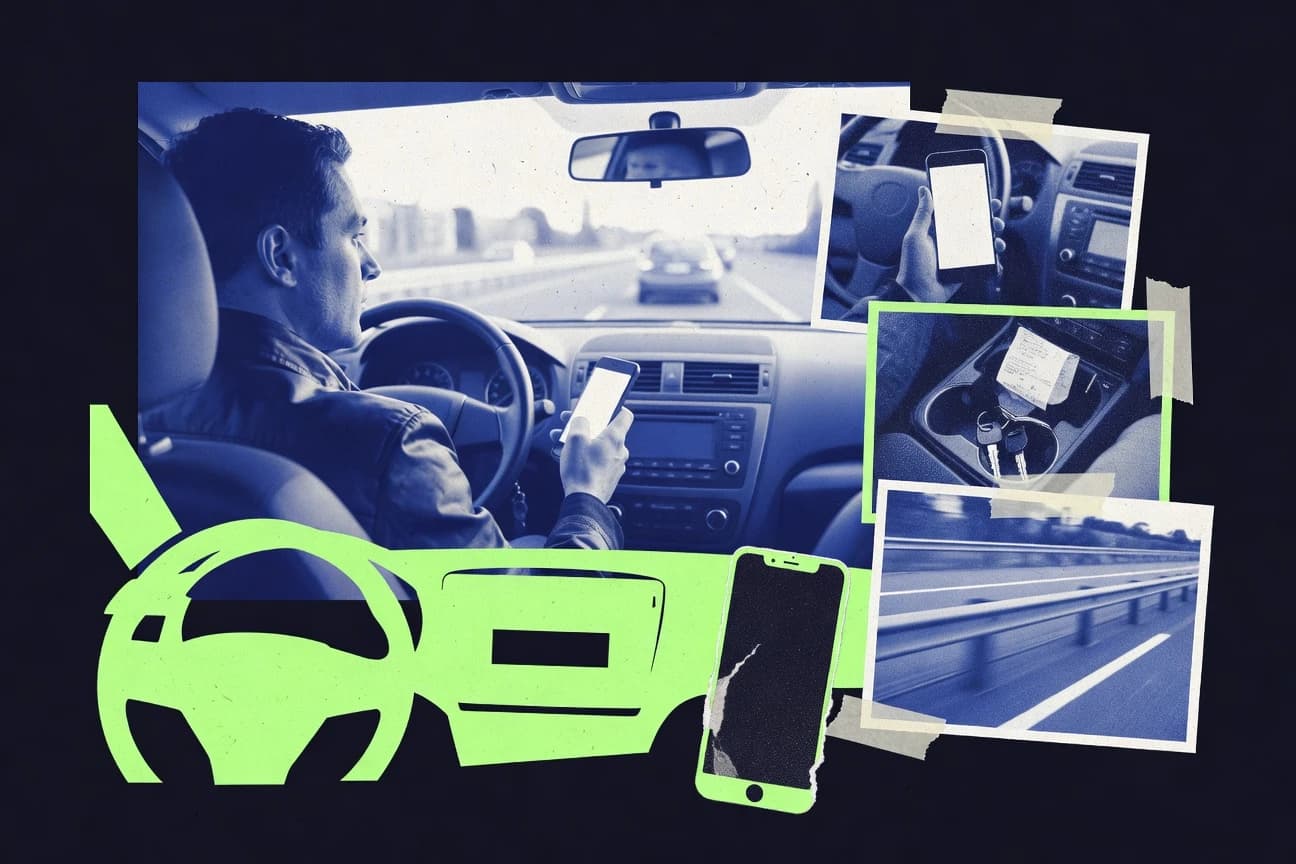

Cell phone distraction contributed to 387,000 U.S. crashes in a recent year. Texting while driving increases crash risk by approximately five times, a hazard quantified across multiple studies. This article examines the scope, risk factors, and technological responses to distracted driving.
Key Takeaways
- In 2022, 387,000 crashes in the U.S. involved cell-phone distraction
- In a meta-analysis, visual-manual texting while driving increased crash risk by about 5 times compared with baseline driving
- In a controlled driving study, drivers took about 5 seconds longer to respond when texting than when not texting
- In a driving simulator experiment, lane keeping variability increased significantly during phone tasks (hands-free and handheld), with the largest effect during texting
- The driver monitoring systems market is forecast to grow at a CAGR of about 16% from 2023 to 2030
- The global advanced driver assistance system (ADAS) market was valued at about $42.3 billion in 2023 and is projected to reach $95.3 billion by 2028
- Commercial vehicle telematics market revenue was about $34.7 billion in 2023 and projected to reach $103.9 billion by 2030
- Texting while driving increases crash risk by 3.6 times versus baseline driving in a meta-analysis of driving performance studies (At-fault crash risk from observational plus experimental evidence; year of publication 2015).
- Reading/manipulating a phone in naturalistic driving increased crash/near-crash risk by 2.3x compared with baseline roadway segments (meta-analytic estimate based on observational naturalistic evidence; year 2017).
- Hands-free device use is associated with a 1.13x increased risk of crash/near-crash relative to not using a phone (systematic review and meta-analysis; 2017).
- The U.S. Centers for Disease Control and Prevention reported that motor vehicle crashes cost the U.S. economy about $277 billion per year (2021 CDC estimates; includes all crash types).
- A 2023 industry study estimated the global telematics market at $149 billion in 2023 (telematics broadly including fleet and in-vehicle connectivity).
- $4.6 billion was the reported U.S. spend on road safety technology (including driver monitoring) in 2022 (industry report estimate by guidehouse; published 2023).
- As of 2024, 19 U.S. states and D.C. have a primary enforcement law that allows police to stop drivers specifically for texting while driving (NSC compiled state law map, 2024).
- In the U.S., 36 states prohibit handheld phone use while driving (including various conditions) as of 2024 (NSC law map compilation).
Texting and other phone tasks sharply increase crash risk and near misses, driving urgent adoption of monitoring and safety systems.
Related reading
01 · Category
Public Safety Impact1 stats
01
In 2022, 387,000 crashes in the U.S. involved cell-phone distraction
Interpretation
Public Safety Impact Interpretation
In 2022, 387,000 U.S. crashes involved cell-phone distraction, underscoring how this specific form of distracted driving poses a major public safety risk.
02 · Category
Human Factors & Behavior4 stats
01
In a meta-analysis, visual-manual texting while driving increased crash risk by about 5 times compared with baseline driving
02
In a controlled driving study, drivers took about 5 seconds longer to respond when texting than when not texting
03
In a driving simulator experiment, lane keeping variability increased significantly during phone tasks (hands-free and handheld), with the largest effect during texting
04
In a large naturalistic driving study, the rate of near-crash events was higher during phone tasks, especially texting/reading
Interpretation
Human Factors & Behavior Interpretation
Across studies in the human factors and behavior category, engaging with a phone notably undermines driver performance, with texting associated with about a 5 times higher crash risk and response times roughly 5 seconds slower, while simulator and naturalistic data show increased lane variability and more near-crash events during phone tasks, especially texting and reading.
03 · Category
Technology Adoption7 stats
01
The driver monitoring systems market is forecast to grow at a CAGR of about 16% from 2023 to 2030
02
The global advanced driver assistance system (ADAS) market was valued at about $42.3 billion in 2023 and is projected to reach $95.3 billion by 2028
03
Commercial vehicle telematics market revenue was about $34.7 billion in 2023 and projected to reach $103.9 billion by 2030
04
E-call and e-safety systems: in the EU, 100% of new cars are required to have eCall from April 2018 (vehicle safety regulation)
05
In the U.S., the Transportation Recall Enhancement Accountability and Documentation (TREAD) Act created data requirements that include safety information reporting affecting distraction-related recalls (statutory basis)
06
EU General Safety Regulation requires advanced driver assistance technologies, including systems that monitor driver attention; it begins applying in 2022 for certain features
07
Telematics-based driver behavior analytics market projected to exceed $10 billion by 2026 (industry forecast)
Interpretation
Technology Adoption Interpretation
Technology adoption in distracted driving is accelerating as driver monitoring systems are set to grow at about a 16% CAGR from 2023 to 2030, while major safety tech markets like ADAS are projected to nearly double from $42.3 billion in 2023 to $95.3 billion by the next decade.
04 · Category
Risk Quantification7 stats
01
Texting while driving increases crash risk by 3.6 times versus baseline driving in a meta-analysis of driving performance studies (At-fault crash risk from observational plus experimental evidence; year of publication 2015).
02
Reading/manipulating a phone in naturalistic driving increased crash/near-crash risk by 2.3x compared with baseline roadway segments (meta-analytic estimate based on observational naturalistic evidence; year 2017).
03
Hands-free device use is associated with a 1.13x increased risk of crash/near-crash relative to not using a phone (systematic review and meta-analysis; 2017).
04
In a U.S. simulator study, dialed phone tasks increased lane position standard deviation by 1.7 times versus baseline driving (study report published 2012).
05
In a naturalistic driving analysis, visual-manual phone tasks were associated with a 4.1x increase in safety-critical event frequency compared to baseline (case-crossover study; year 2016).
06
In a pooled observational analysis, drivers engaging in visual-manual tasks had about a 1.9x increased probability of near-crash/critical event occurrence (published 2018).
07
In a meta-analysis of cognitive distraction (e.g., phone conversations), overall crash risk increased by 1.6 times versus no distraction (2019 synthesis).
Interpretation
Risk Quantification Interpretation
Across risk quantification studies, visual and manual phone interactions consistently raise crash and near-crash risk by roughly 1.9 to 4.1 times, with texting specifically jumping to about 3.6 times baseline, showing that distraction produces a measurable and often several-fold increase in road risk.
More related reading
05 · Category
Economic Impact4 stats
01
The U.S. Centers for Disease Control and Prevention reported that motor vehicle crashes cost the U.S. economy about $277 billion per year (2021 CDC estimates; includes all crash types).
02
A 2023 industry study estimated the global telematics market at $149 billion in 2023 (telematics broadly including fleet and in-vehicle connectivity).
03
$4.6 billion was the reported U.S. spend on road safety technology (including driver monitoring) in 2022 (industry report estimate by guidehouse; published 2023).
04
The Global Road Safety Partnership cited an estimated $520 billion global annual economic cost of road traffic injuries (2017–2018 baseline).
Interpretation
Economic Impact Interpretation
Distracted driving is not just a safety issue but a major economic drag, since motor vehicle crashes cost the US about $277 billion per year and road traffic injuries total roughly $520 billion globally each year, driving a growing push toward investments like $4.6 billion in US road safety technology in 2022.
06 · Category
Policy & Programs4 stats
01
As of 2024, 19 U.S. states and D.C. have a primary enforcement law that allows police to stop drivers specifically for texting while driving (NSC compiled state law map, 2024).
02
In the U.S., 36 states prohibit handheld phone use while driving (including various conditions) as of 2024 (NSC law map compilation).
03
In the EU, “eCall” service requirement applies to all new vehicle types from April 2018 and to new cars from April 2019 (Commission Delegated Regulation and implementation documents).
04
The U.S. FCC’s “Wireless Priority Service” includes provisions to maintain priority communications during emergencies, aiming to prevent distraction-related misuse; FCC order impact assessment shows system usage for public safety prioritization (FCC Public Safety and Homeland Security Bureau document, 2022).
Interpretation
Policy & Programs Interpretation
As of 2024, strong policy action is clearly expanding, with 19 U.S. states and Washington, D.C. using primary enforcement for texting while driving and 36 states banning handheld phone use, while Europe’s eCall rules and the FCC’s emergency communication priority further show how governments are building layered safety programs to curb distraction.
07 · Category
Industry Trends3 stats
01
$11.2 billion automotive safety electronics spending worldwide in 2023, with driver monitoring cited as a key component of occupant safety and driver assistance suites (IDTechEx market report release, 2023).
02
Vehicle interior sensing (camera + IR) accounts for the largest share of DMS sensing modalities at about 60% in 2023 deployments (Yole/Yole Développement release, 2024).
03
In 2023, global connected car subscriptions (including driver assistance-linked services) surpassed 285 million (Omdia/GlobalData connected car estimate, 2024).
Interpretation
Industry Trends Interpretation
The distracted-driving industry is clearly accelerating as 2023 spending of $11.2 billion on automotive safety electronics and deployments where interior sensing makes up about 60% of driver monitoring systems align with connected car subscriptions surpassing 285 million globally, showing how driver monitoring and assistance features are becoming a mainstream trend.
08 · Category
Performance Metrics7 stats
01
A U.S. naturalistic driving dataset used to study distraction recorded 1.2 billion miles of instrumented driving across participants (Naturalistic Driving Study summaries, 2015 publication).
02
In a meta-analysis of driving performance measures, response time to hazards increased with phone-based distraction by a pooled mean difference equivalent to about 0.6 seconds (2015 synthesis of simulator/field studies).
03
A UK simulator study found that dialing/text-entry tasks increased minimum time-to-collision by 0.5 seconds on average relative to baseline (published 2014).
04
In a benchmarked distraction detection experiment, driver monitoring algorithms achieved around 90% accuracy for detecting eyes-off-road events under controlled lighting (peer-reviewed 2019).
05
In a published work on distraction classification, a multimodal model (gaze + head pose) reached an F1-score of 0.86 for distinguishing talking vs. texting states (2018).
06
In the SHRP 2/vehicle instrumented studies, lane-keeping metrics were used such as lateral position and standard deviation; these metrics showed statistically significant degradation during hand-held phone tasks in simulator evaluations (2017 report).
07
In a driver distraction eye-tracking evaluation, mean gaze diversion duration exceeded 1.5 seconds for typical phone interactions (2016 study).
Interpretation
Performance Metrics Interpretation
Across performance metrics, distraction measurably degrades driving behavior with response times worsening in phone-based distraction meta-analyses, simulator tests showing about a 0.5 second increase in minimum time-to-collision, and advanced detection models reaching roughly 90% accuracy, indicating that the biggest gap is not just detection but the resulting loss of real-world driving performance.
report visual · Key figures
How phone distraction affects driving risk
Meta-analyses and studies consistently show higher crash/near-crash risk and worse driving performance when drivers use phones compared with baseline driving.
3.6
Texting while driving increases crash risk by 3.6 times versus baseline driving in a meta-analysis of driving performanc
2.3
Reading/manipulating a phone in naturalistic driving increased crash/near-crash risk by 2.3x compared with baseline road
1.13
Hands-free device use is associated with a 1.13x increased risk of crash/near-crash relative to not using a phone (syste
4.1
In a naturalistic driving analysis, visual-manual phone tasks were associated with a 4.1x increase in safety-critical ev
1.6
In a meta-analysis of cognitive distraction (e.g., phone conversations), overall crash risk increased by 1.6 times versu
source-verifiedsciencedirect.com · journals.sagepub.com2019
Reference
Cite This Report
This report is designed to be cited. We maintain stable URLs and versioned verification dates. Copy the format appropriate for your publication below.
APA
Thomas Lindqvist. (2026, February 13). Distracted Drivers Statistics. Gitnux. https://gitnux.org/distracted-drivers-statistics
MLA
Thomas Lindqvist. "Distracted Drivers Statistics." Gitnux, 13 Feb 2026, https://gitnux.org/distracted-drivers-statistics.
Chicago
Thomas Lindqvist. 2026. "Distracted Drivers Statistics." Gitnux. https://gitnux.org/distracted-drivers-statistics.
Sources & references
37 datasets cited across this report · attribution is report-level
+12 additional datasets cited (not shown individually)