
Understanding digital advertising metrics is crucial for success in today’s evolving digital landscape. This blog post covers essential KPIs and metrics to elevate digital campaign effectiveness, from CTR to conversion rates and beyond. Learn to make data-driven decisions that propel your brand forward.
Digital Advertising Metrics You Should Know
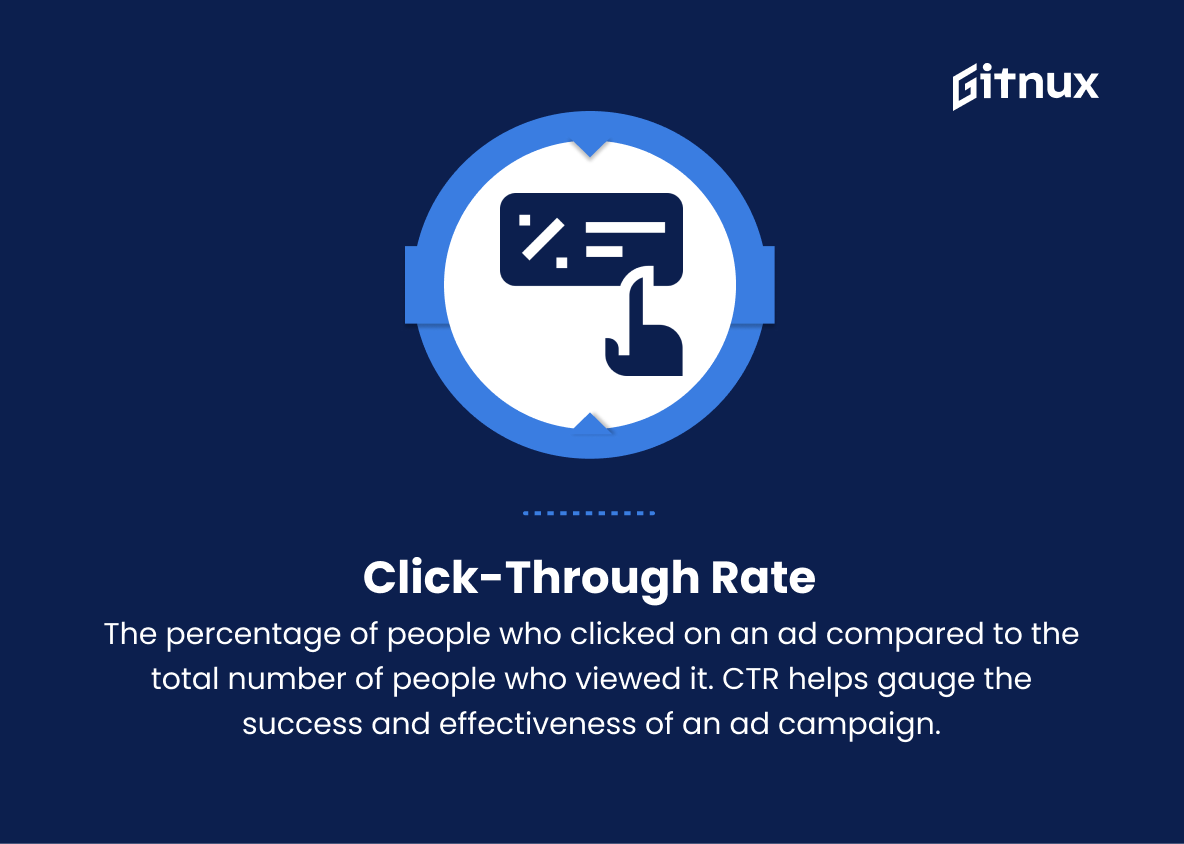
1. Click-through Rate (CTR)
The percentage of people who clicked on an ad compared to the total number of people who viewed it. CTR helps gauge the success and effectiveness of an ad campaign.
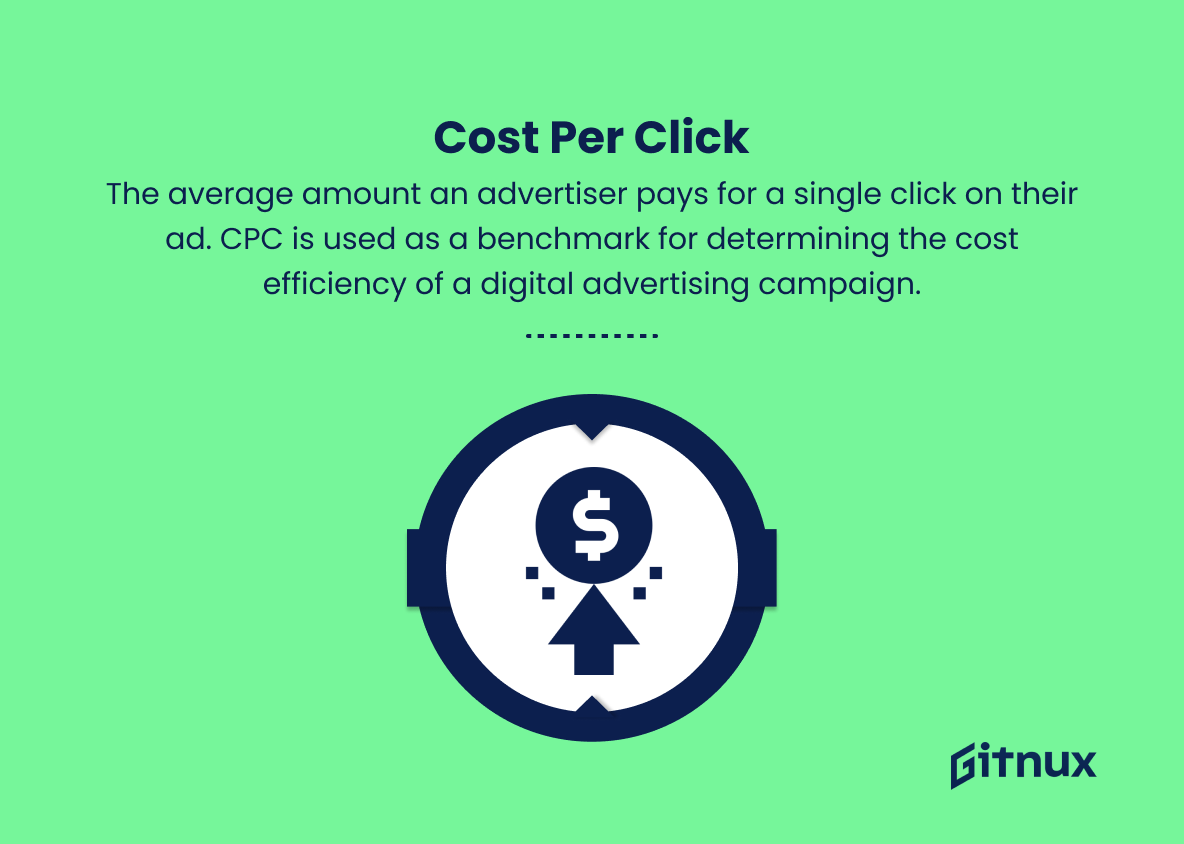
2. Cost per Click (CPC)
The average amount an advertiser pays for a single click on their ad. CPC is used as a benchmark for determining the cost efficiency of a digital advertising campaign.
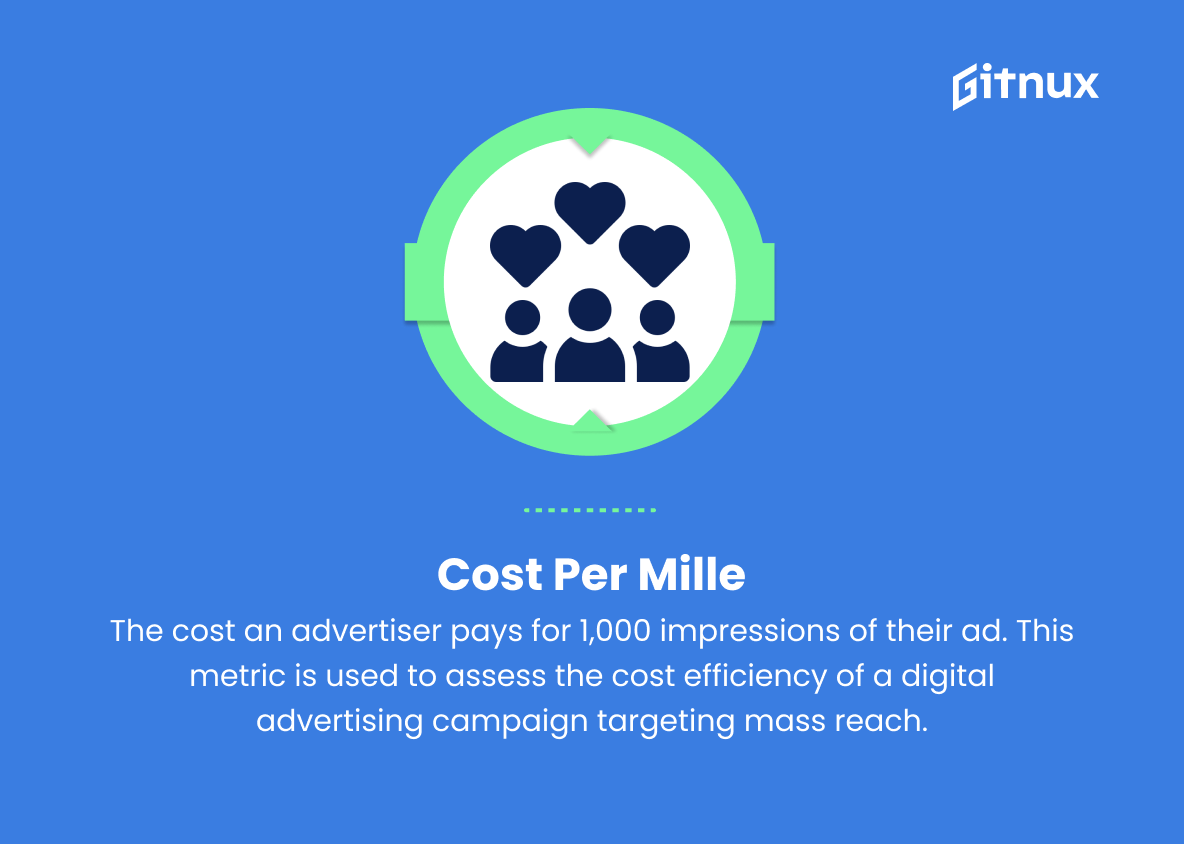
3. Cost per Mille (CPM)
The cost an advertiser pays for 1,000 impressions of their ad. This metric is used to assess the cost efficiency of a digital advertising campaign targeting mass reach.
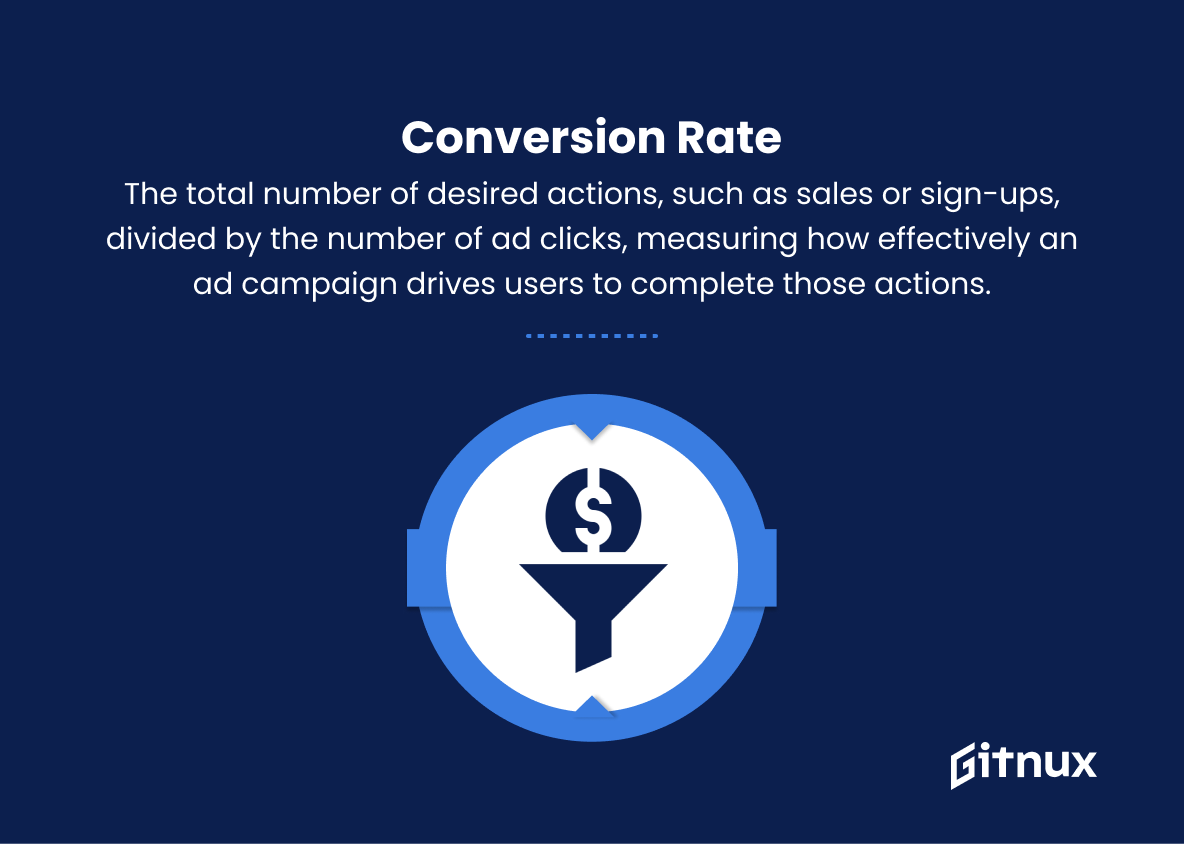
4. Conversion Rate
The total number of desired actions, such as sales or sign-ups, divided by the number of ad clicks, measuring how effectively an ad campaign drives users to complete those actions.
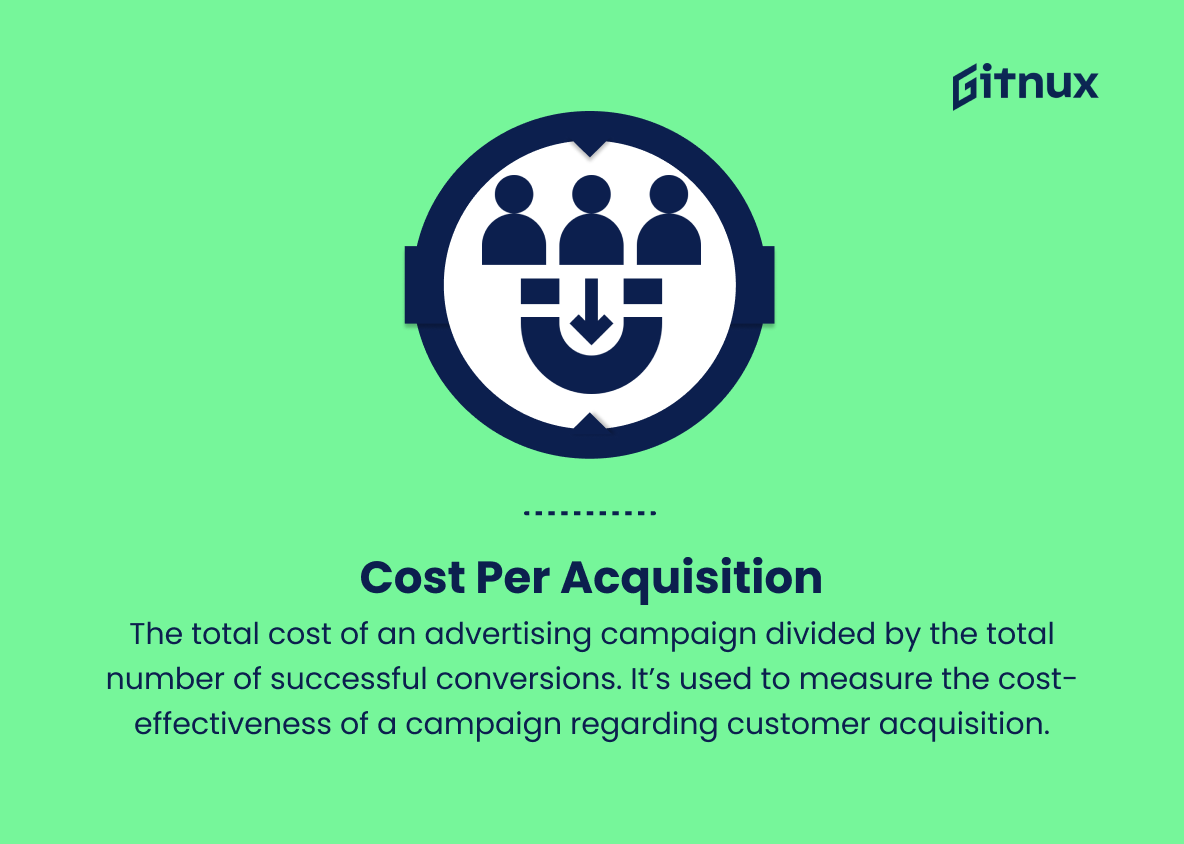
5. Cost per Acquisition (CPA)
The total cost of an advertising campaign divided by the total number of successful conversions. It’s used to measure the cost-effectiveness of a campaign regarding customer acquisition.
6. Return on Ad Spend (ROAS)
The revenue generated from an ad campaign divided by the total cost of the campaign, showing a direct comparison of the return on investment from advertising efforts.
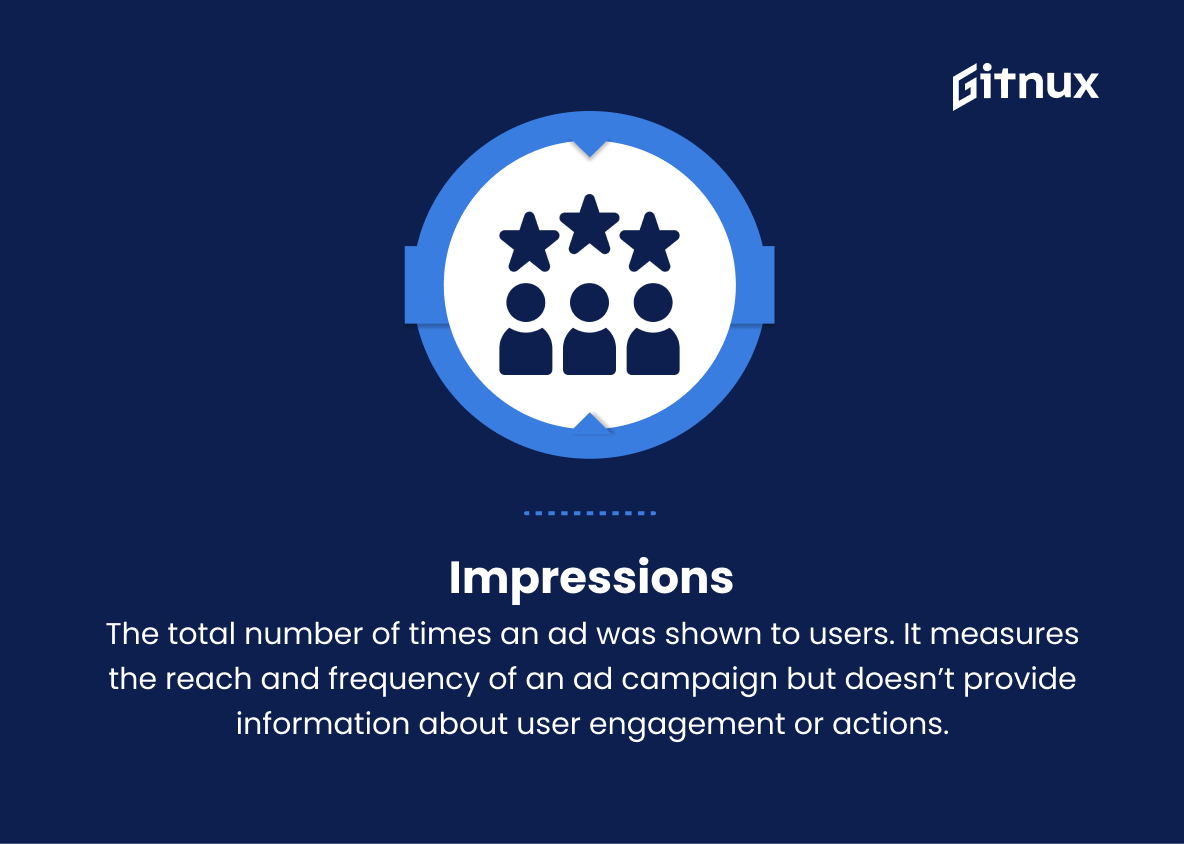
7. Impressions
The total number of times an ad was shown to users. It measures the reach and frequency of an ad campaign but doesn’t provide information about user engagement or actions.
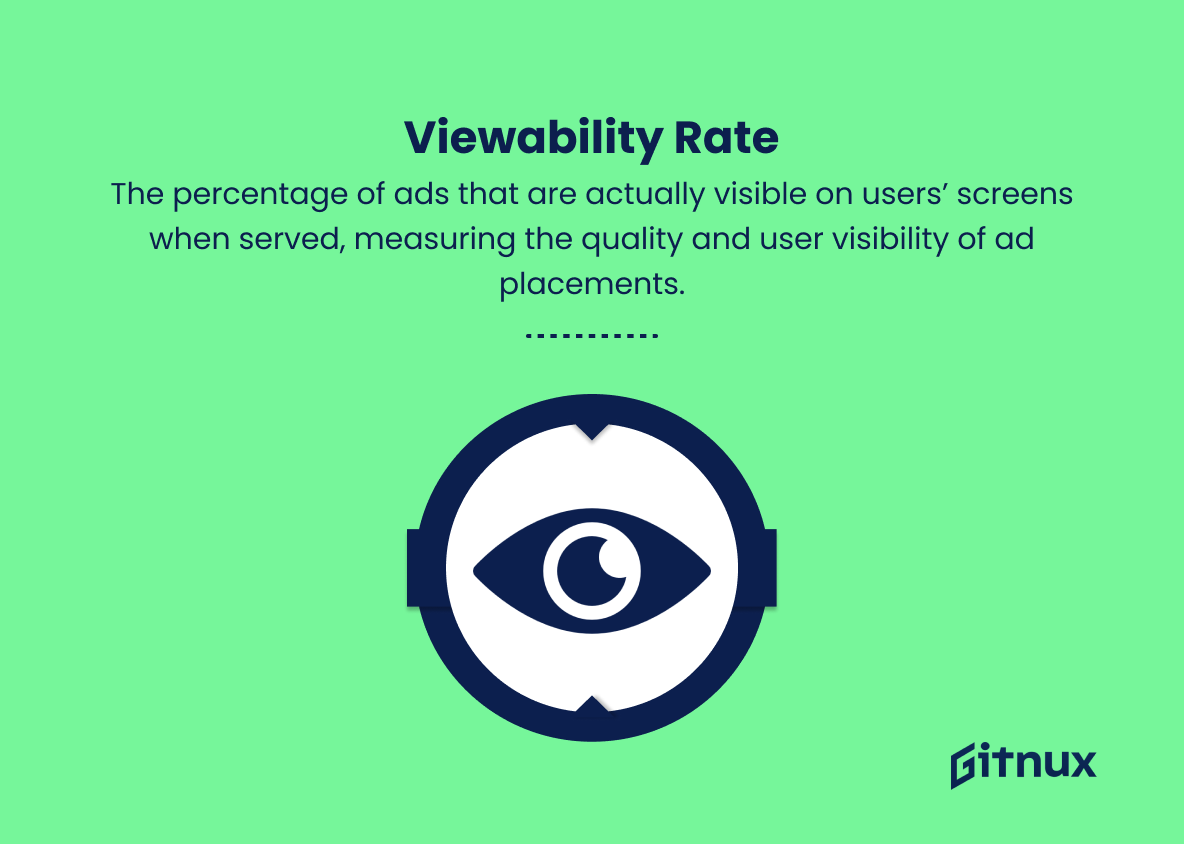
8. Viewability Rate
The percentage of ads that are actually visible on users’ screens when served, measuring the quality and user visibility of ad placements.
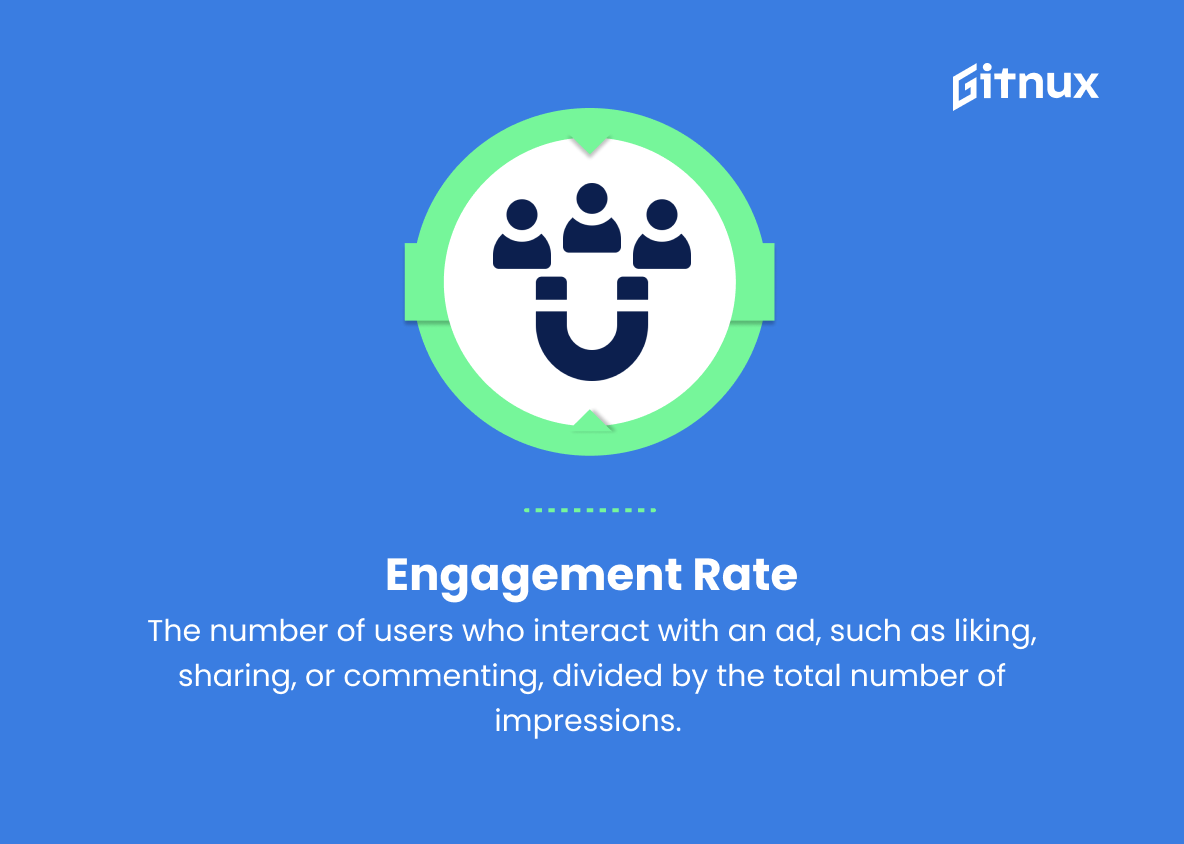
9. Engagement Rate
The number of users who interact with an ad, such as liking, sharing, or commenting, divided by the total number of impressions. It helps measure the relevance and resonance of an ad with the target audience.
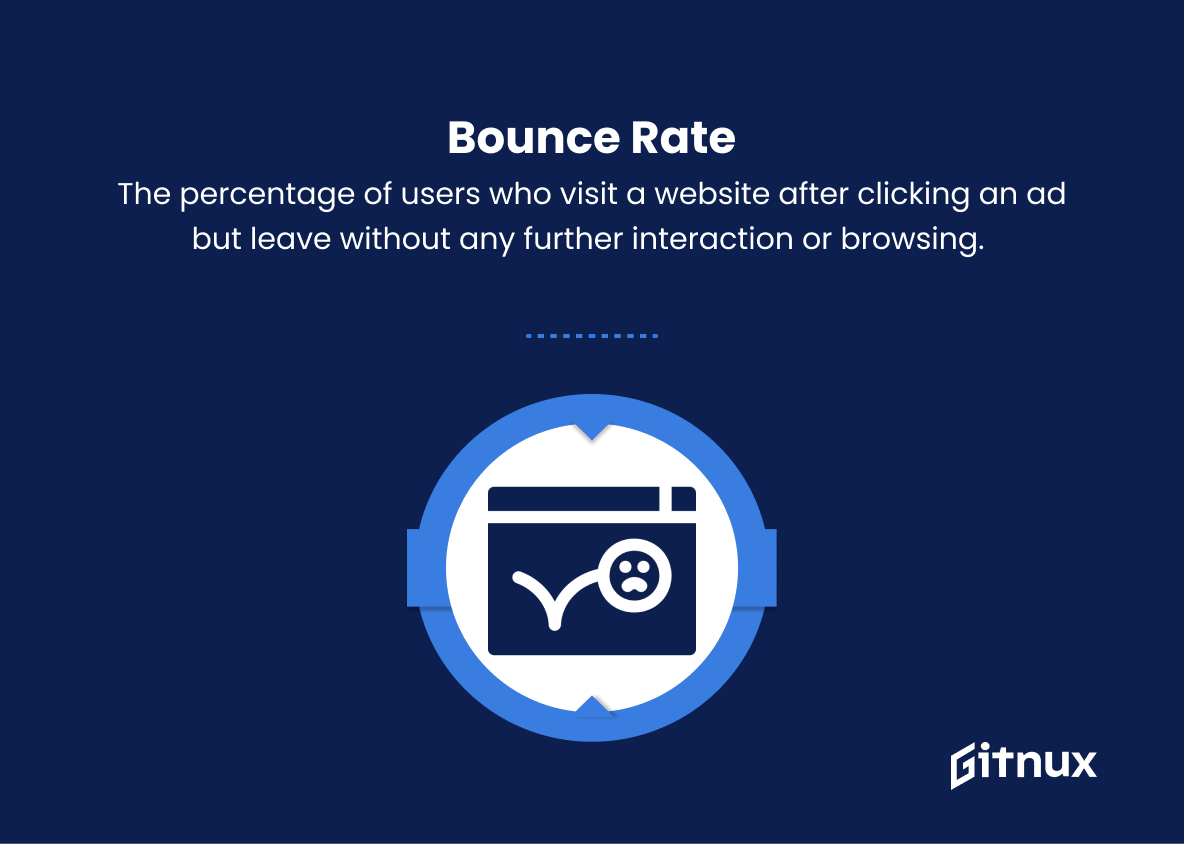
10. Bounce Rate
The percentage of users who visit a website after clicking an ad but leave without any further interaction or browsing. A high bounce rate might indicate a lack of relevance or poor user experience on the landing page.
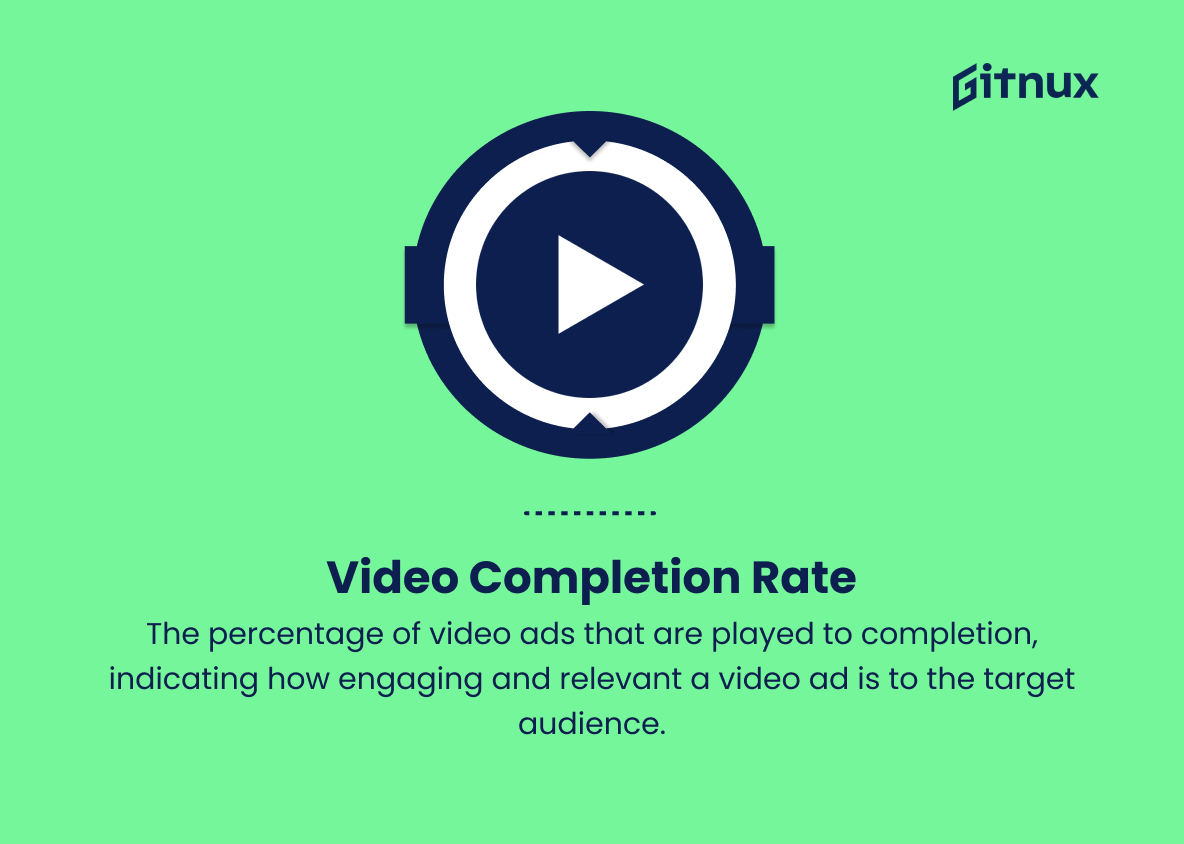
11. Video Completion Rate (VCR)
The percentage of video ads that are played to completion, indicating how engaging and relevant a video ad is to the target audience.
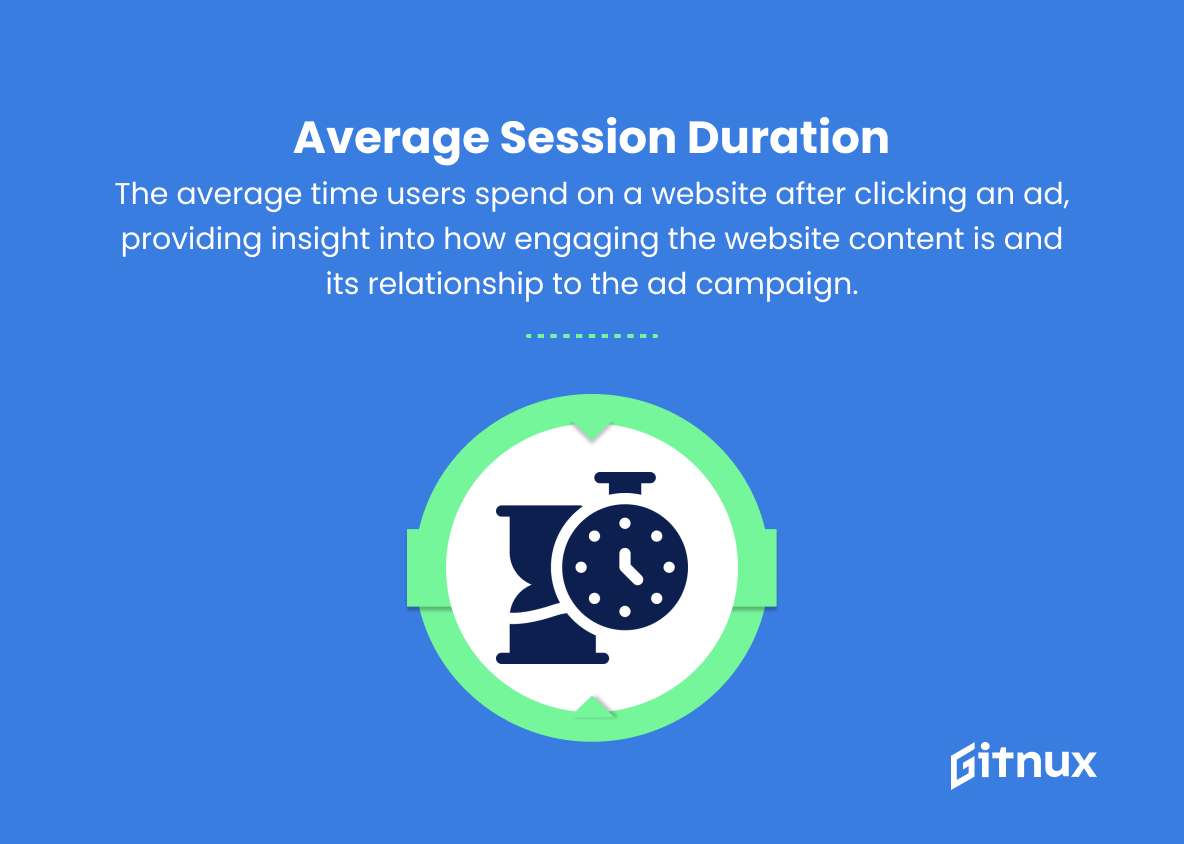
12. Average Session Duration
The average time users spend on a website after clicking an ad, providing insight into how engaging the website content is and its relationship to the ad campaign.
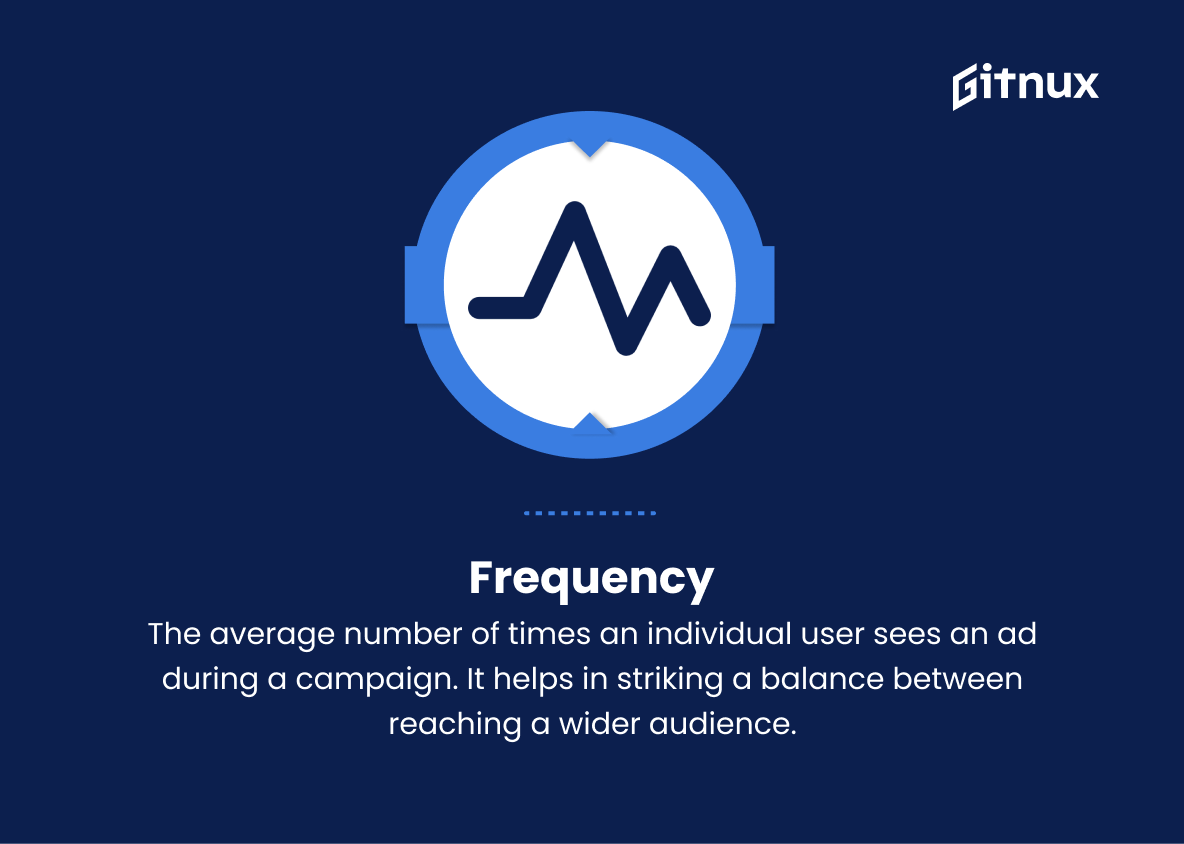
13. Frequency
The average number of times an individual user sees an ad during a campaign. It helps in striking a balance between reaching a wider audience and overexposing the ad to a single user.
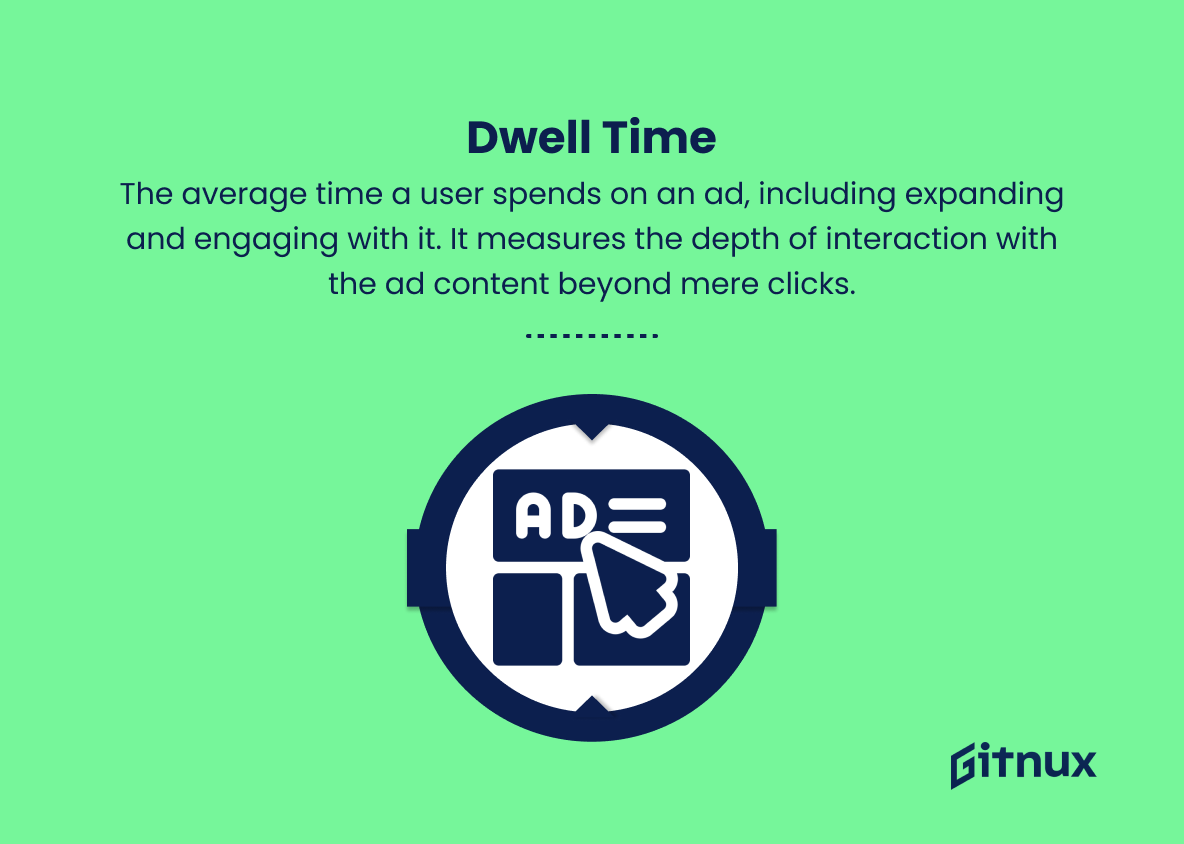
14. Dwell Time
The average time a user spends on an ad, including expanding and engaging with it. It measures the depth of interaction with the ad content beyond mere clicks.
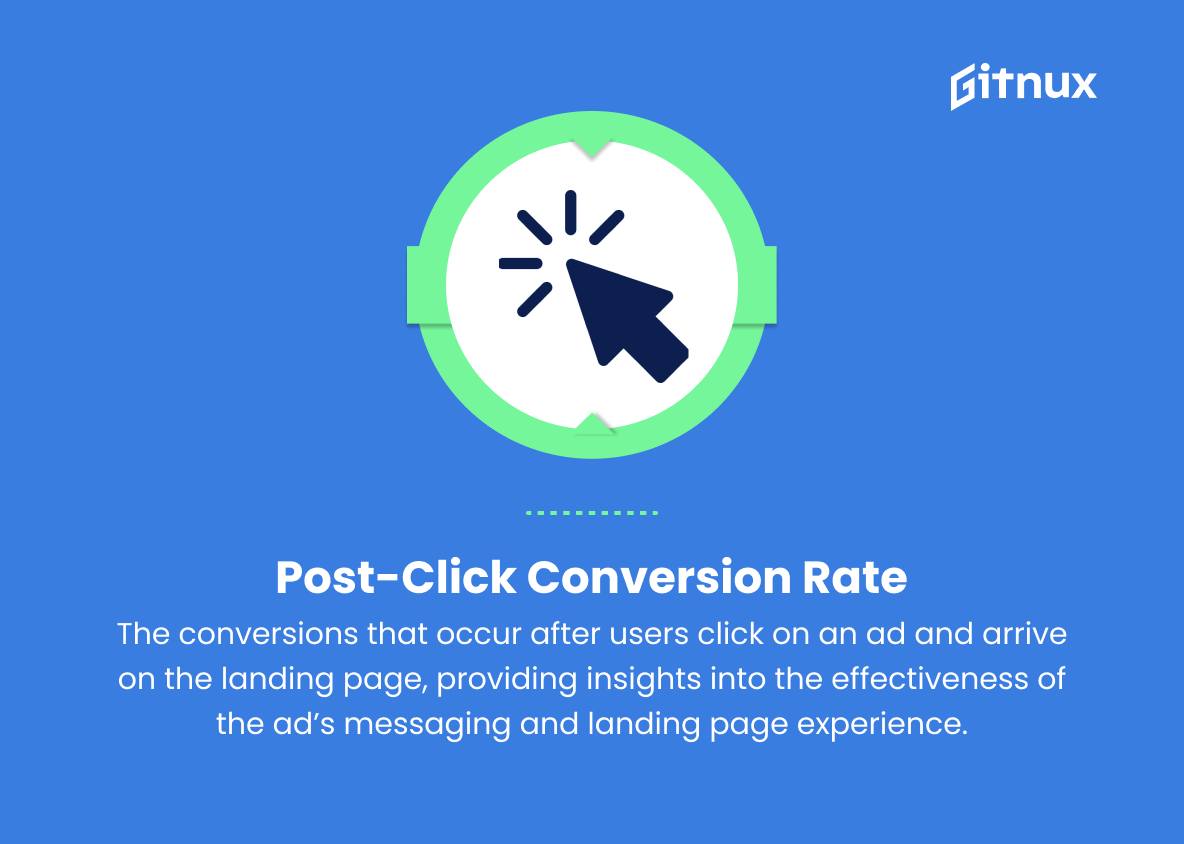
15. Post-Click Conversion Rate
The conversions that occur after users click on an ad and arrive on the landing page, providing insights into the effectiveness of the ad’s messaging and landing page experience.
Digital Advertising Metrics Explained
Digital Advertising Metrics measure ad campaign effectiveness and success. CTR shows engagement and ad relevance, while CPC and CPM evaluate cost efficiency. Conversion Rate, CPA, and ROAS assess desired actions and ROI. Impressions, Viewability Rate, and Engagement Rate measure reach, visibility, and resonance. Bounce Rate highlights relevance or landing page issues.
VCR shows video ad engagement and relevance. Session Duration, Frequency, Dwell Time, and Post-Click Conversion Rate provide insights into user interactions, ad exposure, and messaging. These metrics optimize campaigns, maximize reach, and achieve desired outcomes.
Conclusion
In closing, a comprehensive understanding of digital advertising metrics is crucial for businesses looking to thrive in today’s ever-evolving digital landscape. By analyzing these key performance indicators, such as impressions, clicks, engagement, and conversion rates, marketers can gain valuable insights into their campaigns’ performance and make informed decisions to optimize their marketing strategies.
As technology and consumer behavior continue to advance, being well-versed in the most relevant and impactful metrics will remain essential in ensuring that digital advertising efforts yield substantial returns on investment—keeping businesses on a path toward marketing success.
