


In today’s increasingly data-driven world, harnessing the power of analytics is essential for businesses to comprehend user behavior, improve customer experience, and achieve targeted growth. Google Analytics is undoubtedly one of the most widely used web analytics tools across industries. However, to truly unlock its potential and leverage its comprehensive offerings, understanding the Google Analytics API Metrics is crucial.
In this blog post, we will delve into the nuances of these metrics, their significance, and how you can strategically employ them to bolster your marketing efforts and drive informed business decisions. Join us as we guide you through this indispensable tool, aimed at empowering you with insights that enable you to stay a step ahead in the competitive digital landscape.
Google Analytics API Metrics You Should Know
1. Sessions (Sessions)
The total number of sessions (visits) to a website.
2. Users (Users)
The total number of unique visitors to a website.
3. New Users (New Users)
The number of first-time visitors to a website.
4. Percent New Sessions (Percent New Sessions)
The percentage of sessions by new visitors.
5. Session Duration (Session Duration)
The total duration (in seconds) of all sessions.
6. Avg. Session Duration (Avg. Session Duration)
The average duration (in seconds) of a session.
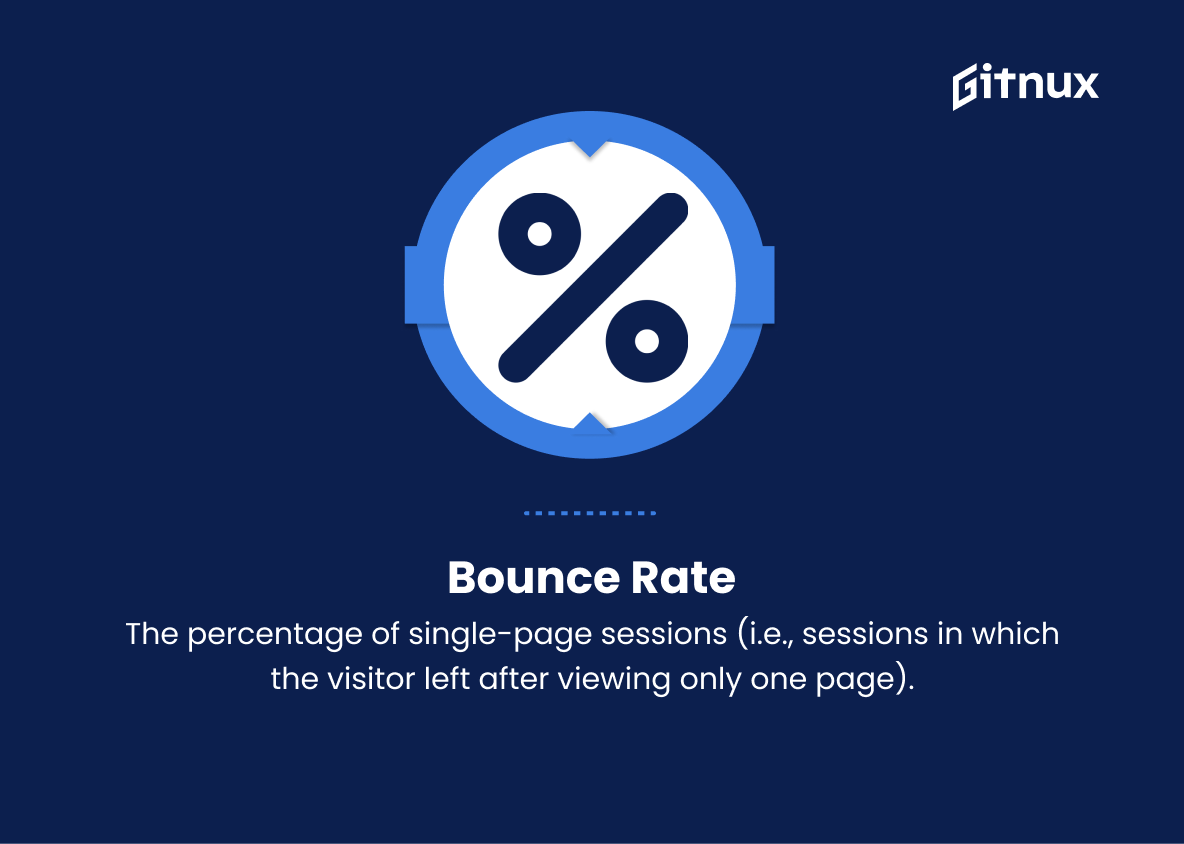
7. Bounce Rate (Bounce Rate)
The percentage of single-page sessions (i.e., sessions in which the visitor left after viewing only one page).
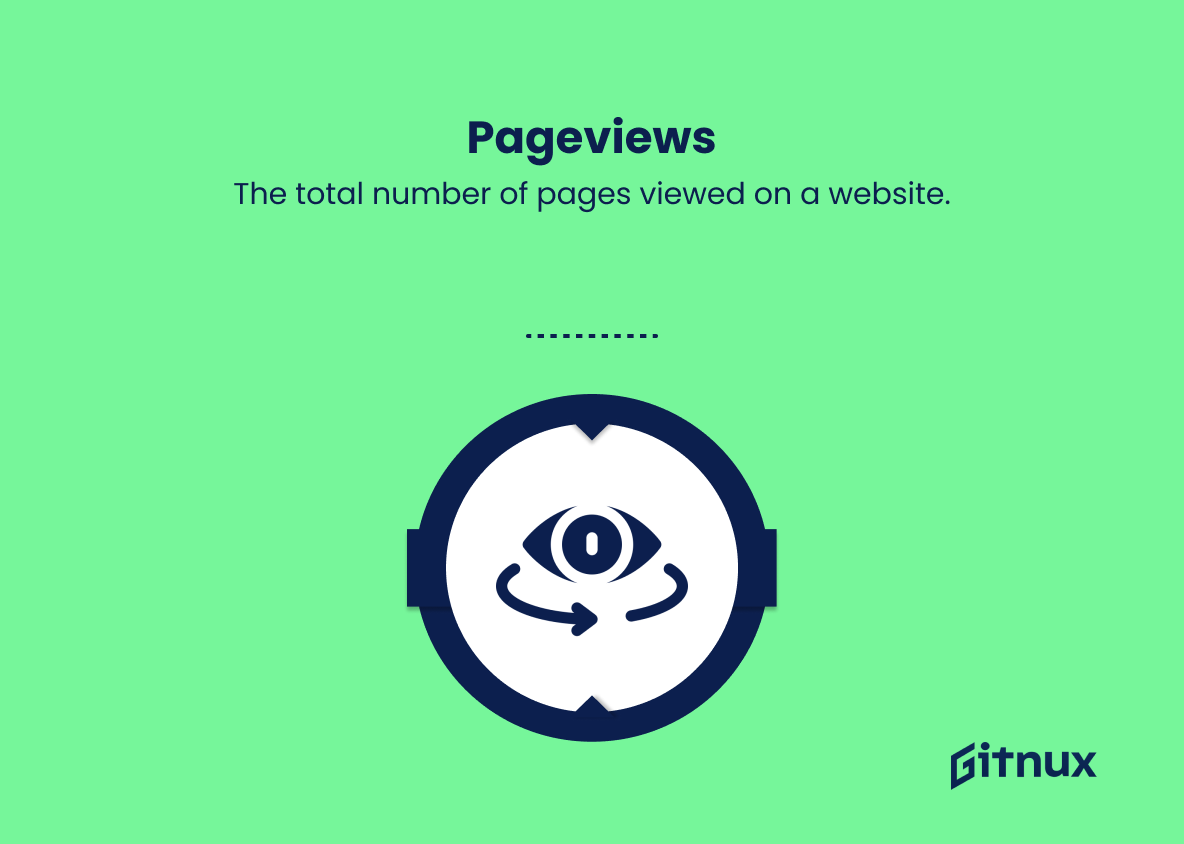
8. Pageviews (Pageviews)
The total number of pages viewed on a website.
9.Unique Page views (Unique Pageviews)
The number of unique page views, where repeated views of a single page are excluded.
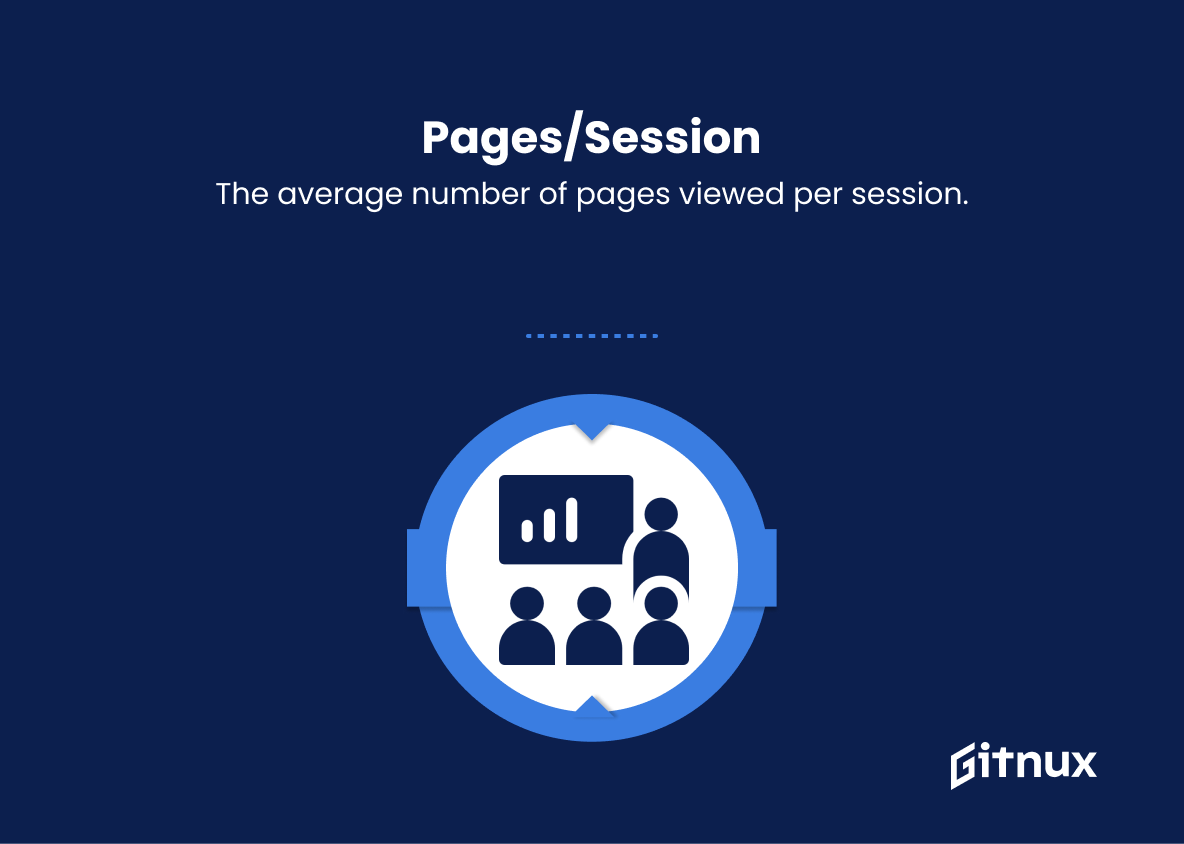
10. Page views Per Session (Pages/Session)
The average number of pages viewed per session.
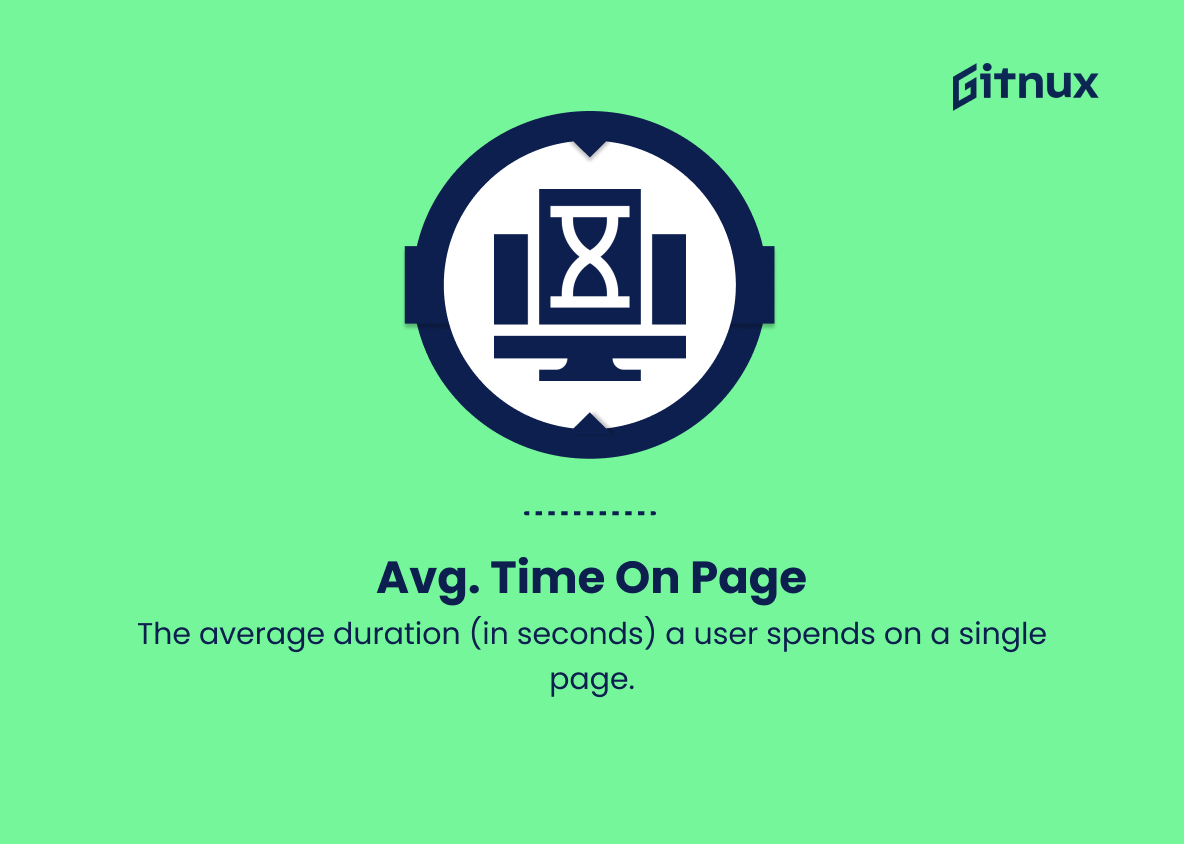
11. Avg. Time On Page (Avg. Time on Page)
The average duration (in seconds) a user spends on a single page.
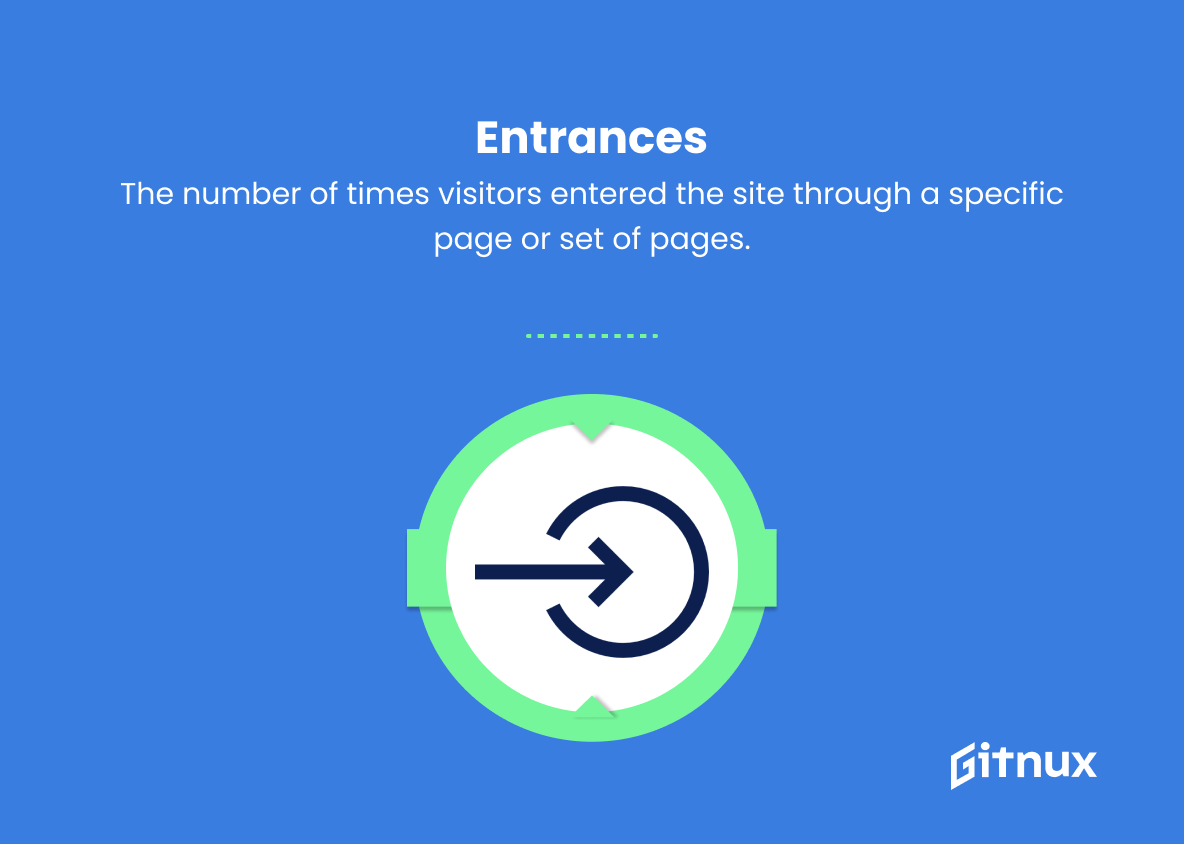
12. Entrances (Entrances)
The number of times visitors entered the site through a specific page or set of pages.
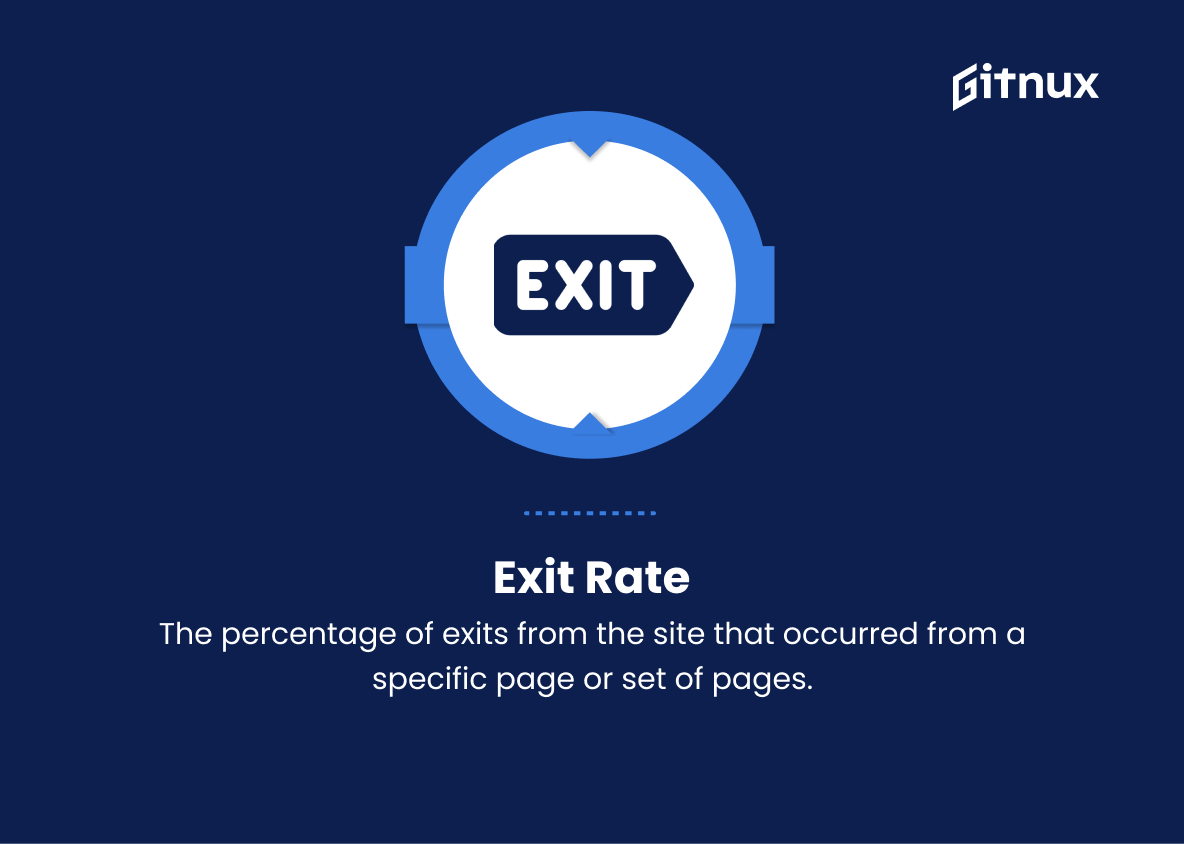
13. Exit Rate (Exit Rate)
The percentage of exits from the site that occurred from a specific page or set of pages.
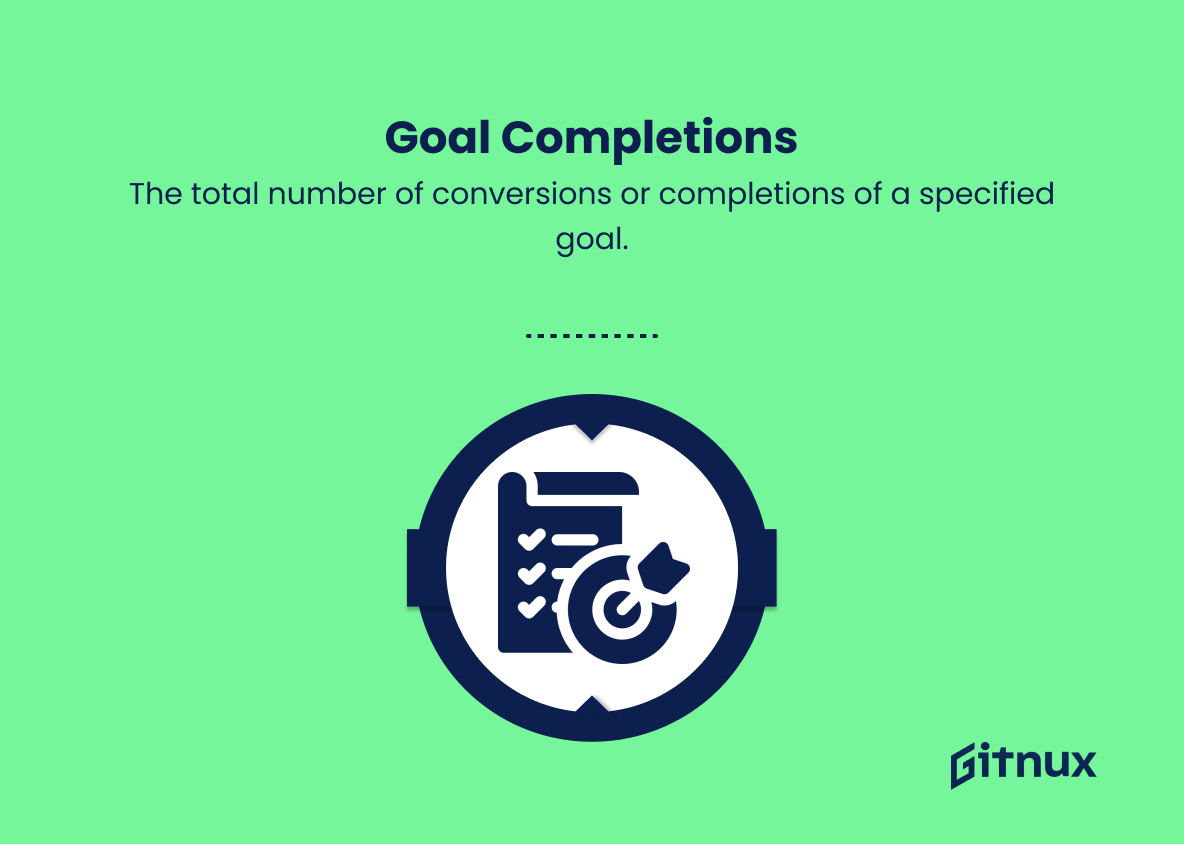
14. Goal Completions (Goal Completions)
The total number of conversions or completions of a specified goal.
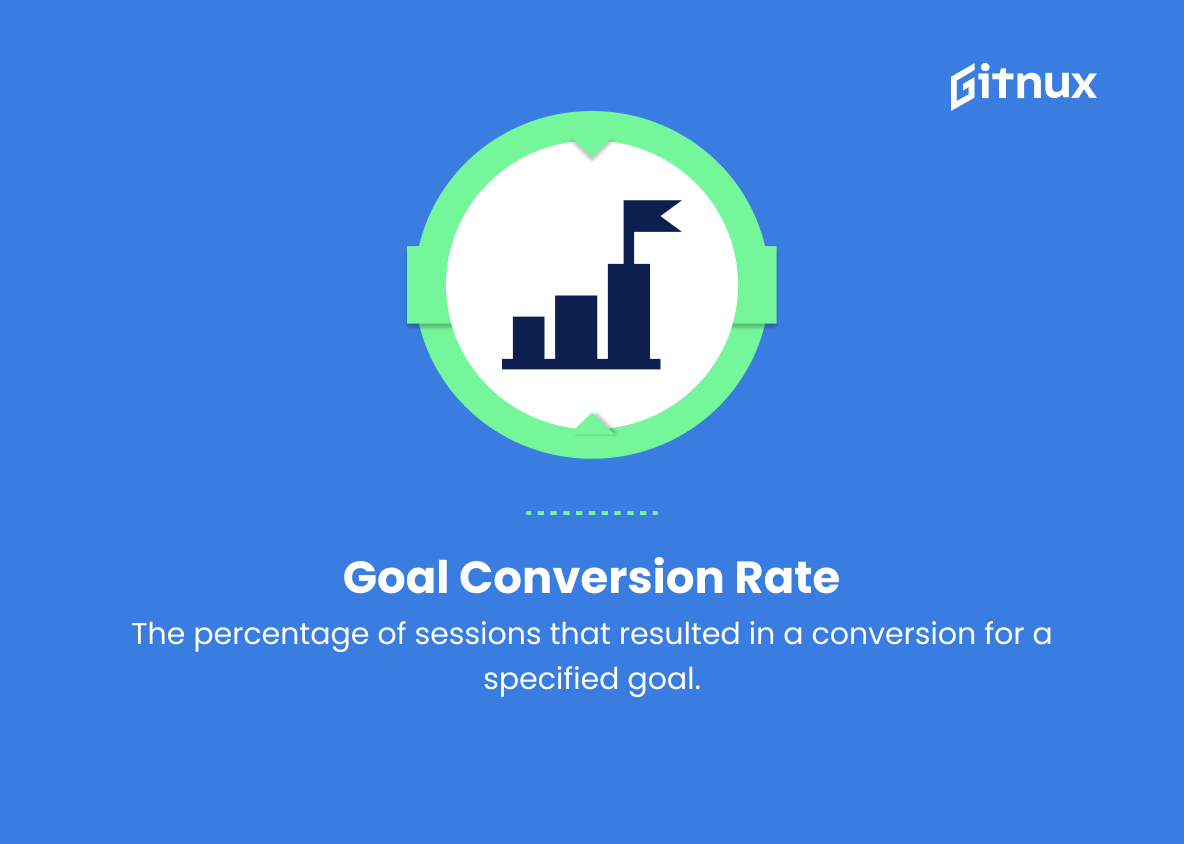
15. Goal Conversion Rate (Goal Conversion Rate)
The percentage of sessions that resulted in a conversion for a specified goal.
16. Ecommerce Conversion Rate (E-commerce Conversion Rate)
The percentage of sessions that led to an e-commerce transaction.
17. Transactions (Transactions)
The total number of e-commerce transactions on the website.
18. Transaction Revenue (Transaction Revenue)
The total revenue from e-commerce transactions on the website.
19. Revenue Per Transaction (Revenue per Transaction)
The average revenue per e-commerce transaction.
20. Page Load Time (Page Load Time)
The total time (in milliseconds) it took to load all pages on the site.
21. Avg. Page Load Time (Avg. Page Load Time)
The average time (in milliseconds) it takes for a page to load.
22. Device Category (Device Category)
Segment data based on devices used to access the site (desktop, mobile, tablet).
23. Source Medium (Source / Medium)
The source (e.g., Google) and medium (e.g., organic search) that brought a user to the site.
24. Channel Grouping (Channel Grouping)
Organizes sessions by default channel groupings, such as Direct, Organic Search, Social, etc.
25. Landing Page Path (Landing Page)
The first page a user sees during a session, useful for determining where users enter your website.
26. Exit Page Path (Exit Page)
The last page a user sees before leaving the site, useful for identifying pages with high exit rates.
Google Analytics API Metrics Explained
The Google Analytics API Metrics provide valuable insights into website performance and user behavior. All these metrics contribute to a comprehensive understanding of website effectiveness and user preferences, enabling data-driven decision-making and website optimization.
Conclusion
In summary, the Google Analytics API Metrics provide a powerful, flexible, and insightful tool for businesses to fully understand and optimize their online presence. By leveraging the vast array of metrics available, data-driven decisions can be made to enhance the user experience, increase conversion rates, and ultimately drive growth. As the digital landscape continues to evolve and expand, the importance of leveraging these metrics effectively will only grow.
Stay ahead of the curve by continually analyzing, adjusting, and refining your approach to harness the full potential of Google Analytics API Metrics, ensuring your business remains consistently competitive in the ever-changing digital market.
