In today’s data-driven digital landscape, businesses are constantly looking for ways to optimize their online presence and maximize returns on their marketing investments. One of the most critical performance indicators in this quest is the conversion rate – a powerful metric that holds the key to understanding how effectively your website, campaigns, and sales funnel are converting visitors into customers.
In this in-depth blog post, we will explore the nuances of conversion rate metrics, discuss the strategies and tools for measuring and improving them, and showcase real-life examples that demonstrate the impact of optimizing conversion rates on the success of your business. Join us as we delve into the world of conversion rate metrics and discover how they can unlock the full potential of your digital marketing efforts.
Conversion Rate Metrics You Should Know
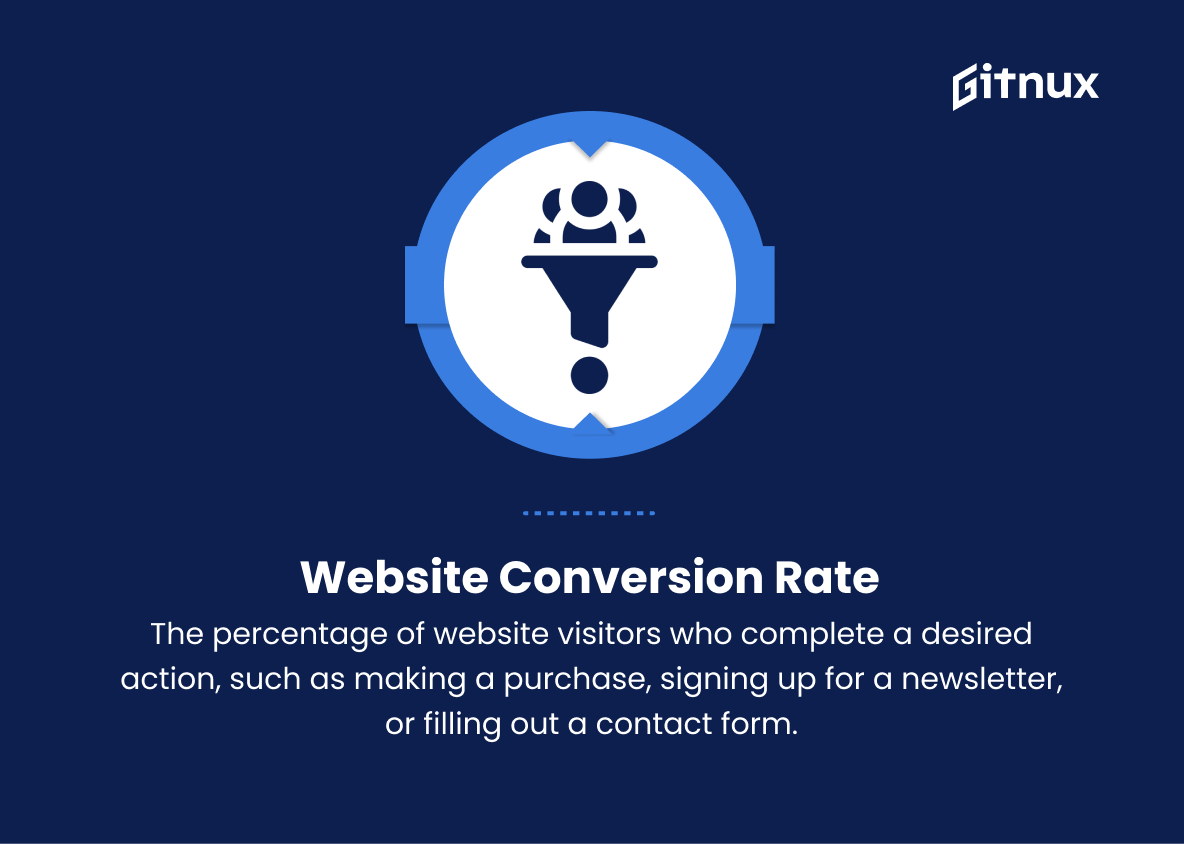
1. Website Conversion Rate
The percentage of website visitors who complete a desired action, such as making a purchase, signing up for a newsletter, or filling out a contact form. This metric helps gauge the effectiveness of a website in converting its visitors.
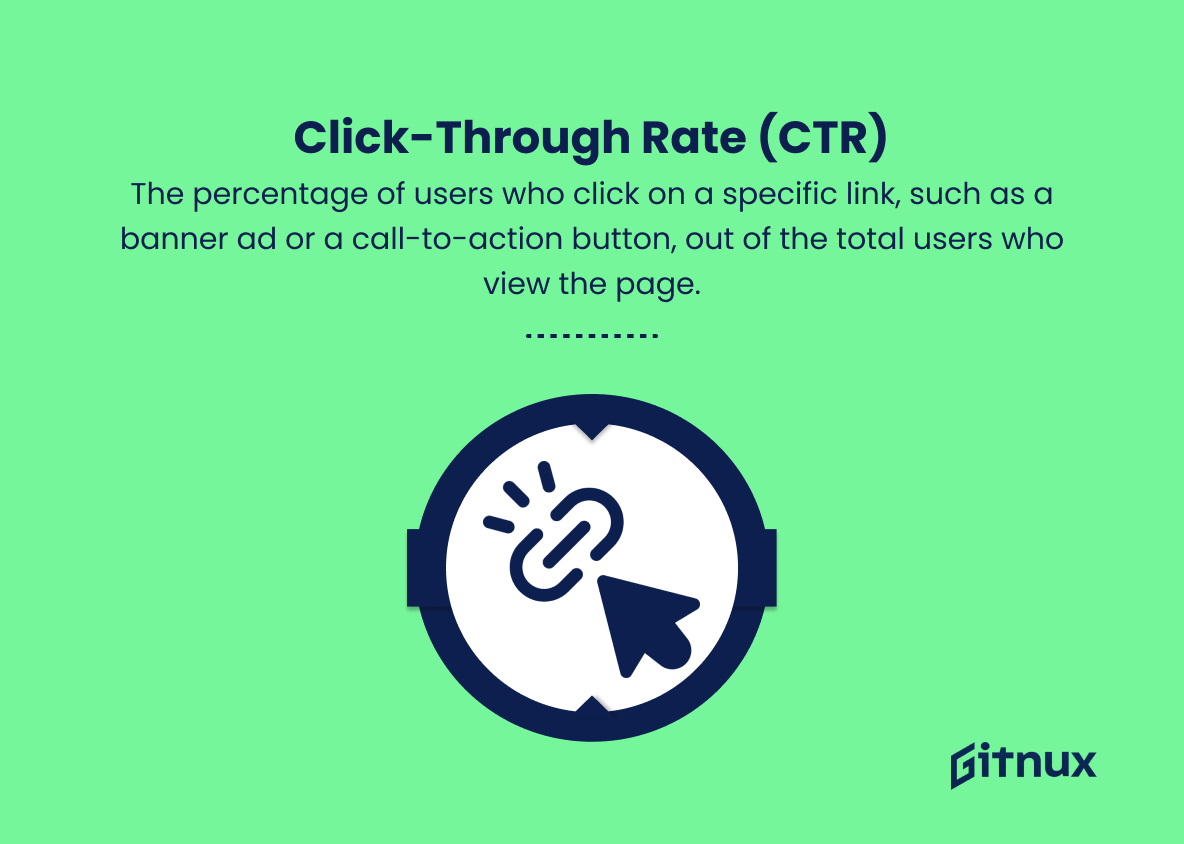
2. Click-through Rate (CTR)
The percentage of users who click on a specific link, such as a banner ad or a call-to-action button, out of the total users who view the page. CTR helps measure the effectiveness of marketing efforts in driving users to take action.
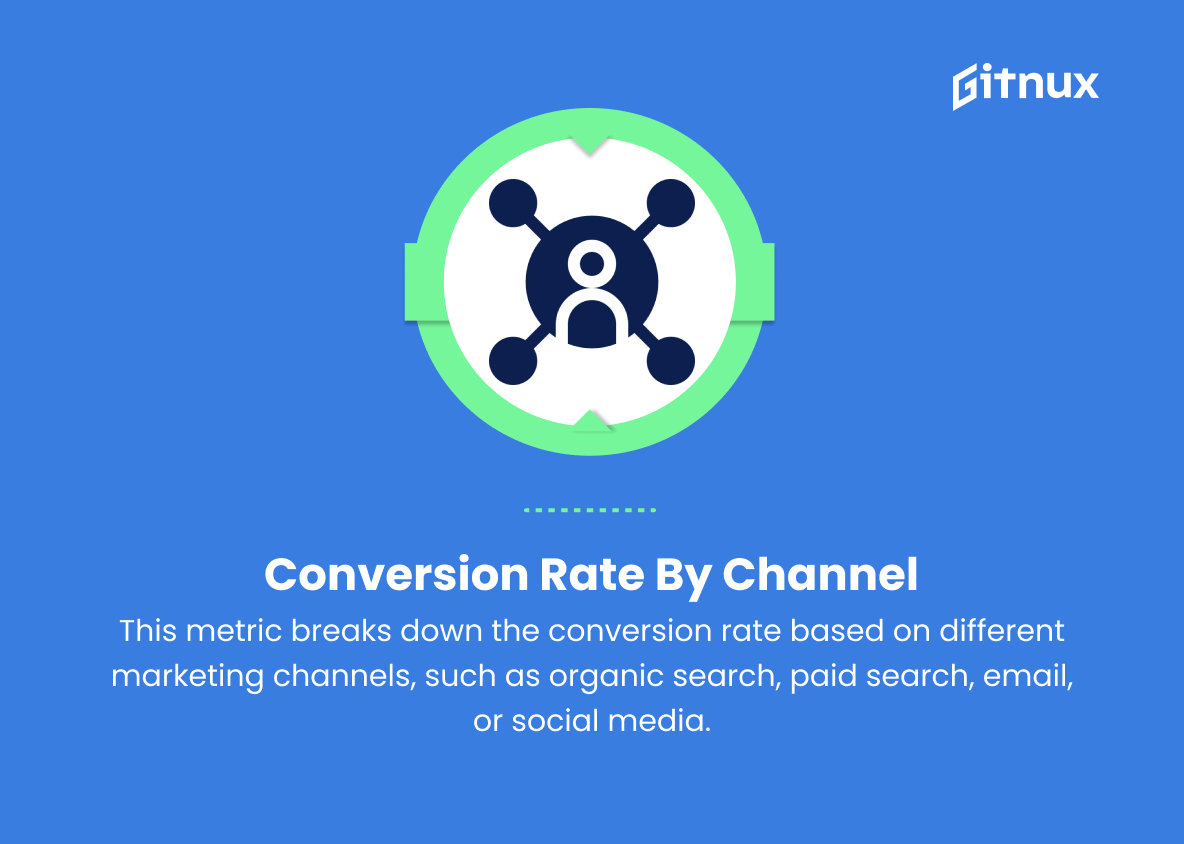
3. Conversion Rate by Channel
This metric breaks down the conversion rate based on different marketing channels, such as organic search, paid search, email, or social media. This helps identify which channels are most effective in driving conversions.
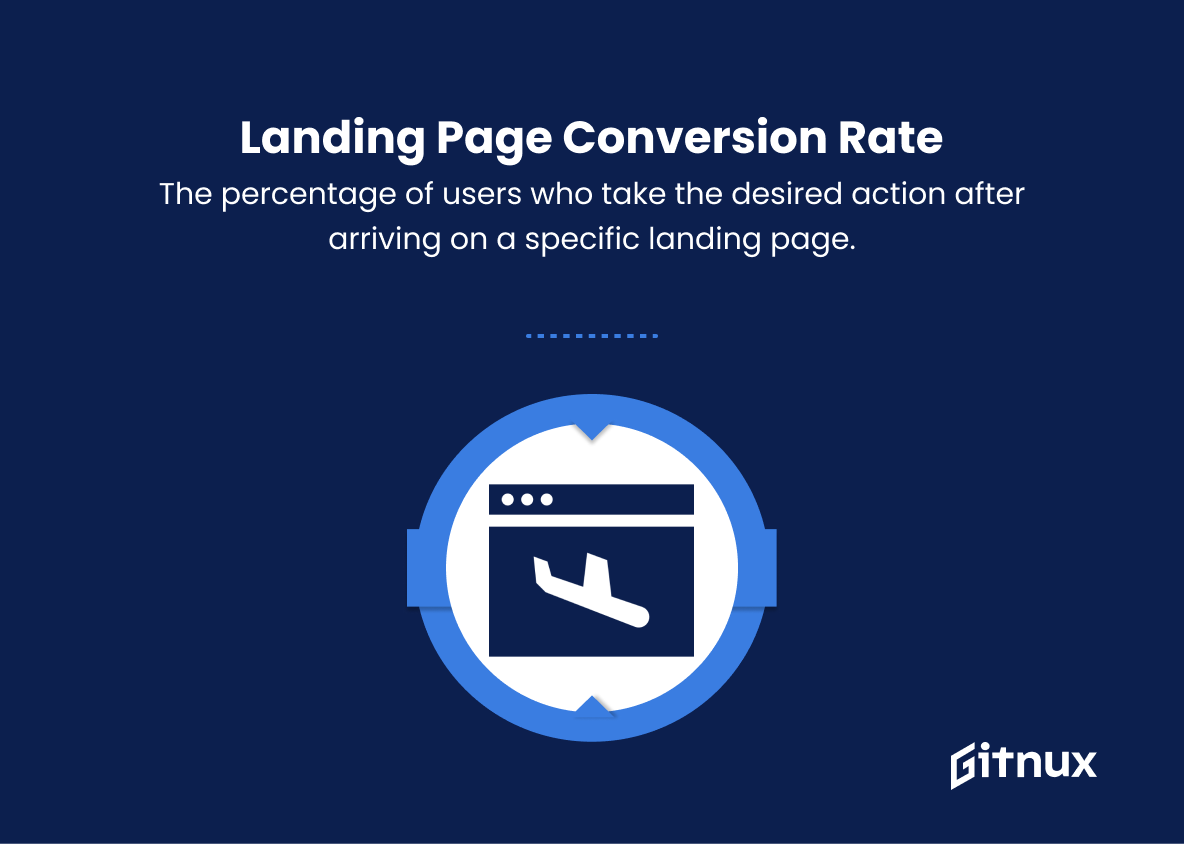
4. Landing Page Conversion Rate
The percentage of users who take the desired action after arriving on a specific landing page. This helps measure the effectiveness of a landing page in driving conversions and can be used to test and optimize different designs and content.
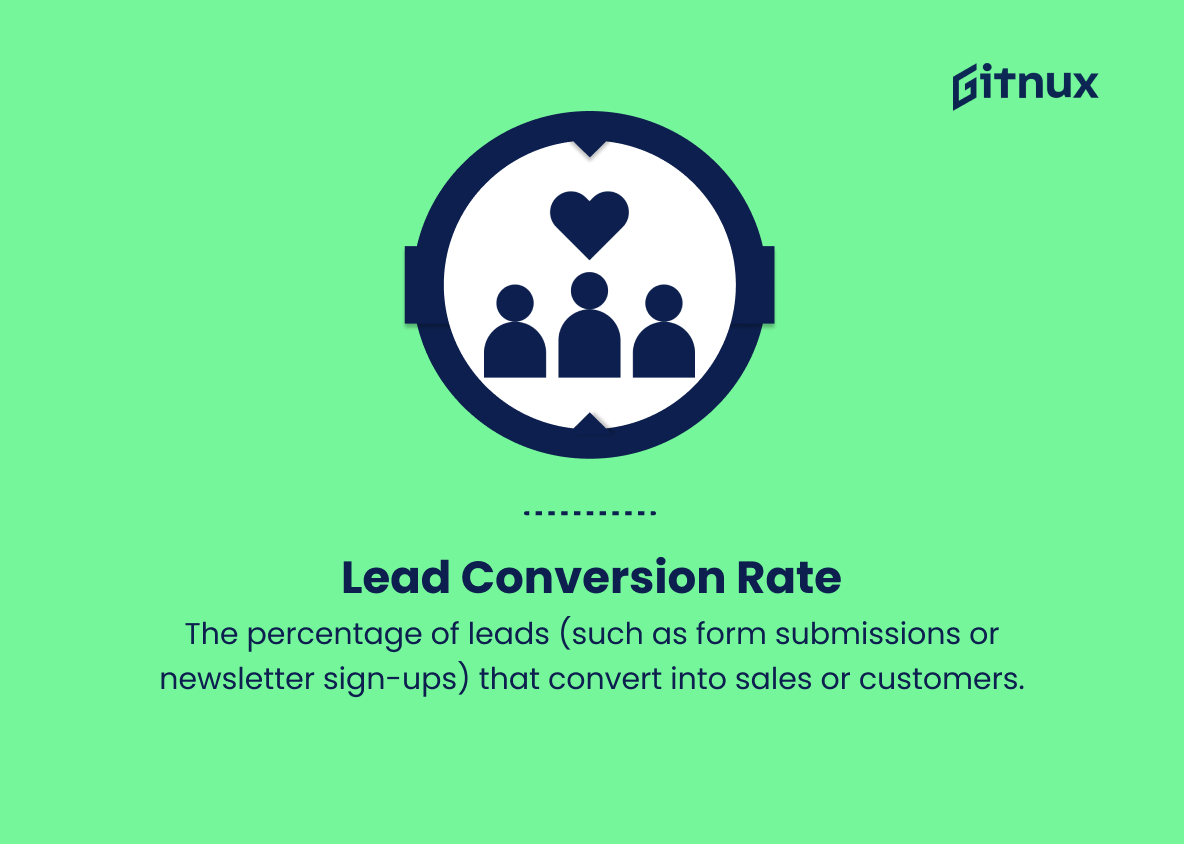
5. Lead Conversion Rate
The percentage of leads (such as form submissions or newsletter sign-ups) that convert into sales or customers. This metric helps evaluate the effectiveness of a company’s lead generation efforts and sales processes.
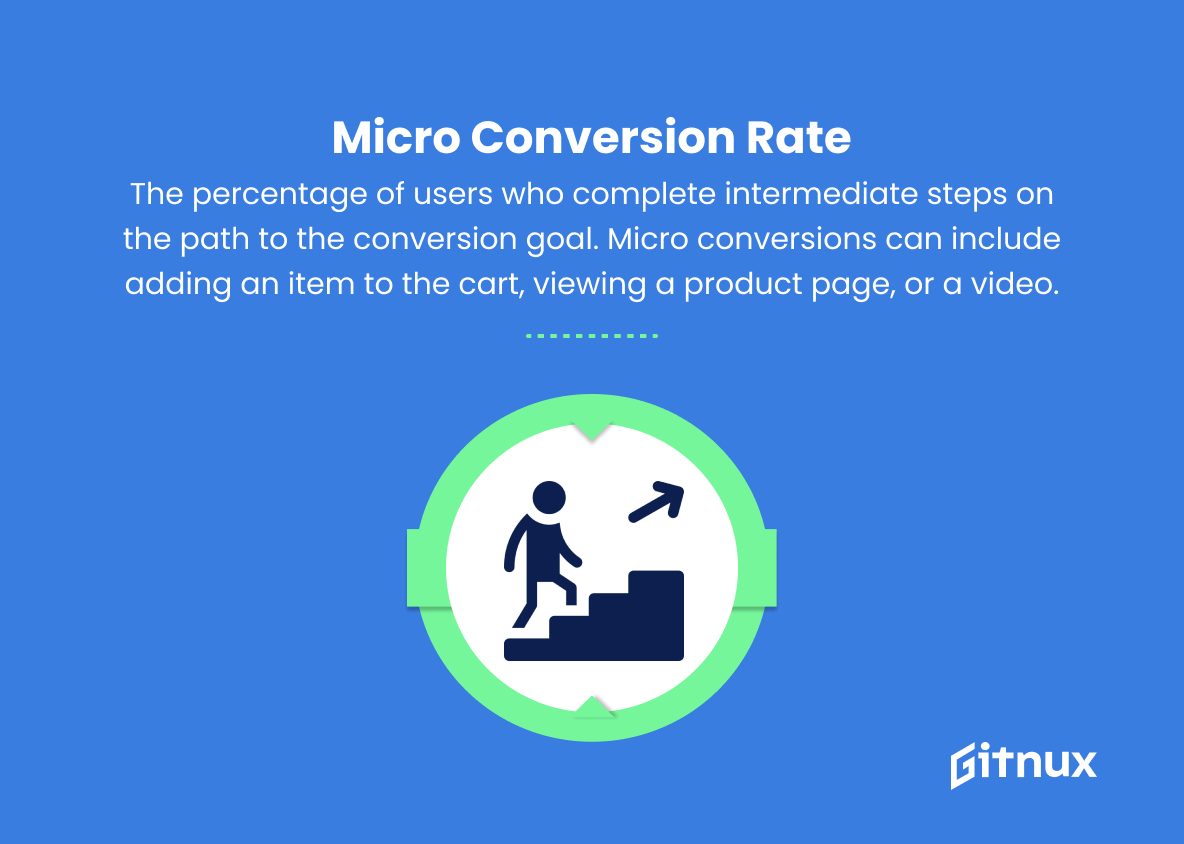
6. Micro Conversion Rate
The percentage of users who complete intermediate steps on the path to the primary conversion goal. Micro conversions can include actions like adding an item to the shopping cart, viewing a product page, or watching a video. Tracking micro conversions can help identify areas for improvement in the customer journey and overall conversion funnel.
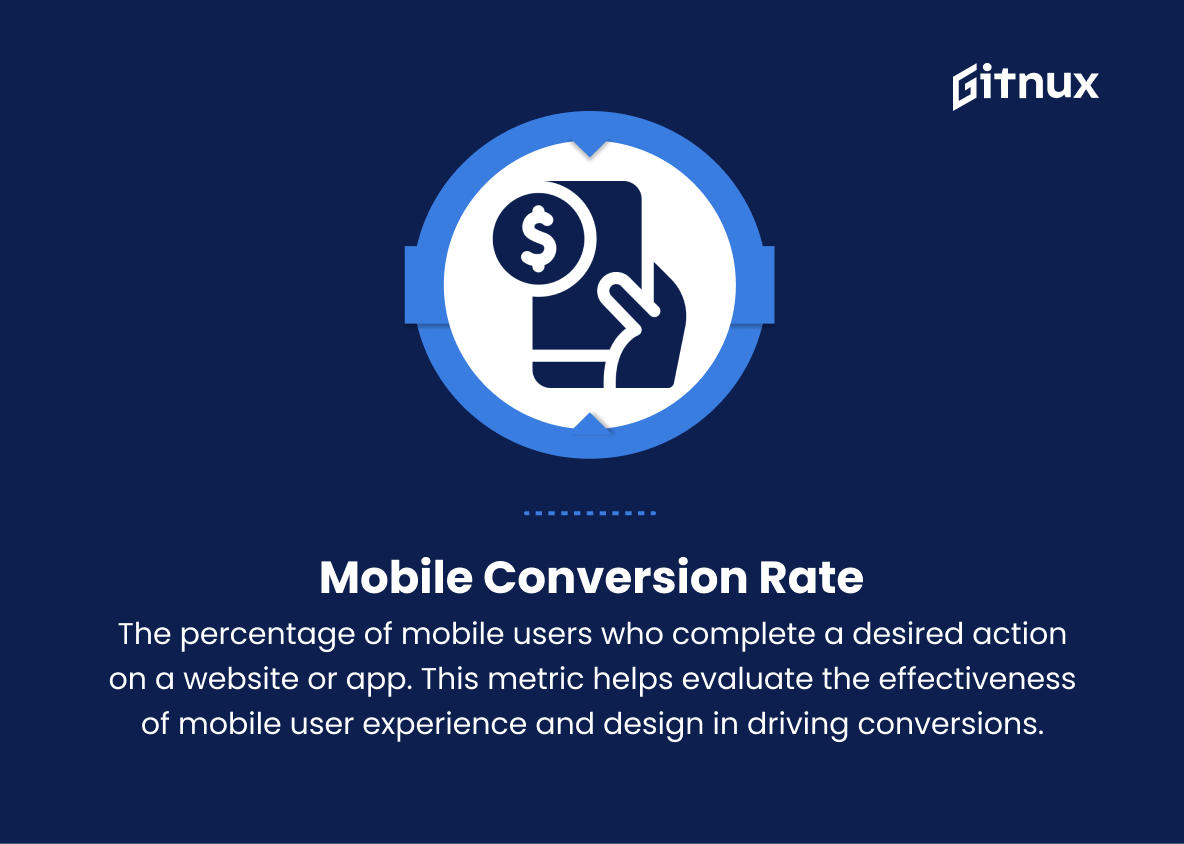
7. Mobile Conversion Rate
The percentage of mobile users who complete a desired action on a website or app. This metric helps evaluate the effectiveness of mobile user experience and design in driving conversions.
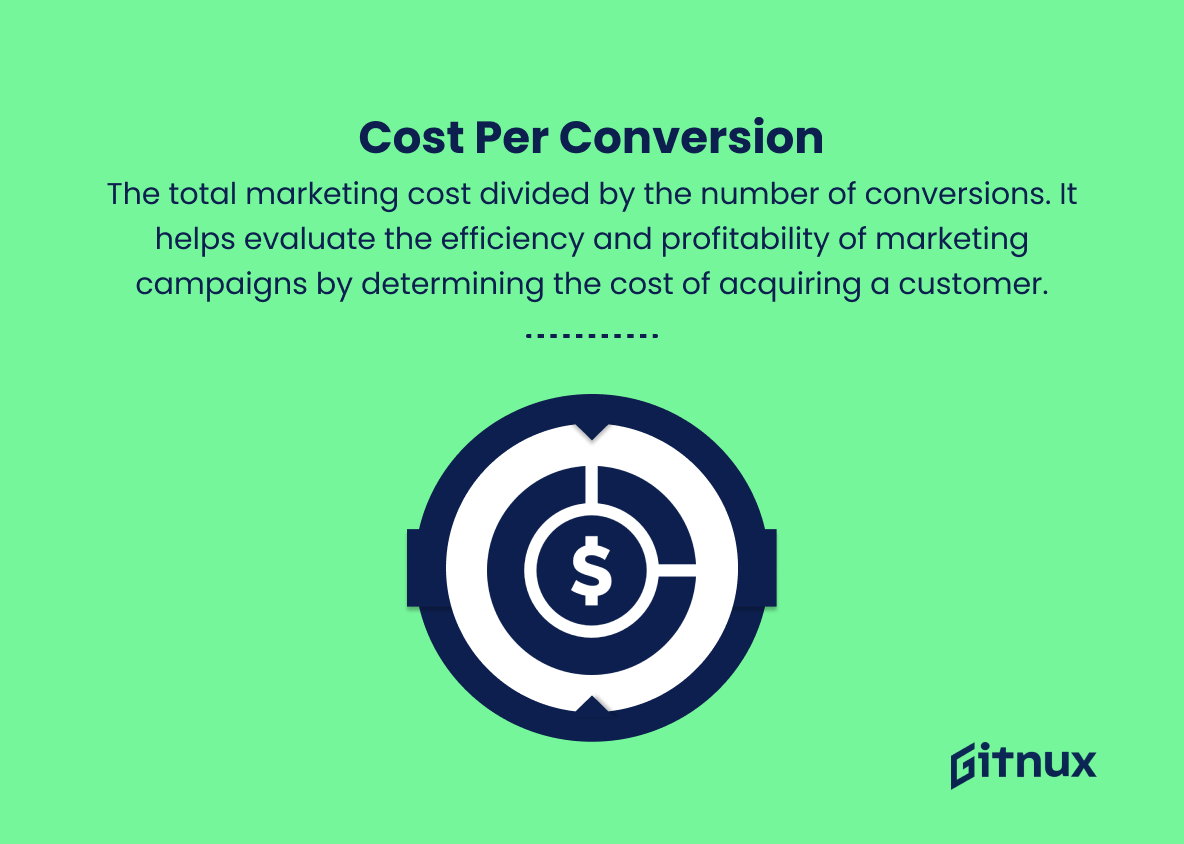
8. Cost per Conversion
The total marketing cost divided by the number of conversions. This metric helps evaluate the efficiency and profitability of marketing campaigns by determining how much it costs to acquire a customer.
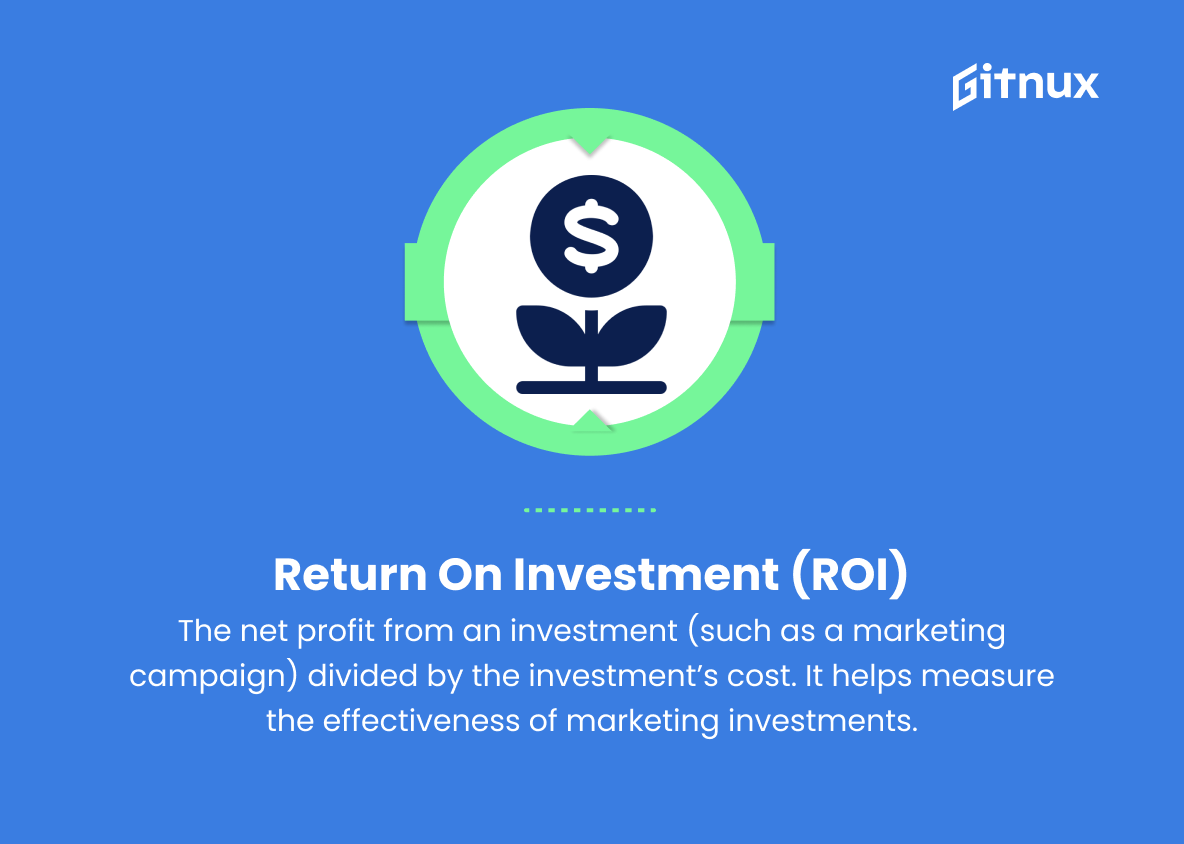
9. Return on Investment (ROI)
The net profit from an investment (such as a marketing campaign) divided by the investment’s cost. This metric helps measure the effectiveness of marketing investments in driving conversions and revenue.
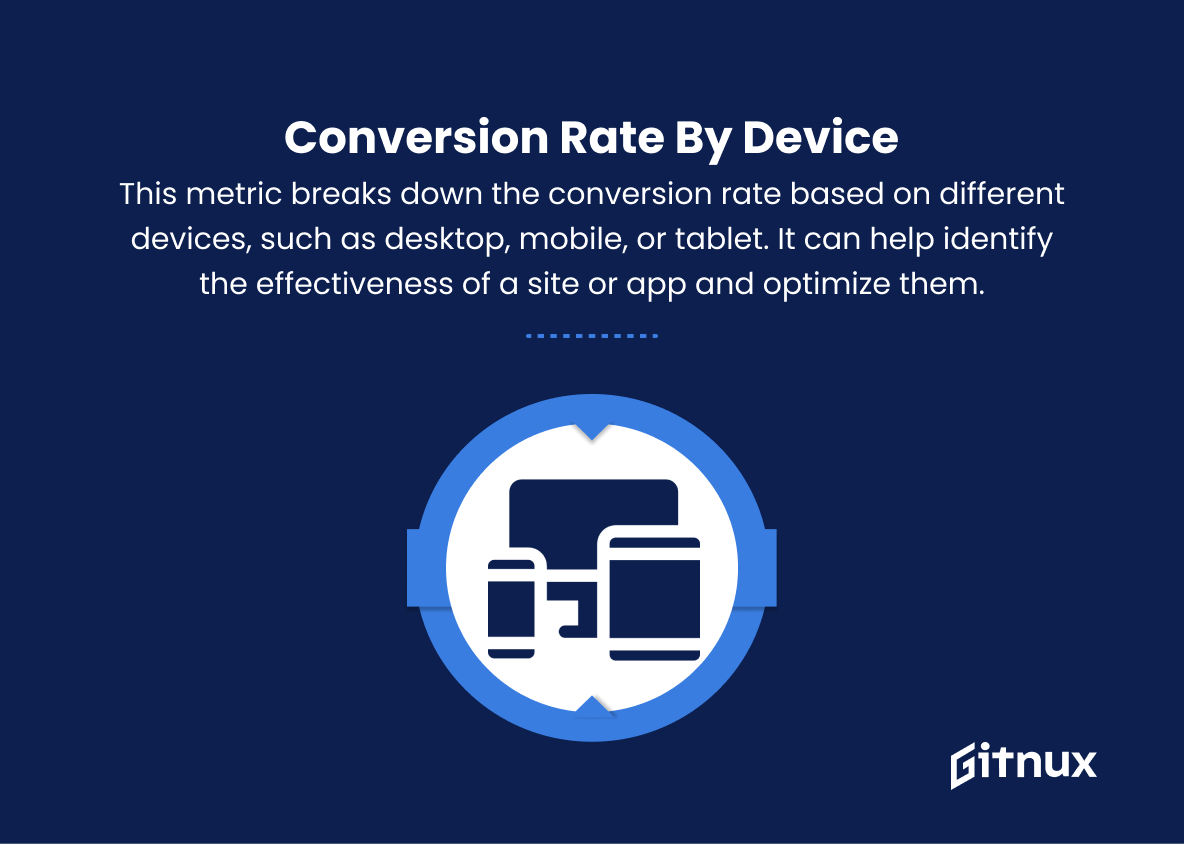
10. Conversion Rate by Device
This metric breaks down the conversion rate based on different devices, such as desktop, mobile, or tablet. This can help identify the effectiveness of a website or app in driving conversions on various devices and can guide optimizations for device-specific user experiences.
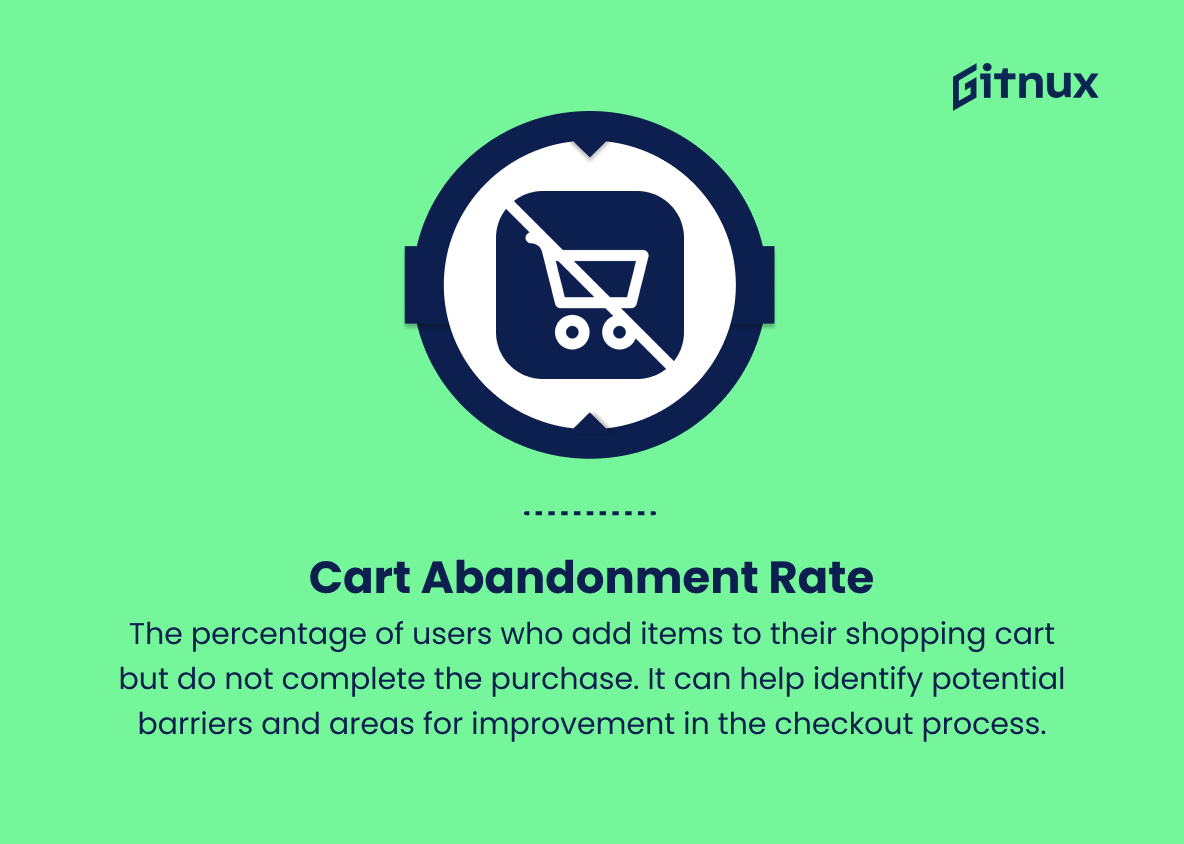
11. Cart Abandonment Rate
The percentage of users who add items to their shopping cart but do not complete the purchase. This metric can help identify potential barriers to purchase and areas for improvement in the checkout process.
Conversion Rate Metrics Explained
Conversion Rate Metrics play a crucial role in understanding and optimizing the performance of marketing efforts and the overall user experience on a website or app. They help measure the effectiveness of a website in driving desired actions, such as purchases or sign-ups, and can pinpoint which marketing channels, landing pages, or devices are most successful at driving conversions. By tracking micro conversions, such as viewing a product page or adding an item to a cart, businesses can identify customer journey bottlenecks and areas for improvement.
Monitoring mobile conversion rates is essential for optimizing mobile user experiences and ensuring that users on different devices can seamlessly convert. Additionally, metrics like cost per conversion and return on investment (ROI) help evaluate the efficiency and profitability of marketing campaigns, enabling businesses to allocate resources more effectively. By examining cart abandonment rates, companies can identify and remedy barriers to purchase within the checkout process, ultimately improving overall conversion rates and revenue.
Conclusion
In conclusion, understanding and analyzing conversion rate metrics is critical for any business that seeks to maximize its online potential. By identifying the key performance indicators (KPIs) and employing data-driven strategies, businesses can monitor and optimize the customer’s journey, leading to increased engagement, higher conversion rates, and ultimately, greater profits. It’s essential to consistently analyze your metrics, making adjustments where necessary and always striving for improvement. As digital marketing continues to evolve, staying well-informed and agile in your approach will help your business stay ahead of the competition and secure long-term success.
