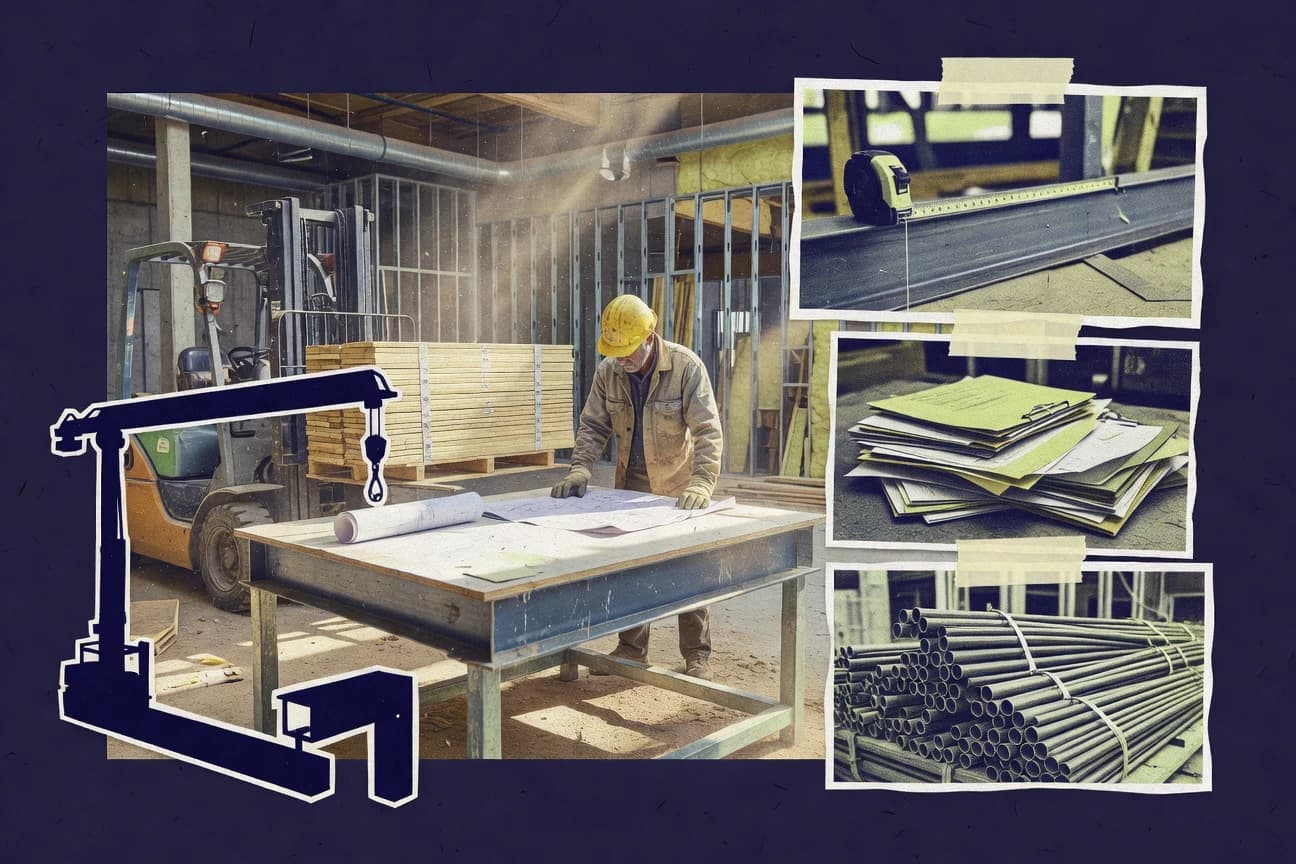

Commercial General Contracting is dealing with a wide mix of pressure points and opportunities, and the totals are eye opening. US nonresidential construction reached $1.08 trillion in 2023 while contractors still reported a 78% struggle filling craft roles and widespread schedule slips. That tension between demand and capacity shows up again in labor wages, change order impacts, safety trends, and cash flow constraints.
Key Takeaways
- $1.08 trillion nonresidential (commercial-like) construction put in place in the US in 2023
- 5.9% compound annual growth rate (CAGR) for US commercial construction spending from 2024 to 2028 (forecast estimate)
- US architect and engineering services revenue reached $359.3 billion in 2023, based on IBISWorld industry market research output (A&E services market size estimate for 2023)
- 78% of contractors reported they had trouble filling specific construction craft positions in 2023
- $31.40 average hourly wage rate for construction laborers in the US (construction industry wage estimate for 2023)
- 1.7% average annual increase in construction equipment rental rates in 2024 (BLS PPI for equipment rental)
- 57% of construction firms use mobile devices for field management (2023 survey statistic from Dodge Construction Network/industry report)
- 12.4% average reduction in change order frequency reported by contractors using standardized estimating software workflows (benchmark)
- 6.1% improvement in on-time completion when using integrated project controls (IPD/controls practice metric from industry research)
- US construction deaths increased by 5% in 2022 vs 2021 (fatal work injury count trend from BLS Census of Fatal Occupational Injuries)
- Fatal work injuries in construction accounted for 20% of all workplace fatalities in the US in 2022 (BLS CFOI)
- In 2023, 46% of surveyed contractors expected bid prices to increase over the next 6 months (Dodge construction outlook survey)
- 21% of contractors reported average project margins of 5%–10% in 2023 (industry survey)
- 2%–3% cost increase average for projects experiencing major change orders (systematic review of change order impacts)
- 25% of surveyed contractors reported that cash flow constraints reduced capacity to bid new work in 2023
In 2023, rising costs and labor shortages drove productivity and schedule pressure across US construction.
Related reading
01 · Category
Market Size8 stats
01
$1.08 trillion nonresidential (commercial-like) construction put in place in the US in 2023
02
5.9% compound annual growth rate (CAGR) for US commercial construction spending from 2024 to 2028 (forecast estimate)
03
US architect and engineering services revenue reached $359.3 billion in 2023, based on IBISWorld industry market research output (A&E services market size estimate for 2023)
04
The US construction materials market is projected to reach $1.01 trillion in 2024, based on a 2024 market outlook report published by MarketsandMarkets
05
The US modular construction market reached $7.7 billion in 2023, based on a 2024 report published by Fortune Business Insights
06
The global construction equipment rental market is expected to reach $96.6 billion by 2030, based on a 2024 report by Fortune Business Insights (rentals category includes equipment rental services)
07
US productivity growth in nonresidential construction labor averaged 1.2% per year from 2010 to 2022 (BLS Multifactor Productivity trend for construction, seasonally adjusted where applicable, annual average growth as reported by BLS MFP documentation)
08
Construction accounted for 7.0% of total US gross value added (GVA) in 2022, based on Eurostat’s reporting adapted for US comparisons by reputable global analytics in a public OECD-based dataset explanation
Interpretation
Market Size Interpretation
Market size for commercial general contracting is underpinned by strong scale and momentum, with $1.08 trillion in nonresidential construction put in place in the US in 2023 and forecast US commercial spending growing at a 5.9% CAGR from 2024 to 2028.
02 · Category
Labor & Costs5 stats
01
78% of contractors reported they had trouble filling specific construction craft positions in 2023
02
$31.40average hourly wage rate for construction laborers in the US (construction industry wage estimate for 2023)
03
1.7% average annual increase in construction equipment rental rates in 2024 (BLS PPI for equipment rental)
04
2.1% inflation in construction labor costs for contractors in 2024 (BLS Employment Cost Index for construction)
05
17% of contractors reported schedule slippage costs exceeding $250,000 per project in 2023 (contracting survey estimate)
Interpretation
Labor & Costs Interpretation
From a Labor and Costs perspective, the combination of 78% of contractors struggling to fill craft roles and 2.1% inflation in construction labor costs in 2024 suggests contracting margins and staffing stability are coming under steady pressure as schedule slippage can also be severe, with 17% of projects seeing costs over $250,000.
03 · Category
Technology & Productivity3 stats
01
57% of construction firms use mobile devices for field management (2023 survey statistic from Dodge Construction Network/industry report)
02
12.4% average reduction in change order frequency reported by contractors using standardized estimating software workflows (benchmark)
03
6.1% improvement in on-time completion when using integrated project controls (IPD/controls practice metric from industry research)
Interpretation
Technology & Productivity Interpretation
For the Technology & Productivity angle, firms that digitize work see measurable gains, with 57% using mobile devices for field management and contractors reporting a 12.4% drop in change order frequency from standardized estimating workflows, plus a 6.1% improvement in on time completion when integrated project controls are in place.
04 · Category
Industry Trends4 stats
01
US construction deaths increased by 5% in 2022 vs 2021 (fatal work injury count trend from BLS Census of Fatal Occupational Injuries)
02
Fatal work injuries in construction accounted for 20% of all workplace fatalities in the US in 2022 (BLS CFOI)
03
In 2023, 46% of surveyed contractors expected bid prices to increase over the next 6 months (Dodge construction outlook survey)
04
4.5% increase in OSHA recordable injury rate for construction establishments in 2023 compared to 2022 (BLS/OSHA-related trend series)
Interpretation
Industry Trends Interpretation
Industry trends in commercial general contracting point to mounting risk and cost pressure as US construction deaths rose 5% in 2022 and construction made up 20% of all workplace fatalities, while in 2023 46% of contractors expected bid prices to increase and the OSHA recordable injury rate climbed 4.5% versus 2022.
More related reading
05 · Category
Profitability & Risks3 stats
01
21% of contractors reported average project margins of 5%–10% in 2023 (industry survey)
02
2%–3% cost increase average for projects experiencing major change orders (systematic review of change order impacts)
03
25% of surveyed contractors reported that cash flow constraints reduced capacity to bid new work in 2023
Interpretation
Profitability & Risks Interpretation
In the Commercial General Contracting industry, profitability is being squeezed as only 21% of contractors report 5%–10% margins in 2023 while change orders add 2%–3% on average and cash flow constraints stop 25% from bidding new work.
06 · Category
Safety And Risk3 stats
01
4.3% of US construction establishments had injuries or illnesses involving days away from work and job transfer or restriction in 2022, based on OSHA BLS SOII injury/illness incidence rate for construction (NAICS 23)
02
Construction represented 23% of all fatal workplace injuries in the US in 2022, according to National Safety Council analysis using BLS CFOI data
03
12% of construction firms report that they have experienced at least one work-related safety incident that resulted in a regulatory fine or penalty in the past 12 months, based on the 2024 Associated Builders and Contractors (ABC) safety survey results published by ABC Newsroom
Interpretation
Safety And Risk Interpretation
For the Safety And Risk angle, the data show that in 2022 construction still accounted for 4.3% of establishments with days-away-from-work injuries while also representing 23% of all U.S. fatal workplace injuries, and 12% of firms report safety incidents that led to regulatory fines in the past year.
07 · Category
Labor Markets1 stats
01
5.0% annual turnover among construction trade workers is indicated by a 2022 survey benchmark on contractor workforce churn published by workforce analytics provider Human Capital Institute (HCI) in its contractor labor report
Interpretation
Labor Markets Interpretation
The 2022 contractor labor benchmark shows that construction trade workers experience a 5.0% annual turnover rate, indicating a relatively steady pace of worker churn within the commercial general contracting labor markets.
08 · Category
Performance And Profitability1 stats
01
Construction insurance premiums increased by 6% in 2023 in the US, based on an industry market update by Marsh McLennan (public insurance market commentary article) citing insurers’ rate changes
Interpretation
Performance And Profitability Interpretation
In 2023, construction insurance premiums rose 6% in the US, signaling a direct cost pressure that can squeeze performance and profitability for commercial general contractors even as pricing continues to shift.
Reference
Cite This Report
This report is designed to be cited. We maintain stable URLs and versioned verification dates. Copy the format appropriate for your publication below.
APA
Kevin O'Brien. (2026, February 13). Commercial General Contracting Industry Statistics. Gitnux. https://gitnux.org/commercial-general-contracting-industry-statistics
MLA
Kevin O'Brien. "Commercial General Contracting Industry Statistics." Gitnux, 13 Feb 2026, https://gitnux.org/commercial-general-contracting-industry-statistics.
Chicago
Kevin O'Brien. 2026. "Commercial General Contracting Industry Statistics." Gitnux. https://gitnux.org/commercial-general-contracting-industry-statistics.
Sources & references
28 datasets cited across this report · attribution is report-level
+9 additional datasets cited (not shown individually)